Review of dynamic line rating systems for wind power integration - Core
←
→
Page content transcription
If your browser does not render page correctly, please read the page content below
RENEWABLE & SUSTAINABLE ENERGY REVIEWS

Review of dynamic line rating systems for wind power integration
E. Fernandeza, I. Albizua, M.T. Bedialaunetaa, A.J. Mazona, P.T. Leiteb
a
 Department of Electrical Engineering, University of the Basque Country UPV/EHU
Bilbao, Spain
elvira.fernandezh@ehu.es igor.albizu@ehu.es miren.bedialauneta@ehu.es javier.mazon@ehu.es
b
 Center of Engineering, Modeling and Applied Social Sciences - CECS, Universidade Federal do ABC – UFABC
Santo André - Brazil
patricia.leite@ufabc.edu.br

Abstract

When a wind power system is connected to a network point there is a limit of power generation based on the characteristics of
the network and the loads connected to it. Traditionally, transmission line limits are estimated conservatively assuming
unfavourable weather conditions (high ambient temperature, full sun and low wind speed). However, the transmission capacity
of an overhead line increases when wind speed is high, due to the cooling caused by wind in the distribution lines.

Dynamic line rating (DLR) systems allow monitoring real weather conditions and calculating the real capacity of lines. Thus,
when planning wind power integration, if dynamic line limits are considered instead of the conservative and static limits,
estimated capacity increases.

This article reviews all technologies developed for real-time monitoring during the last thirty years, as well as some case
studies around the world, and brings out the benefits and technical limitations of employing dynamic line rating on overhead
lines. Further, the use of these DLR systems in wind integration is reviewed.

Keywords: wind power, dynamic line rating, wind integration, conductor temperature, sag, tension, weather monitoring

1. Introduction

   Taking into account the levels of CO2 emissions [1-13] and in order to fulfil the Kyoto Protocol commitments, the
contribution of renewable energy to the future generation will have to increase significantly from current levels. A good
example is that the European Commission has set itself an ambitious target of 20% of total energy consumption to be supplied
by renewable energy sources in 2020.

   One of the challenges to achieving this goal is the need to expand or strengthen the distribution network in order to
accommodate the large penetration of wind power. However, commissioning time of distribution network projects is usually
longer than the time needed to build a wind farm. Therefore, recently built wind farms might be ready to generate power, but
their evacuation lines have insufficient transmission capacity. Accordingly, wind power plants have to limit their generation in
this situation. However, the now ever present solutions for the "smart grid" suggest the possibility of using the existing network
more efficiently, so that wind power evacuation is not limited due to network congestion [14].

   Another aspect to consider is the repowering of wind farms, i.e. the replacement of existing wind turbines by new-
generation wind turbines [15, 16]. The replacement of those first generation turbines has several advantages. For example,
modern wind turbines often include control systems of reactive power and immunity to voltage dips, which are very important
for the electrical system operation. But the increase of wind power penetration can reach a limit due to an insufficient capacity
of the network in which the energy is injected.

   Wind power is cheap and clean. If wind power is curtailed due to congestions in the grid, the curtailed amount of power has
to be produced in other power plants, usually thermal, which are more expensive and have higher impact on the environment.
For this reason, investment in the grids is justified. As an example, in the European transmission network ten-years
development plan, the development of renewable energy is found to be the major driver for grid development. Projects of pan-
European significance help avoid 30 to 100 TWh of renewable energy spillage globally, reducing it to less than 1% of the total
supply [17].

   However, the high population density, the intensive use of land and the increasing rejection of new electrical installations
determine that a small amount of space is available to be dedicated to electrical lines. Dynamic line rating (DLR) systems are
an option for delaying the construction of new lines. The cost for monitoring a circuit, including installation of the equipment
and the software, is less than 2% of the cost of achieving equivalent gain by conventional techniques [18].

    Line rating represents the line current which corresponds to the maximum allowable conductor temperature for a particular
line without clearance infringements or significant loss in conductor tensile strength due to annealing. Transmission of electric
power has traditionally been limited by conductor thermal capacity defined in terms of a static line rating, which is based on
constant weather conditions over an extended period of time, days, months or years. So, transmission line limits are estimated
conservatively assuming unfavourable weather conditions (static limit). Typically, low wind speeds (0,6 m/s), full solar
radiation (1000 W/m2) and high air temperature (40 ºC) are assumed for the static line rating calculation [19]. Usually, the
weather conditions result on a higher conductor cooling and for this reason the actual thermal capacity is higher than the
calculated static line rating. For this reason, in the last two decades, technologies and strategies have emerged to allow the real-
time or pseudo-real-time measurement of transmission line characteristics and weather conditions, enabling the calculation of
real-time rating [20]. Different experiences with real time monitoring show an increase of 10-30% in thermal capacity over the
capacity estimated conservatively [18].

    Dynamic line rating (DLR) estimates line ampacity (maximum current carrying capacity of a transmission line) in real time
with instant monitored weather conditions, taking account of the wind cooling effect. When wind energy is high, wind incident
on lines is expected to be higher than the one considered for calculating the static limit. Therefore, transmission capacity of
lines increases along with wind speed, because of the increased cooling. So, a correlation between wind power and the
evacuation capacity of close lines exists (dynamic limit). Thus, when planning wind power integration, considering the
dynamic line limit rather than the static limit increases estimated capacity [21, 22, 23, 24, 25, 26, 27].

   These systems need only be installed on critical spans, where limit violations may occur. The identification of critical spans
can be carried out with the help of design information and by inspection of transmission lines [28]. This allows the system
operator to ensure that conductor temperature does not exceed the design limit, and line utilization under all conditions is
maximized.

    Ampacity limit is usually related to sag limit, which is related to a certain conductor temperature value. However, in some
cases, when the limit is determined by the annealing of the conductor, ampacity limit is directly related to the conductor
temperature. The values of sag and temperature can be measured directly or calculated from measurements of other
magnitudes. So, a dynamic line rating can be performed using several monitoring methods including weather monitoring,
tension monitoring, sag monitoring and line temperature monitoring [22, 29, 30].

The way to determine the dynamic line limit is by using DLR systems [30]. These systems monitor actual weather conditions
and rate the real capacity of the lines under study. So, it is possible to know if a given line can support more or less load.
However, the way of monitoring the network also provides a series of questions, such as where to place the sensors. The ideal
would be to install them in all lines, but this is much more expensive and if not, there may be uncertainties because weather
conditions are different in different points / spans. Some commercial systems to measure ampacity have been presented in the
market, based on several strategies. This paper introduces a literature review, of all technologies developed for real-time
monitoring during the last thirty years, as well as some case studies around the world, and brings out the benefits and technical
limitations of employing dynamic line rating on overhead lines. Further, the use of these DLR systems in wind integration is
reviewed.

2. Dynamic Line Rating Systems

    DLR systems can be classified according to the magnitudes that are monitored. The magnitudes that are needed for the
calculation of ampacity are weather magnitudes: wind speed and direction, solar radiation, and ambient temperature. Making a
thermal calculation, ampacity is calculated as the current intensity value which equals conductor temperature to its maximum
allowable value (Fig.1). This thermal calculation is defined and applied through the publication of Standards by the IEEE [31]
and CIGRE [32] which provide the mathematical models defining the thermal behavior of the conductor.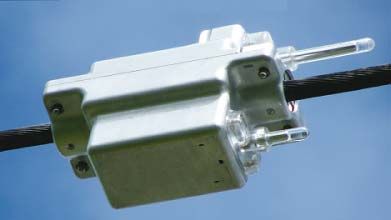
Figure 1. DLR: meteorological variables

    Due to the uncertainties related to wind speed measurements, many DLR systems measure directly the overhead conductor
temperature. This magnitude is used to calculate the effective wind speed that cools the conductor. The effective wind speed is
the wind that for the measured current intensity, ambient temperature and solar radiation results in the measured conductor
temperature. This thermal calculation is carried out by the IEEE and CIGRE models mentioned above. The wind direction is
assumed to be perpendicular to the conductor. Finally, ampacity is obtained from the calculated wind speed, which is
perpendicular to the conductor, and the measured ambient temperature and solar radiation (Fig. 2).

                                  Figure 2. DLR: conductor temperature and meteorological magnitudes

    Other DLR systems measure overhead tension or sag. In this case, an additional step is necessary, and the conductor
temperature is derived from these magnitudes (Fig. 3). The overhead line mechanical model is used to relate the conductor
tension or sag with the conductor temperature. When the conductor temperature increases the sag increases and the tension
decreases and vice versa. Once the conductor temperature is obtained, the same procedure described in Figure 2 is followed to
calculate the ampacity.

                                        Figure 3. DLR: tension/sag and meteorological variables

   Following, DLR systems are described according to the magnitude being monitored.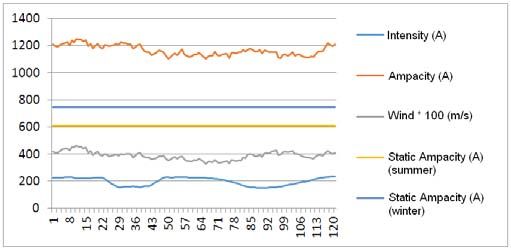
2.1. Weather monitoring

    Dynamic line rating by weather monitoring is the simplest system. It is also the least invasive system as it does not need to
be physically installed in the line. Hence, making use of weather stations installed in substations, weather monitoring is easy to
apply.

    The main drawback is that conditions, especially wind, can change along the line due to land irregularities, forests, etc.
Hence, there is a degree of uncertainty in the results that can be important in some cases. Another drawback is related to cup
anemometers, as these can have measurement errors below 1 m/s wind velocities. This wind velocity range is the most
unfavourable from the point of view of ampacity. Figure 4 shows the conductor temperature change as a function of wind
speed. When the wind speed is low, low wind speed changes result in high conductor temperature changes. Above 3 m/s, the
conductor temperature is almost unaffected by wind speed changes.

                                             Figure 4. Conductor temperature vs wind speed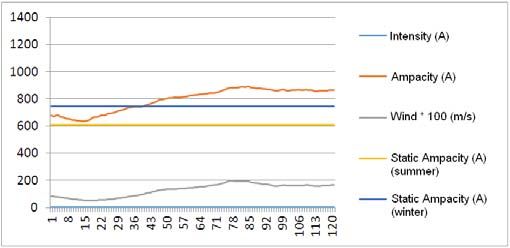
Table 1 shows different studies developed by some companies and institutions during the last years in different countries.
The aim of these studies is to estimate line ampacity from meteorological variables.
Year Countries Power Utility/ University Wind integration Reference
1991 USA Pacific Gas & Electric Company [33]
Georgia Power Company
1996 USA [34]
EPRI
PECO Energy
1997 USA [35]
EPRI
1997 Korea Korea Electric Power Corporation KEPCO [36]
REE
1998 Spain [37]
Iberdrola
2004 USA Idaho Power Company [38]
CESI Ricerca
2008 Italy [39]
TERNA
2008 Germany E.ON Netz [40]
VERBUND-Austrian Power Grid
2008 Austria [41]
Graz University of Technology
AREVA
2009 England [24]
E.ON
2010 Northern Ireland Northern Ireland Electricity NIE [42], [43]
2011 UK ScottishPower [44]
2011 Portugal EDP Distribuicao [45]
RWTH Aachen University
2012 Germany TenneT TSO [46]
Amprion
Idaho National Laboratory
2012 USA Idaho State University [47]
Idaho Power Company
2013 North Wales SP Energy Networks [48]
Table 1.Studies of the ampacity from meteorological variables
There is a commercial system, called ThermalRate [49], that calculates wind speed instead of measuring it (Figure 5). Two
identical metallic rods are situated in the tower. The rods can have different emissivity and absorptivity values from the
conductor. The tubes are situated parallel to the conductor. In one of the rods, current is injected, while in the other, no current
is injected. The injected current intensity is measured. Temperature is also measured in both rods by an embedded
thermocouple. One rod is heated and the other rod is unheated. The thermal equation is applied in the rod where current is
injected in order to get the equivalent wind velocity. Instead of using ambient temperature Ta, the solar temperature Ts
measured in the rod where no current has been injected is used. Ampacity is calculated from the solar temperature Ts and the
calculated equivalent wind velocity [50, 51]. Some application cases are shown in [45, 52, 53].
ThermalRate
(Pike)
Figure 5. ThermalRate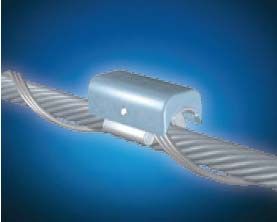
2.2. Conductor temperature monitoring
An alternative to reduce the uncertainty related to the calculation of conductor temperature is direct monitoring. Conductor
temperature is monitored by a sensor installed in the conductor that measures its surface temperature. However, the conductor
temperature can change along the line due to the change of weather conditions. Sag is a function of average temperature,
whereas the monitoring system gives a local temperature value. Besides, a radial temperature gradient can be present in the
conductor.
Several commercial systems are available (Figure 6):
The first commercial system based on conductor temperature monitoring, the Power Donut [54], was developed in the
early eighties [55, 56] (Figure 6.a.). Besides monitoring conductor temperature, the Power Donut monitors current
intensity and the conductor angle of inclination. The latter is related to the conductor sag value. It is a toroid coupled
to the conductor. It is self-supplied by the tension induced by the magnetic field related to conductor current. It needs
a minimum turn on intensity of 70 A. An internal battery allows one hour of operation when current intensity is below
this value. It can measure conductor temperature up to 150 ºC. In order to calculate ampacity, the system needs
ambient temperature and solar radiation values. These magnitudes can be obtained from a weather station nearby. In
case this is not possible, the system offers the possibility of installing a weather station that measures ambient
temperature and solar radiation in the tower that is closest to the temperature sensor. Weather values are transmitted to
the Power Donut via radio. Some application cases are shown in [55, 57, 58, 59].
The Temperature Monitoring System (SMT) [60] is similar to the Power Donut (Figure 6.b.). Besides monitoring
conductor temperature, it monitors current intensity. It is self-supplied with a minimum turn on intensity of 100 A. It
can measure conductor temperature up to 250 ºC. Some application cases are shown in [45, 61, 62, 63].
The FMC-T6 measures conductor temperature, and current intensity, and it is self-supplied [64] (Figure 6.c.). It is part
of the Multilin Intelligent Line Monitoring System of General Electric. It can measure conductor temperature up to 85
ºC. Some application cases are shown in [43, 65].
The Overhead Transmission Line Monitoring (OTLM) [66] is also similar to the Power Donut (Figure 6.d.). Besides
monitoring conductor temperature, it also monitors current intensity. It is self-supplied with a minimum turn on
intensity of 65 A. It can measure conductor temperature up to 125 ºC. Some application cases are shown in [67, 68,
69].
A similar but more complete device is the Transmission Line Monitor (TLM) system [70] (Figure 6.e.). Besides
monitoring conductor temperature, it monitors its sag. Sag is obtained by using LIDAR technology that determines the
height of the conductor from its position to the ground. Furthermore, it measures conductor tilt and roll with a dual
axis accelerometer. It is self-supplied with a minimum turn on intensity of 100 A. It can measure conductor
temperature up to 250 ºC.
The emo device is a simple system that only measures conductor temperature [71] (Figure 6.f.). Another difference is
the supply option, because instead of being self-supplied it is battery supplied. The standard version can measure
conductor temperature up to 85 ºC, whereas the high temperature version can measure up to 210 ºC. An application
case is shown in [72].
A different option is monitoring temperature by a device based on surface acoustic wave (SAW) [73]. This device is
called Ritherm [74] (Figure 6.g.). The system comprises a radar that sends and receives high frequency
electromagnetic waves and a passive SAW sensor installed on the conductor. The SAW passive sensor is a
piezoelectric crystal that reacts moving with the electromagnetic wave sent by the radar. In the crystal, some elements
convert the movement into electromagnetic waves which are received by the radar. It is possible to determine the
position of the elements. The position is a function of the elongation associated to temperature value. Besides, wave
velocity in the crystal depends on temperature. With this system, temperature up to 150 ºC can be obtained with an
uncertainty of 0.5 ºC. This sensor is installed on the overhead line using the helical preformed rods [68]. Some
application cases are shown in [46, 69, 75, 76, 77].Power Donut (USi) SMT (Arteche) FMC-T6 OTLM (OTLM)
(a) (b) (General Electric) (d)
(c)
(TLM (Lindsey) Ritherm
emo (micca) (RIBE Group)
(e)
(f) (g)
Figure 6. Commercial systems based on conductor temperature monitoring
From Table 2 to Table 6 different aspects of commercial systems based on conductor temperature monitoring are compared.
Conductor temperature Current intensity Tilt angle Sag
Power Donut x x x
SMT x x
OTLM x x
TLM x x x
FMC-T6 x x
emo x
Ritherm x
Table 2.Parameters measured
Minimum Maximum Conductor
conductor conductor temperature
temperature (ºC) temperature (ºC) accuracy
Power Donut -50 150 0.5 %
SMT 0 250 -
OTLM -40 125 2 ºC
TLM - 250 -
FMC-T6 -10 85 2 ºC
emo standard -25 85 1.5 ºC
emo high temperature -25 210 1.5 ºC
Ritherm -35 150 0.5
Table 3. Conductor temperature measured and accuracyMinimum Maximum
Current intensity
current intensity current intensity
accuracy (%)
(ºC) (ºC)
Power Donut 0 3000 0.5
SMT 100 1400 -
OTLM 65 - -
FMC-T6 300 10 300 1
FMC-T6 600 30 600 1
Table 4. Current intensity measured and accuracy
Conductor Turn on intensity Battery back-up Battery life-time
sensor supply (A) (hour) (year)
Power Donut Self-supplied 70 1
SMT Self-supplied 100 0
OTLM Self-supplied 65 0
TLM Self-supplied 100 0
FMC-T6 300 Self-supplied 10 48
FMC-T6 600 Self-supplied 30 48
emo Battery supplied 10
Ritherm Passive (central
unit needs supply)
Table 5. Supply
Weight (kg)
Power Donut 9.2
SMT 6
OTLM 9.5
TLM 11
FMC-T6 6
Table 6. Weight
Apart from the mentioned commercial conductor temperature monitoring systems, another option for measuring the
conductor is the distributed temperature sensing (DTS). It is possible to determine temperature distribution along the conductor
by using optical fibers embedded in it. Some application examples are shown in [78, 79, 80, 81, 82, 83, 84, 85].
On the other hand, in [86] thermal rating calculation methods based on indirect conductor temperature monitoring are
compared. These methods use the measurements of the key parameters that affect the allowable conductor temperature, like
conductor temperature, ambient temperature, “ground clearing distance”, humidity and wind speed.
Finally, some academic projects which have resulted in temperature monitoring system prototypes have also to be
mentioned:
The Georgia Institute of Technology has developed two different prototypes. The objective is to design cheap and
self–supplied devices. The developed systems measure conductor temperature and current intensity. The first system,
called Power Line SensorNet (PLSN), is designed using commercially available low power devices [87]. The second
system is a stick-on sensor [88].
The Isfahan University of Technology and the University of Manitoba have developed a device that measures
temperature based on radio frequency cavity resonance [89].Table 7 shows some experiences during the last years developed by different companies and institutions in some countries,
aiming to estimate the ampacity based on meteorological parameters and the conductor temperature.
Wind
Year Country Power Utility/University DLR Reference
integration
1988 USA RG&E [90] [91]
1990 USA Niagara Mohawk Power Corporation [92]
Commonwealth Edison
1996 USA Power Donut [55]
Niagara Mohawk Power Corporation
2001 Egypt University of Zagazig [93]
TransGrid
2004 Australia DTS [80]
J-Power Systems
CEMIG
Power Donut [57]
2004 Brazil NEXANS
UFMG CAT-1
Xcel Energy ThermalRate™
2006 USA [53]
Marshall Municipal Utilities System
2006
Switzerla Atel Transmission Ritherm
[75] [76]
nd ETRANS CAT-1
2008 Spain ARTECHE SMT [60]
2009 USA Georgia Institute of Technology PLSN [100] [95] [96] [97]
2010 UK
Areva
Power Donut [59]
Eon/Central Networks
2010 Germany E.ON EMO [72]
Scottish Hydro Electric Power
2011 UK Distribution Durham University Power Donut [58]
Smarter Grid Solutions
NSERC
2011 Canada SMT [26]
BC Hydro R&D
2011 Spain REE DTS [98]
2012 Slovenia OTLM (C&G) OTLM [99] [68]
2013 Spain
E.ON Distribución
SMT [62]
University of Cantabria
2013 Sweden Vattenfall Distribution Power Donut [100]
2014 Spain REE DTS [101]
Table 7.Studies of the ampacity from meteorological variables and the conductor temperature
2.3. Tension monitoring
Tension is monitored by a load cell that is installed in series with the insulator strings. The load cell is located between the
tower and the insulator string, so that it is electrically insulated from the conductor. There is a direct relation between tension
and sag values, and for this reason, tension monitoring is a good indicator of the line condition when sag is the magnitude to be
controlled. Sag is calculated based on tension value, span length and the weight per length unit of the conductor. Whereas the
conductor temperature measurement is a local measurement, tension represents the average condition of all the spans between
two tension towers.
There is only one commercial tension monitoring system called CAT-1 [28, 102, 103] (Figure 7). This system is calibrated
in order to establish the relation between tension and conductor temperature. Besides, it has a special system which enables to
measure weather values in an indirect way. With respect to calibration, it is based on measuring pairs of tension-temperature
values. In the one hand, a reference for tension and conductor temperature is established. In the other hand, the value of the
ruling span is obtained. Once the calibration has been carried out, temperature can be derived from tension measurement. The
special system that measures weather values in an indirect way is known as Net Radiation Sensor. It is an aluminium tube with
the same emissivity and absorptive values as the conductor. It is installed in the same tower where the load cell is installed. The
tube is situated parallel to the conductor. A temperature sensor measures the temperature of the aluminium tube. This
temperature represents the temperature that the conductor has with no current intensity. The Net Radiation Sensor is also used
for the aforementioned calibration. The conductor temperature value needed for the calibration is not measured directly but it is
estimated from the temperature measured in the Net Radiation Sensor. In order to establish a correspondence between both
temperatures, current intensity has to be very low. Some application cases are shown in [22, 28, 50, 78, 104, 105, 106, 107].CAT-1
(The Valley Group – Nexans)
Figure 7. Commercial system based on tension monitoring
In addition, a university project that has resulted in a tension monitoring system prototype has to be mentioned. The
University of the Basque Country UPV/EHU has developed the Tension and Ampacity Monitoring (TAM) system [108, 109].
It is based on the monitoring of conductor tension, ambient temperature, solar radiation and current intensity. The system takes
into account the creep deformation experienced by the conductors during their lifetime and calibrates the tension-temperature
reference and the maximum allowable temperature in order to obtain the ampacity.
Table 8 shows different studies developed by companies and institutions during the last years in different countries. The
aim of these studies is to estimate line ampacity from the meteorological variables and tension.
Countri
Year Power Utility/University Commercial Name Wind integration Reference
es
1993 USA The Valley Group CAT-1 [105]
Northeast Utilities
1995 USA Nevada Power CAT-1 [106]
PSE&G
1998 USA Virginia Power CAT-1 [102]
1999 USA California Energy Commission CAT-1 [110]
New
2000 Transpower New Zealand CAT-1 [22] [107] [111]
Zealand
2002 USA Pacific Gas & Electric Company CAT-1 [28]
Netherla CAT-1
2002 Transportnet Zuid Holland [78]
nds DTS-System
CEMIG
Power Donut [57]
2004 Brazil NEXANS
UFMG CAT-1
Switzerl Atel Transmission SAW
2006 [75] [76]
and ETRANS CAT-1
2011 Australia TransGrid [112]
2011 Brazil COPEL [113]
East China Power Grid
2011 China Guangdong Power Grid Corporation [114]
Electric
University of the Basque Country
2013 Spain TAM [108]
UPV/EHU
RT-TLMS
2013 USA Oncor Electric Delivery Company CAT-1 [115]
Sagometer
Table 8. Studies of the ampacity from meteorological variables and the tension monitoring
2.4. Sag monitoring
Although there are a few proposed systems for sag real time monitoring, currently there is only one commercial system, the
Sagometer (Figure 8). This system is based on image processing [116]. A target is connected to the conductor in the middle of
the span, and a video camera situated in the tower monitors the movement of the target. The system captures and processes
images and calculates the sag. Additionally, a current intensity and weather measuring system can be added in order to obtain
the ampacity. The complete system is called Span Sentry [117].Sagometer/Span Sentry
(EDM)
Figure 8. Commercial system based on sag monitoring
2.5. Vibration monitoring
One of the last proposals (Ampacimon), developed in Belgium, determines sag value by conductor vibration analysis [118,
119, 120]. It is based on monitors placed directly on the line (Figure 9). These monitors, equipped with acceleration sensors
and electronics, measure conductor mechanical movements with a very high sensitivity. Ampacimon processes these
measurements and calculates the conductor sag. Some application cases are shown in [81, 121, 122].
Ampacimon
(Ampacimon)
Figure 9. Commercial system based on vibration monitoring
2.6. Electromagnetic field monitoring
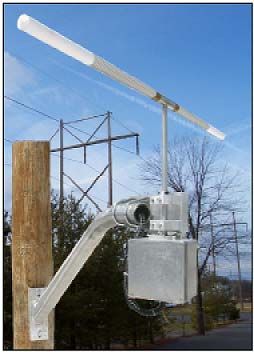
Promethean Devices has developed the Real-Time Transmission Line Monitoring System (RT-TLMS) [123]. It is a non-
contact, real time sensor system for the monitoring of HV overhead transmission lines (Figure 10). The system uses calibrated
AC-magnetic field sensors, located roughly under the phase conductors, to accurately and reliably measure the 3 phase AC
magnetic fields. Once installed in the transmission row and calibrated, the system reports 3 phase currents, conductor
clearance, and maximum conductor temperature [124].RT-TLMS
(Promethean Devices)
Figure 10. Commercial system based on electromagnetic field monitoring
Table 9 shows different studies developed by companies and institutions during the last years in different countries. The aim of
these works is to estimate line ampacity from conductor sag.
Year Countries Power Utility/University Commercial Name Wind integration Reference
2001 USA Arizona State University [125] [126]
2003 USA California Energy Commission Sagometer [127]
Elia
2006 Belgium Ampacimon [118]
University of Liége
2011 Belgium
Elia
Ampacimon [128]
University of Liége
2012 Belgium
Elia
Ampacimon [129]
University of Liége
2013 Belgium University of Liége Ampacimon [130]
RT-TLMS
Oncor Electric Delivery
2013 USA CAT-1 [115]
Company
Sagometer
2014 Belgium University of Liége Ampacimon [131]
Table 9. Studies of the ampacity from sag conductor
3. Dynamic line rating and wind power integration
The development of dynamic line rating systems started three decades ago. Dynamic line rating systems are interesting
because they give an actual value of line rating. However, the use of these systems in the power network is not widespread
because in many cases there is little correlation between need (instants with high flow) and availability (instants with high
transmission capacity). This situation has changed with the increase of wind power generation. Therefore, there are more and
more grids where there is a high correlation between need (instants with high flow due to high wind generation) and
availability (instants with high transmission capacity due to the wind cooling). As a result, several utilities are considering
dynamic line rating systems as a practical option for maximizing the capacity of their assets. Examples of studies carried out
recently in order to assess the viability of DLR systems in grids with high wind power penetration are found in Ireland, United
Kingdom, Canada, Spain, or Germany, as an instance.
Different types of studies have been carried out. Some of them have been performed in real installations, where overhead
lines have been monitored and obtained measurements have been analysed. Other studies have been carried out with
simulations, including Active Network Management schemes, Computational Fluid Dynamics modelling or Monte Carlo
simulations. On the other side, some projects have focused on estimating the additional wind generation integrated using DLR
systems, while other research works have evaluated how to integrate DLR systems with control centres or with the congestion
management.3.1. Real installations
In Northern Ireland, there is a need to reinforce the network due to the increase of wind energy, and since 2008 the
Northern Ireland Electricity (NIE) has installed DLR systems in order to maximize the capacity of the grid. One of the
monitored lines is the Dungannon – Omagh 110 kV line, which connects the West of North Ireland, with high wind power
production, and the East, with high power demand. This project is described in [42, 43, 65, 130, 132]. [42, 43, 65], compare in
different graphs actual weather magnitudes (ambient temperature and wind speed) to magnitudes used for the static method,
and conclude that DLR can accommodate the additional capacity required on the line when additional wind generation is
introduced. Hence, wind curtailment on existing wind farms can be reduced with DLR systems. Besides, [43] presents the
scheme of the system architecture for incorporation of DLR into the Distribution Control Centre. [130, 132] show figures
where a positive correlation between dynamics ratings and wind speed at the wind farm is observed.
Queen’s University Belfast uses weather and line data measured on the Dungannon-Omagh 110 kV line and on the Kells-
Coleraine 110 kV line in order to complement the Northern Ireland Electricity’s studies. [134, 135] show in different figures
the improvement in ampacity using DLR. Besides, [134, 136, 137] describe the experimental program where two test rigs have
been constructed in order to examine the thermal behavior of the conductor under controlled weather conditions. The authors
analyse graphically the effect of wind speed on conductor temperature and the correlation between wind generation and line
capacity. All studies show that the higher wind generation corresponds to a higher line capacity.
In UK E.ON Central Networks has applied DLR for load management and protection of a 132 kV line between Skegness
and Boston (North East of England). This project is described in [24, 59, 138, 139] and shows the dynamic ampacity as a
function of wind speed for different ambient temperatures and the static ampacity. It can be concluded that for most wind
speeds and ambient temperatures, ampacity is larger than the one obtained using the static method. So, it is possible to integrate
more wind generation into the grid taking into account the cooling effect of wind. The authors estimate an increase in the wind
generation from 20% to 50%.
Furthermore, Durham University, ScottishPower Energy Networks Imass, PB Power and AREVA T&D have developed a
DLR technology which is applied to a 132 kV conductor, in order to facilitate the connection of over 200 MW of wind
generation [44]. [140] displays two figures: first, the conductor rating exposed to different wind speeds and second, real time
dynamic ratings compared to the static rating, with the static rating of the line re-tensioned and with the static rating of the new
line reinforced. This research work concludes that “the adoption of a DLR system can provide a 67% gain in energy transfer
capacity at 62% of the re-tensioning cost”.
The TWENTIES project gathered a group of Transmission System Operators from Belgium, Denmark, France, Germany,
Spain, and the Netherlands, generator companies, power technology manufacturers, wind turbine manufacturers and some
research and development organizations. Two of the objectives of this project were first, to demonstrate how much additional
wind generation could be handled thanks to DLR (NETFLEX), and second, to prove that the current transmission network was
able to meet demand of renewable energy by extending the system operational limits, maintaining safety criteria (FLEXGRID)
[78]. Part of the conclusions drawn from NETFLEX was that “DLR forecaster enables an average increase of 10-15% in the
usable transmission capacity of overhead lines”. Additionally, FLEXGRID draws the conclusion that “most days the dynamic
ratio throughout the day is more than 10% higher than the seasonal rating. On windy days, it could be more than 100% higher
over the day” [81, 103, 106, 133, 134, 135, 131].
In Sweden, overhead lines threaten to become bottlenecks for the increase of wind power. [100] compares the traditional
static rating and DLR, infers that a high capacity of overhead lines is not used during a large percentage of the time. Other
similar studies in this line are the one performed in Spain by the University of Cantabria in [62], or still the research work
carried out by Marshall Municipal Utilities, Shaw Energy Delivery Services and Xcel Energy in Minnesota (USA) [53]. The
latter underlines that the actual line rating is above the static rating 96% of the time.
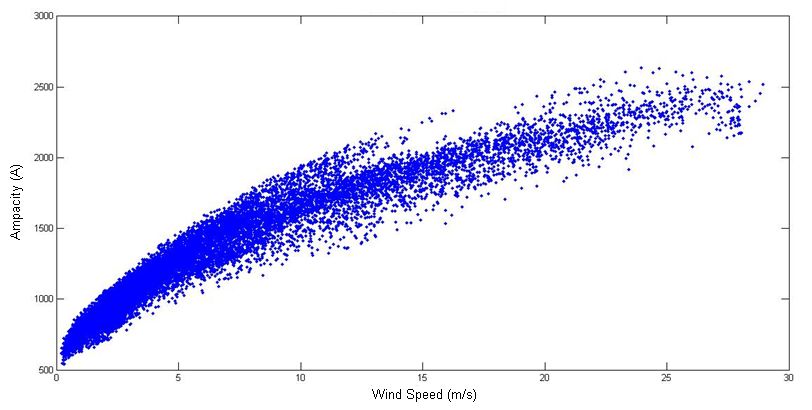
In the north of Spain, in the on-shore wind farm La Sía, the University of the Basque Country has installed a DLR system
to monitor a wind farm evacuation line of 66 kV. Figure 11 shows the effect of the wind speed on the ampacity. The higher
wind generation corresponds to a higher line capacity.Figure 11. Relation between wind speed and ampacity.
Wind is the most influential parameter that affects the conductor temperature and the ampacity. There is a clear relation
between wind generation and the ampacity of the line. Figure 12 shows two periods of time, one with wind and wind
generation (a) and another with low wind and no wind generation (b). It is observed that in the windy period ampacity is 1200
while the period with little wind this value is reduced to 800 A.
(a) (b)
Figure 12. (a) Period with wind and wind generation. (b) Period with low wind and no wind generation.
3.2. Simulations
The integration of DLR systems with control centres has also been studied. In [58, 141, 142] initial results from the
deployment of a DLR system on the Onkey Isles (isles where the connection and operation of distributed generation is high)
and its integration with the Active Network Management (ANM) scheme are presented. The authors conclude that the addition
of DLR to the existing ANM scheme reduces potentially curtailment in the region between 47% and 81%, and so, it allows the
connection of additional 4 MW. [44] introduces a DLR system trialed in open-loop control mode. Authors show graphically a
representation of a set of field data as ambient temperature, current, wind speed and conductor temperature, and it is observed
that the line operates with very wide thermal margins. Therefore, the authors present a strategy which combines the DLR
system with a network flow management system, which will be at the disposal of Scottish Power as part of its operation and
control system.
SP Energy Networks and Durham University use FLUENT 12.1 for studying a real wind farm connection in north Wales
[143]. This study shows that “a wind farm of 140MW can be connected to a conductor which could only support 90MW based
on its static rating, and if the route is chosen correctly only 1% of the energy yield will be constrained”.There are other studies that consider the use of DLR systems for increasing line capacity based on simulation models.
Natural Sciences and Engineering Research Council of Canada and the University of Alberta analyse in [26] the reduction of
power generation emissions that can be achieved using DLR systems to integrate more distributed generation on the existing
power grid. Different operating cases are simulated and the increase in available capacity using DLR systems is presented. The
authors show that, in the worst case, there is a loss of 149.9A in capacity while in the best case a gain of 1956.17 A is achieved.
In Germany, DLR systems have been examined in order to improve the integration of wind power generation into the
transmission system and the congestion management [23, 144]. [144] modelled a reduced sample network (28 nodes) to
reproduce realistic situations in the current German transmission system, while the case study in [23] presents a future scenario
(2015) with increased installed capacity of wind power. The authors simulate the congestion management with and without
DLR systems, and they conclude that redispatched energy during a whole year is reduced by about 85% with DLR systems.
Other studies where a significant increase of transmission capacity compared to the static rating is indicated are [21] where
a multi-period AC Optimal Power Flow (OPF)-based technique is used, [145, 146] where Monte Carlo simulation is used, and
[25] where a probabilistic approach is applied to generate different scenarios of wind power output and thermal ratings of
overhead lines. Furthermore, in [147] a thermal model is used and the cooling effect of wind in overhead power lines required
for the evacuation of energy generated by wind farms is analysed.
4. Conclusions
DLR systems are based on methods that allow increasing line power flow securely and safely. So, there is no need to
strengthen the towers. These systems are particularly useful on lines which are connected to wind farms, often with an
insufficient transmission capacity. Wind plays an important role in line cooling, and therefore, under most circumstances, DLR
limit is higher than static line rating, and DLR based methods are more accurate. So, the application of DLR will effectively
increase line ampacity and postpone the necessity to upgrade the existing network to integrate more renewable energy
generation.
This paper has introduced a literature review of all technologies developed for real-time monitoring, as well as some case
studies around the world. In addition, the benefits and technical limitations of employing dynamic line rating on overhead lines
versus traditional static methods have been described. And the use of these DLR systems in wind integration has been
reviewed.
Acknowledgments
This work is financially supported by the Ministerio de Economía y Competitividad under the project DPI2013-44502-R
and the Eusko Jaurlaritza under the project SAI12/103.
References
[1] Zhaohua Wang, Lin Yang, Delinking indicators on regional industry development and carbon emissions: Beijing-Tianjin-
Hebei economic band case, Ecological Indicators, 48(2015), pp41-48.
[2]Zhang ZX. Why did the energy intensity fall in China's industrial sector in the 1990s? The relative importance of structural
change and intensity change. Energy Economics 2003;25: 625-38.
[3] Zhaohua Wang, Fangchao Yin, Yixiang Zhang, Xian Zhang, An Empirical Research on the Influencing Factors of Regional
CO2 Emission: Evidence from Beijing City, China, Applied Energy, 107(2012), pp451-463.
[4] Blesl M., Das A., Fahl U., Remme U. (2007). Role of energy efficiency standards in reducing CO2 emissions in Germany:
An assessment with TIMES. Energy Policy 35, 772-785.
[5] Zhaohua Wang, Hualin Zeng, Yiming Wei,Yixiang Zhang, Regional total factor energy efficiency: An empirical analysis of
industrial sector in China, Applied Energy, 97(2012),pp115-123.
[6] Zhaohua Wang , Chen Wang, Jianhua Yin, Strategies for addressing climate change on the industrial level: affecting
factors to CO2 emissions of energy intensive industries in China, Nature Hazards, DOI 10.1007/s11069-014-1115-6.
[7] Blackman A, Morgenstern R., Montealegre L., Murcia L., and García J. (2006). Review of the efficiency and effectiveness
of Colombia's environmental policies. An RFF Report.
[8] Bentzen J. Estimating the rebound effect in U.S manufacturing energy consumption. Energy economics 2004; 26:123-134.
[9] Zhaohua Wang, Lu Milin, Jiancai Wang, Direct rebound effect on urban residential electricity use: An empirical study in
China,Renewable and Sustainable Energy Reviews, 30(2014), pp 124-132.[10] Jin SH. The effectiveness of energy efficiency improvement in a developing country: Rebound effect of residential electricity use in South Korea. Energy Policy 2007; 35:5622-5629. [11] Zhang Bin, Wang Zhaohua, Inter-firm collaborations on carbon emission reduction within industrial chains in China: practices, drivers and effects on firms' performances,Energy Economics, 42(2014), pp115-131. [12] Sorrell S, Dimitropoulos J. The rebound effect: Microeconomic definitions, limitations and extensions. Ecological Economics 2008; 65: 636-649. [13] Zhaohua Wang, Chao Feng, Bin Zhang, An empirical analysis of China's energy efficiency from both static and dynamic perspectives, Energy, 74(2014), pp322-330. [14] European Commission, "European SmartGrids Technology Platform" 2006. [15] L. Castro, A. Filgueira, Mª A. Seijo, E. Muñoz, L. Piegiari, It is economically possible repowering Wind Farms. A general analysis in Spain, ICREPQ, Gran Canaria-Spain, 2011. [16] A. Filgueira, Mª A. Seijo, E. Muñoz, L. Castro, L. Piegiari, Technical and Economic Study of Two Repowered Wind Farms in Bustelo and San Xoán, 24.7 MW and 15.84 MW respectively, International Conference on Clean Electrical Power, Capri-Italy, 2009. [17] Ten-Year Network Development Plan 2014, European Network of Transmission System Operators for Electricity ENTSOE, 2014. [18] TO. Seppa, Increasing transmission capacity by real time monitoring. Proc. IEEE PES Winter Meeting, pp. 1208–1211, New York, USA, 2002. [19] CIGRE Brochure 299, “Guide for selection of weather parameters for bare overhead conductor ratings”, 2006. [20] A. Dino, A. Ketley, Dynamic transmission line rating: technology review, Tech. Rep. 208478-CR-001, Hydro Tasmania Consulting, 2009. [21] L. F. Ochoa, L. C. Cradden, G. H. Harrison, Demonstrating the capacity benefits of dynamic ratings in smarter distribution networks, IEEE/PES Conference on Innovative Smart Grid Technologies (ISGT), 2010. [22] J.K. Raniga, R.K. Rayadu, Dynamic rating of transmission lines – a New Zeland experience, IEEE Power Engineering Society Winter Meeting, 2000. IEEE. Vol. 4, 2403-2409, 23-27 January, 2000. [23] T. Ringelband, M. Lange, M. Dietrich, HJ. Haubrich, Potential of Improved Wind Integration by Dynamic Thermal Rating of Overhead Lines, IEEE Powertech, Laussane, 2009. [24] T. Yip, C. AN, G. Lloyd, M. Aten, B. Ferris, Dynamic line rating protection for wind farm connections, Integration of Wide-Scale Renewable Resources Into the Power Delivery System, 2009 CIGRE/IEEE PES Joint Symposium. p.p. 1-5. 29-31 July. Calgary – Canadian. 2009. [25] AK. Kazerooni, J. Mutale, M. Perry, S. Venkatesan, D. Morrice, Dynamic thermal rating application to facilitate wind energy integration, IEEE Power Tech Conference, Trondheim, Norway, 2011. [26] N. Etherden, MHJ. Bollen, Increasing the hosting capacity of distribution networks by curtailment of renewable energy resources, IEEE Power Tech Conference, Trondheim, Norway, 2011. [27] P. Pytlak, P. Musilek, J. Doucet, Using Dynamic Thermal Rating Systems to Reduce Power Generation Emissions, IEEE Power and Energy Society General Meeting, 2011. [28] M. Matus, D. Sáez, M. Favley, C. S. Martínez, J. Moya, G. Jiménez-Estévez, R. Palma-Behnke, G. Olguín and P. Jorquera, Identification of Critical spans for Monitoring system in Dynamic Thermal Rating, IEEE Transactions on Power Delivery, Vol. 27. No. 2, April 2012. [29] I. Albizu, E. Fernandez, A.J. Mazon, J. Bengoechea, Influence of the conductor temperature error on the overhcead line ampacity monitoring systems, IET Gener. Transm. Distrib Vol. 5, Iss. 4, pp. 440-447, 2011. [30] Guide for Application of Direct Real-Time Monitoring Systems”, CIGRÉ B2-36 Brochure (Ref. No. 498), 2012. [31] IEEE Standard 738-2006, IEEE Standard for Calculating the Current-Temperature Relationship of Bare Overhead Conductors, 2006. [32] CIGRE Technical Brochure 207, Thermal Behavior of Overhead Conductors, Working Group 22.12, 2002. [33] WJ. Steeley, BL. Norris and AK. Deb, Ambient Temperature Corrected Dynamic Transmission Line Ratings at TWO PG&E Location. IEEE Transactions on Power Delivery,Vol. 6, No. 3, July 1991. [34] DA. Douglass, AA. Edris and GA. Pritchard, Real-time Monitoring and Dynamic Thermal Rating of Power Transmission circuits, IEEE Transactions on Power Delivery, Vol. 11, No. 3, April 1996. [35] DA. Douglas, AA. Edris and GA. Pritchard, Field Application of a Dynamic Thermal Circuit Rating Method, IEEE Transactions on Power Delivery, Vol. 12, No. 2, April 1997. [36] MB. Wook, M. Choi, and AK. Deb, Line-Rating System Boosts Economical Energy Transfer, IEEE Computer Applications in Power, Vol. 10, No. 4, 34-39, Octubre 1997. [37] F. Soto, D. Alvira, L.Martin, J. Latorre, J. Lumbreras, M. Wagensberg, Increasing the Capacity of Overhead Lines in the 400 kV Spanish transmission network: real time thermal ratings, The CIGRÉ Biennial Session. Paris, August 1998.
[38] OA. Ciniglio, AK. Deb, Optimizing Transmission Path Utilization in IdahoPower, IEEE Transactions on Power Delivery,
Vol. 19, No. 2, Page(s) 830-834, April 2004.
[39] E. Di Bartolomeo, G. Bruno, S. Tricoli, G. Pirovano, S. Chiarello, D. Mezzani, Increasing Capacity of Two Italian Lines
By the Adoption of Devices for Monitoring environmental conditions and Conductors temperature or by Using High-
temperature Conductor, The CIGRÉ Biennial Session B2-102. Paris, August 2008.
[40] HJ. Dräger, D. Hussels, R. Puffer, Development and Implementation of a Monitoring-System to Increase the Capacity of
Overhead Lines. The CIGRÉ Biennial Session B2-101. Paris, August 2008.
[41] M. Muhr, S. Pack, S. Jaufer, W. Haimbl, A. Messner, Experiences with Weather Parameter Method for the use in
Overhead Line Monitoring Systems, The CIGRÉ Biennial Session B2-105. Paris, August 2008.
[42] J. Black, S. Connor and J. Colandairaj, Planning Network Reinforcements with Dynamic Line Ratings for Overhead
Transmission Lines, 45th International Universities' Power Engineering Conference (UPEC 2010). Cardiff, Wales, UK.
31stAug – 3rd Sptember. 2010.
[43] J. Black, J. Colandairaj, S. Connor and, B. O´Sullivan, Equipment and Methodology for the Planning and Implementation
of dynamic Line Ratings on Overhead Transmission Circuits, Modern electric Power systems, Wroclaw - Poland. 2010.
http://www.meps10.pwr.wroc.pl
[44] SCE, Jupe, D. Kadar, G. Murphy, MG. Bartlett and KT. Jackson, Application of a Dynamic Thermal Rating system to a
132 kV Distribution Network, 2nd IEEE PES International Conference and Exhibition on Innovative Smart Grid Technologies
(ISGT Europe). p.p. 1-8. 5-7 December 2011.
[45] R. Bernardo, A. Coelho, N. Diogo, Increasing the operation efficiency of EDP DISTRIBUIÇÃO overhead power lines,
21nd International Conference and Exhibition on Electricity Distribution (CIRED 2011), Frankfurt, 2011.
[46] R. Puffer, M. Schmale, B. Rusek, C. Neumann, M. Scheufen, Area-wide dynamic line ratings based on weather
measurements, The CIGRÉ Biennial Session, Paris, August 2012.
[47] J. Gentle, KS. Myers, T. Baldwin et al., Concurrent Wind Cooling in Power Transmission Lines, Western Energy Policy
Research Conference, Idaho, United States of America, 2012.
[48] SP Energy Networks, Implementation of Real-Time Thermal Ratings, 2013.
[49] http://www.pike.com/EnergySolutions/ThermalRate/Default.aspx accessed August 2014.
[50] DA. Douglass, A. Edris, Field studies of dynamic thermal rating methods for overhead lines, IEEE Transactions and
Distribution Conference, Vol. 2, 842-851, 11-16 April 1999.
[51] DC. Lawry, JR. Daconti, Overhead line thermal rating calculation based on conductor replica method, IEEE PES T&D
Conference and Exposition, pp. 880-85, Dallas-USA, 2003.
[52] JR. Daconti, DC. Lawry, Increasing power transfer capability of existing transmission lines, IEEE PES Transmission and
Distribution conference and Exposition, vol. 3, p.p. 1004-1009, 7-12 September, 2003.
[53] J. Ausen, BF. Fitzgerald, EA. Gust, DC. Lawry, JP. Lazar and RL. Oye, Dynamic Thermal Rating System Relieves
Transmission Constraint, ESMO 2006. IEEE 11th International Conference Transactions & Distribution Construction,
Operation and Live-Line Maintenance. 15-19 Oct. 2006.
[54] www.usi-power.com accessed August 2014.
[55] JS. Engelhardt, SP. Basu, Design, installation, and field experience with an overhead transmission dynamic line rating
system, IEEE PES Transmission and Distribution Conference, p.p. 366 - 370, Los Angeles, California. September 15-20, 1996.
[56] SD. Foss, SH. Lin, HR. Stillwell, RA. Fernandes, Dynamic thermal line ratings. Part II. Conductor temperature sensor and
laboratory field test evaluation, IEEE Trans. Power Appl. Syst., 102, (6), pp. 1865–1876, 1983.
[57] CAM. Nascimento and JMC. Brito, EB. Giudice Filho, GE. Braga, GC. Miranda, AQ. Bracarense and S. Ueda, The State
of the Art for Increased Overhead Line Ampacity Utilizing New Technologies and Statistical Criteria, 2004IEEE/PES
Transactions & Distribution Conference & exposition: Latin America, pages 464-469, 8-11 Nov. 2004
[58] A. Michiorri, R. Currie, P. Taylor, F. Watson, D. Macleman, Dynamic Line Ratings Deployment On The Orkney Smart
Grid, CIRED 21st International Conference On The Orkney Smart Grid, Paper 1245, Franfurt 6-9 June, 2011
[59] T Yip, C An, G Lloyd, M Aten, B Ferris, G. Hagan, Field Experiences With Dynamic Line Rating Protection,
Developments in Power System Protection 2010.
[60] http://www.arteche.com/es/productos-y-soluciones/categoria/sensor-de-medida-de-temperatura-lineas-at-           accessed
August 2014.
[61] P. Pytlak, P. Musilek, E. Lozowski, J. Toth, Modelling Precipitation Cooling of Overhead Conductors, Electric Power
Systems Research 81 (2011) 2147– 2154. 2011. www.elsevier.com/locate/epsr.
[62] A. Madrazo, A. Gonzalez, R. Martínez, M. Mañana, E. Hervás, A. Arroyo, PB. Castro and D. Silió, Increasing Grid
Integration of Wind Energy by using Ampacity Techniques, International Conference on Renewable Energies and Power
Quality (ICERPQ ‘13), No. 11, March 2013.
[63] E. Fernandez, I. Albizu, MT. Bedialauneta, S. de Arriba, AJ. Mazon, System For Ampacity Monitoring And Low Sag
Overhead Conductor Evaluation, 16th IEEE Mediterranean Electrotechnical Conference (MELECON), p.p. 237-240, Yasmine
Hammamet, 2012
[64] http://www.gedigitalenergy.com/multilin/catalog/fmc.htm accessed August 2014.
[65] L. McClean, L. Bryans, J. Colandairaj, B. Fox, B. O’Sullivan, Equipment And Methodology For Linking Overhead Line
Circuit Ratings To The Output Of Nearby Windfarms, Universities Power Engineering Conference, 2008.
[66] www.otlm.eu, accessed august 2014.
[67] M. Gabrovšek, and V. Lovrencic, Temperature monitoring of overhead lines (OHL) is Smart Grid solution for power grid,
Conferinta Retele Energetic Inteligente, Smart Grid, SIBIU, 21 – 23 September, 2010.
[68] M. Gabrovšek, M. Kovac, V. Lovrencic, J. Kosmac, G. L. Jericek A. Souvent, Dynamic Thermal Line Rating in Slovenia,
International Conference on Condition Monitoring, Diagnosis and Maintenance - CMDM 2011 (177). P.p. 1- 5. 2011.
[69] SA. Gal, MN. Oltean, L. Brabete, I. Rodean, M. Opincaru, On-line monitoring of OHL Conductor Temperature; Live-
Line Installation, IEEE PES 12th International Conference on Transmission and Distribution Construction, Operation and
Live-Line Maintenance (ESMO), p.p. 1 – 6, 16-19 May, Bucharest, Romania, 2011.
[70] www.lindsey-usa.com , accessed august 2014.
[71] www.ohtlgrid.com, accessed august 2014.
[72] S. Kupke, Pilot project-High temperature low sag conductors, CIGRE WG B2.42, Stockholm-Sweden, 2010.
[73] C. Bernauer, H. Böhme, S. Grossmann, et al., Temperature measurement on overhead transmission lines (OHTL) utilizing
surface acoustic wave (SAW) sensors, Proc. Int. Conf. on Electricity Distribution CIRED, Vienna, Austria, 2007.
[74] www.ribe.de, accessed august 2014.
[75] M. Weibel K. Imhof, W. Sattinger, U. Steinegger, M. Zima, G. Biedenbach, Overhead Line Temperature Monitoring
Pilot Project, The CIGRÉ Biennial Session B2-311. Paris, August 2006.
[76] R. Terminova, V. Hinrichsen, J. Freese, C. Neumann, R. Bebensee, M. Hudasch, M. Weibel and T. Hartkopf, New
approach to Overhead Line conductor Temperature Measurement by Passive Remote surface acoustic Wave Sensor, The
CIGRÉ Biennial Session B2-304. Paris, August 2006.
[77] C. Bernauer, H. Böhme, V. Hinrichsen, et al., New method of temperature measurement of overhead transmission lines
(OHTLs) utilizing surface acoustic wave (SAW) sensors, XV International Symposium on High Voltage Engineering,
Ljubljana, Slovenia, 2007.
[78] HLM. Boot, FH. de Wild, AH. van der Wey, G. Biedenbach, Overhead line local and distributed conductor temperature
measurement techniques, models and experience at TZH, CIGRÉ Session, 22-205, Paris-France, 2002.
[79] S. Nandi, J.P. Crane, P. Springer, Intelligent conductor system takes its own temperature, Transmission & Distribution
World, November, pp. 58-62, 2003.
[80] S. Jones, G. Bucea, A. McAlpine, M. Nakanishi, S. Mashio, H. Komeda, A. Jinno, Condition monitoring system for
transGrid 330kV power cable, International Conference on Power System Technology – POWERCON, Singapore, 21 – 24
November, 2004.
[81] http://www.twenties-project.eu/node/1 , accessed august 2014.
[82] FVB.de Nazáre, MM. Werneck, Development of a Monitoring System to Improve Ampacity in 138kV Transmission
Lines Using Photonic Technology, IEEE PES Transmission and Distribution Conference and Exposition, New Orleans, 2010.
[83] FVB.de Nazáre, MM. Werneck, Temperature and Current Monitoring System for Transmission Lines Using Power-over-
Fiber Technology, IEEE Instrumentation and Measurement Technology Conference (I2MTC), Austin, 2010
[84] FVB.de Nazáre, MM. Werneck, Hybrid Optoelectronic Sensor for Current and Temperature Monitoring in Overhead
Transmission Lines, IEEE Sensors Journal, Vol. 12, No. 5, May 2012.
[85] J. Luo, Y. Hao, Q. Ye, Y.Hao, and L. Li, Development of Optical Fiber Sensors Based on Brillouin Scattering and FBG
for On-Line Monitoring in Overhead Transmission Lines, Journal Of Lightwave Technology, Vol. 31, No. 10, May 2013.
[86] S. Berjozkina, A. Sauhats, A. Banga, I. Jacusevics, Testing Thermal Rating Methods for the Overhead High Voltage Line,
Int. Conf. on Environment and Electrical Engineering, pp. 215-220, Wroclaw-Poland, 2013.
[87] Y. Yang, D. Divan, RG. Harley TG. Habetler, Power line sensornet - a new concept for power grid monitoring, IEEE
Power Engineering Society General Meeting, 2006.
[88] A. Moghe, F. Lambert, D. Divan, Smart “Stick-on” Sensors for the Smart Grid, IEEE Transactions On Smart Grid, Vol. 3,
No. 1, March 2012.
[89] M. Ghafourian, GE. Bridges, AZ. Nezhad, DJ. Thomson, Wireless overhead line temperature sensor based on RF cavity
resonance, Smart Materials and Structures, Vol. 22. No. 7, 2013.
[90] SD. Foss, H. Lin Sheng, RA. Maraio and H. Schrayshue, “Efect of Variability in Weather Conditions on conductor
Temperature and the Dynamic Rating of Transmission Lines, IEEE Transactions on Power Delivery, Vol. 3, No. 4, October
1988.
You can also read