Review of the Grand Bargain Multipurpose Cash (MPC) Outcome Indicators
←
→
Page content transcription
If your browser does not render page correctly, please read the page content below
May
                                                                                                     2021

        Review of the Grand
        Bargain Multipurpose
        Cash (MPC) Outcome
        Indicators

        Summary Report of
        Feedback from the Testing
        Phase

        OLIVIA COLLINS
        INDEPENDENT CONSULTANT

Report commissioned by the CaLP Network on behalf of the Grand Bargain sub-workstream on MPC Outcome Indicators
Table of Contents
1. Introduction and aim. ............................................................................................................................................. 2
2. Methodology for collecting and analyzing feedback. ...................................................................... 2
3. Findings...................................................................................................................................................... 3
3.1 Use of the MPC Outcome Indicators. ...................................................................................................... 3
3.2 Feedback on the overall approach........................................................................................................... 5
3.2.1 Clarify the scope and ambitions of the indicators. .......................................................................... 5
3.2.2 Re-thinking the cross-sectoral/sectoral categorization of indicators.............................................. 5
3.2.3 Proposed additional indicators ........................................................................................................ 7
3.2.4 Tools and guidance needed in order to make the indicators more ‘user-friendly’ ........................ 8
3.2.5 Changes due to COVID-19 ............................................................................................................. 8
3.3 Feedback on specific indicators ............................................................................................................. 10
3.3.1 Cross-cutting indicators ................................................................................................................ 10
3.3.2 Sectoral indicators ......................................................................................................................... 15
3.3.3 Expenditure indicators .................................................................................................................. 22
3.4 Increasing uptake of the MPC Outcome Indicators ................................................................................ 24
4. Conclusion .............................................................................................................................................. 25
Annex 1: list of key informant interviews................................................................................................ 27
Annex 2: Guiding questions for key informant interviews .................................................................. 30
11. Introduction and aim.
Multipurpose cash (MPC) is a type of assistance that enables people affected by crises to purchase the
goods or services of their choice, on local markets. When used in humanitarian response, MPC can
contribute to a wide range of different outcomes, depending on each household’s needs and priorities.
While this flexibility has many advantages for recipients of assistance, the use of MPC brings with it certain
challenges for humanitarian actors and donors in monitoring and reporting the effects of this type of
assistance.
As part of the Grand Bargain commitments to “increase the use and coordination of cash-based
programming”, to “harmonize and simplify reporting requirements” and to “include people receiving aid in
the decisions which affect their lives”, the need for better and more consistent measurement of the
outcomes to which MPC contributes was identified.
Starting in 2018, the MPC Outcome Indicators have been developed by a group of humanitarian
stakeholders, including NGO and UN practitioners, cluster leads or cash/markets focal points, CaLP, and
donors. This ‘MPC Indicator Reference Group’ has been co-led by representatives from Catholic Relief
Services (CRS), USAID’s Bureau for Humanitarian Assistance (BHA) and CaLP. Following a period of
extensive consultation and discussion, in July 2019 the Multipurpose Cash Outcome Indicators – Final Draft for
Testing was completed and published. Since 2019, these draft MPC indicators have been ‘field tested’ by
various humanitarian stakeholders.
The aim of this review is to gather experience from the testing phase and analyze this feedback in order
to revise the MPC Outcome Indicators and produce an updated version of the document.
2. Methodology for collecting and analyzing feedback.
This review is based on feedback from two main sources:
1. Online survey conducted in November 2020 (33 respondents)
2. Key informant interviews (KII) conducted between February and April 2021 (58 people
interviewed, see Annex 1 for list). KIIs were conducted by Olivia Collins, Independent Consultant
and Ruth McCormack, Technical Advisor, CaLP.
In both the online survey and the KIIs, respondents were asked to provide detailed feedback on the MPC
outcome indicators, focusing on the following questions (see Annex 2 for full list of questions):
1. How has your organization used the indicators?
2. Any challenges? Recommendations for how to improve the indicators and guidance?
3. Feedback on specific indicators: which worked, which should be modified or cut? Any additional
indicators to include?
4. Approaches to collecting expenditure data.
5. Any changes to the indicators or data collection methods due to COVID-19?
6. If not using the indicators, why not?
7. Any ideas for increasing the uptake of the indicators, once finalized?
This review sought to collect feedback from a variety of different stakeholders, as shown in the table below.
2Type of organization /
Roles
institution
• Involved in data collection in the field (either using MPC
outcome indicators or using other tools).
SURVEY / KII
• Local NGOs
• Involved in designing questionnaires and data analysis, for
• International NGOs
example M&E staff, Cash and Markets specialists, etc.
• UN agencies
• Sector-specific specialists within Global Clusters, for example
• Donors
leads of Cash and Markets Task Teams for each sector.
• Involved in comparing data sets from different contexts, for
example staff from HQ and/or donors.
Limitations: the scope of this review did not extend to gathering feedback from people who have received
MPC assistance, though some interviewees suggested that they should also be consulted. Through
interviews with staff from humanitarian organizations who have been involved in administering such surveys,
the views of MPC recipients were sought, for example by asking how various questions were perceived
during household surveys. This provided some, albeit limited, second-hand information from the perspective
of people receiving assistance - for example whether it was thought to be appropriate, ethical or necessary
to ask certain questions, and whether the data collected was likely to be accurate and reliable.
Data analysis: the data collected through the survey and KIIs was entered into an Excel spreadsheet,
organized according to the questions and indicators. The data was read and analyzed by both people
conducting the interviews and preliminary findings were shared and discussed with the co-leads of the MPC
Outcome Indicators Reference Group, during two separate meetings. The draft report and findings were
shared with the whole Reference Group in May 2021 as part of the process to incorporate these findings
into the revision of the indicators.
Revising the indicators: for many of the indicators, revisions were suggested during KII and have been
included here as part of the feedback received. It should be noted that these suggested revisions have not
been validated by the MPC Outcome Indicator Reference Group. For most of the sectoral indicators, the
revisions have been put forward by one or more representative(s) from the global ‘task teams’ on cash and
vouchers (or cash and markets) but further discussion is necessary before the final version of the indicators
is decided upon.
3. Findings.
In general, people consulted were keen to share their experience of using the MPC Outcome Indicators and
to be involved in revising a tool they perceived as being useful to their work. A wide range of feedback was
collected, and this is summarized in the sections below: how the indicators were used by organizations (3.1);
feedback on the overall approach (3.2); detailed feedback on each indicator (3.3); and ideas for how to
increase uptake of the indicators, once finalized (3.4).
3.1 Use of the MPC Outcome Indicators.
Some organizations made a conscious effort to ‘use’ the MPC Outcome Indicators and have integrated them
into their monitoring and reporting tools. Other organizations were already using some of the indicators
and observed that their existing systems ‘matched’, to some extent, the draft MPC indicators. Most
organizations emphasized that they have used the parts of the indicator document that they
found relevant and “didn’t sign up to the whole thing”. The following uses of the MPC outcome
indicators were highlighted:
3• Needs assessments and targeting: some of the indicators were used to assess needs / vulnerabilities
and to inform targeting (identifying who was eligible to receive MPC assistance), though this was not
very common. For example, the Gaza Protection Consortium stated that the indicators related to
shelter and WASH were used as eligibility criteria for the targeting of MPC (measured at baseline and
end-line, but not during post-distribution monitoring (PDMs)). In Turkey, the Emergency Social Safety
Net (ESSN) used some of the indicators as part of vulnerability analysis, to inform targeting criteria, and
then referred to the indicators when assessing inclusion and exclusion errors in targeting.
• Monitoring: PDM monitoring of MPC was the principal way in which the outcome indicators were
used, by integrating them into household surveys at baseline, mid-line and end-line. Organizations
highlighted that the MPC indicators provided a useful ‘check-list’ as to what should be included in
monitoring tools.
• Reporting: some respondents stated that the indicators had been integrated into reporting systems
(both internal and to donors) as well used in proposals and guidance. However, it was highlighted that
reporting systems were often already well established within organizations and could not be easily
changed to include the MPC outcome indicators. Some explained that the standard indicators were
already integral to their organizations’ reporting systems and added that once the indicator list is
finalized, they may consider including further indicators.
• Comparing data sets between different contexts: this was referred to by donors as well as NGO
and UN staff at HQ level. However, it was highlighted that although this would be interesting in theory,
it was only feasible with the data from standardized indicators, or through using simple metrics such as
‘number of MPC transfers’ or ‘value of assistance transferred through MPC’.
The cross-cutting, expenditure and food security indicators have been widely used and tested,
enabling a broad range of feedback to be gathered on these indicators.
• Not surprisingly, those indicators which existed prior to the draft MPC Outcome Indicators, were often
already integrated into monitoring and reporting systems, and therefore most often used, particularly
the process indicator for Quality, Protection Mainstreaming and Accountability to Affected Populations
(AAP), Food Consumption Score (FCS) and reduced Coping Strategy Index (rCSI).
• The ‘Meeting Basic Needs’ indicator, Livelihoods Coping Strategies (LCS), Gender Equity/Women’s
Empowerment indicator and Qualitative Questions were only sometimes used and so there is less
feedback on these indicators.
• In terms of expenditure, many organizations surveyed used some form of expenditure
indicator when monitoring the MPC - though opinions on the utility of this varied greatly - and
there is extensive feedback on expenditure indicators (see section 3.3.3).
The sectoral indicators for Shelter, WASH, Education and Health have been much less widely
tested. Some organizations tested them and made modifications, others did not attempt testing these
indicators as they felt they were not adapted to the context in which they were working, or that data
collection would be inordinately complex or simply not feasible. Notable changes have been suggested for
these indicators.
For Nutrition and Child Protection, no indicators had been specified in the draft document. For
Protection, the draft document notes that “many of the questions in the Protection Mainstreaming
indicator and the Livelihoods Coping Strategies indicator, both under the Cross-Cutting section, are related
to protection outcomes” and no additional protection-related outcomes are included. For Nutrition, Child
Protection and Protection there was no ‘testing’ of draft indicators, but suggestions have been made as to
what they would like to be included in the final document.
43.2 Feedback on the overall approach.
3.2.1 Clarify the scope and ambitions of the indicators.
Universal or contextualized indictors? In the draft document, it is stated that the purpose is to
“streamline reporting and provide more consistent and comparable field-level monitoring.” Respondents
agreed that streamlining reporting was a good idea but questioned whether the indicators were intended to
produce comparable datasets, or to be adapted to each context. When discussed further, many
respondents suggested it was useful to have a range of different types of indicators: both
standard or ‘universal’ indicators that could provide comparable datasets, and others that
could be adapted and contextualized (such as the ‘basic needs’ indicator or qualitative questions). The
following feedback was received:
▪ “Should be clear from the beginning that datasets cannot simply be compared between different contexts. Can't
compare apples and pears. There can be a risk in trying to compare, as in some contexts we don't have the
resources to achieve good results. Not necessarily a flaw in design and doesn't mean that cash doesn't work.”
▪ “Very big temptation and big trap to want to formulate a universal indicator - good to have some universal and
other non-universal indicators.”
▪ “Should leave this (basic needs indicator) open to interpretation... What we consider to be 'basic needs' changes
depending on the context.”
▪ “There is a lot of variation in how partners collect this data. This ‘basic needs indicator’ needs to be
contextualized. Less useful for donors in terms of aggregate level but could be useful at an individual (project
management) level.”
Which outcomes can realistically be expected when MPC transfer values are low? Multiple
respondents questioned whether the indicators, particularly the sectoral outcomes, were ‘realistic’, given
that MPC transfer values are rarely set at 100% of the minimum expenditure basket (MEB), and that MPC
assistance is often provided on a short-term basis in emergency contexts. As low transfer values affect
the achievement of outcomes for MPC, it was suggested that further guidance should be given
to users as to when it is appropriate to use certain indicators and what changes, or outcomes
can be expected. A note on transfer values could be included under ‘usage guidance’ (pg. 2), where there
is already a note on ‘Transfer duration’.
Useful as a monitoring checklist. Many respondents highlighted that the indicators provided a useful
tool when developing survey questionnaires in the field, akin to a checklist to help teams identify the main
areas they should be monitoring when MPC is used to meet basic needs.
Recommended to standardize the unit of measurement. Some indicators refer to household and
some refer to beneficiaries/target group. One donor recommended having a standardized unit of household.
3.2.2 Re-thinking the cross-sectoral/sectoral categorization of
indicators.
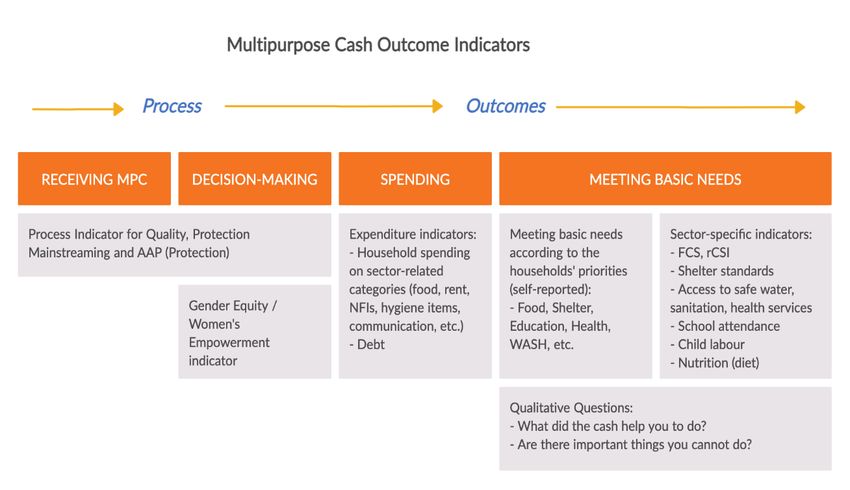
The guidance presents three categories of indicators:
(1) Cross-cutting indicators, some of which are required, some of which are optional.
(2) Sectoral indicators, stating that “at least one indicator from each of three sectors is required; the
sectors should be selected based upon the identified needs and people’s priorities. Using
MEB/transfer value categories or amounts may be helpful”.
(3) Expenditure indicators, which are optional.
5While this way of categorizing the indicators was familiar and easily understood, through discussions it
was highlighted that the distinction is considered somewhat arbitrary by some. Below is some of
the feedback received:
▪ “MPC is basic needs, so it is cross-sectoral. MPC stakeholders need to help the sector-specific colleagues. We
need to focus on expenditure indicators. Perhaps the sectoral indicators are not necessary? I was very
surprised to see the sectoral indicators in there – they are not yet tested, not yet researched.”
▪ “There is potential to have a lot of sector-related answers here (in response to the qualitative
questions), as it overlaps with the spirit of the sectoral indicators.”
▪ “Is there a correlation between this (the basic needs indicator) and achieving sectoral outcomes?”
▪ “In theory this (basic needs indicator) should be broken down by sector.”
▪ “Response options (food, water, hygiene items, health, rent, shelter repair, etc.) used here (for
the basic needs indicator) should be the same as those used for the expenditure questions.”
▪ “Really important to keep expenditure indicators, for me this is the key. For many partners not used to
using expenditure data, it is really hard for them to understand the link between expenditure data and other
sectors. For food security it is easier to explain, for other sectors, not so easy. It is useful to think about % of HH
expenditure on soap, but for the WASH sector, it is difficult for them to understand the importance of this. We
need to get sectors more involved.”
▪ “We know that expenditure on water is being sacrificed when households have to prioritize. Rent and electricity
are 'standard' costs, that can't be reduced for families, but food and water can be reduced. So we see that
people are spending less money on water – and we need to ask the sectors - why? We're not doing a sector
analysis, but we are analyzing expenditure, from a basics need perspective.”
▪ “The overall framework is more complicated than it needs to be. Cross cutting indicators should be given more
emphasis and priority in the process. The primary voice should be affected populations and their prioritization of
needs – at the start of the process and throughout. As opposed to indicators being selected and prioritized
primarily based on mandates (including related to sectors). Voice and power of the recipient needs to be in the
process – have a more visible people-centred approach in the guidance and process”.
In light of discussions in KII and the feedback received, the following diagram presents a way of re-
thinking the categorization of different types of indicators (source: developed by consultant).
Mixing sector outcomes and affordability is complex to measure. Several respondents highlighted
that the draft indicators for WASH, Health and Education measure outcomes (such as ‘using an unsafe water
6source’, ‘open defecation’, ‘missing school’ or ‘delaying or not seeking healthcare’) as well as financial
barriers (because ‘they cannot afford to use a safe water source’ or ‘pay to use a public latrine’, ‘because of
costs associated with schooling’, or ‘due to financial barriers’). Measuring both sector-specific outcomes and
affordability was considered highly complex, not just in terms of survey questions but also in terms of data
analysis and reporting. In practice this requires a PDM questionnaire that measures not only the
sectoral outcome but also explores the causal pathways and identifies whether financial
barriers - or other barriers - are the reason behind the household not achieving a certain
outcome. As stated by one respondent:
“Financial barriers are very important at assessment level. But this (WASH indicator) systematically mixes two types
of indicators: the situation being observed AND that situation being a financial barrier. Makes it difficult to reliably
measure these things. Just measuring the percentage of households with access to safer water should be enough to
work out whether the MPC has an effect.”
Understanding the barriers to accessing goods and services was considered extremely important.
However, rather than mixing affordability and outcomes in a single indicator for monitoring MPC, it was
suggested that standard outcome indicators be used and that financial barriers be explored
through other mechanisms, such as needs assessments, response analysis, developing minimum
expenditure baskets (MEBs) and focus group discussions (pre- or post-distribution).
Some sectors suggested that other forms of data collection, with the involvement of some
technical staff, may be necessary. Outcomes (such as school attendance) may be difficult to collect
within the scope of a PDM household survey and other forms of data collection may be required (such as
collecting attendance data from schools). Some data collection may require technical sector-specific staff
(for example measuring water quality), while other data can be collected by non-technical staff. For
example, shelter specialists said that the number of rooms, or partitions, can indicate the quality of shelter
and is information which is easy to collect by non-specialists.
These concerns are reflected in some of the revisions suggested by sector colleagues and those who have
tested the sector-specific indicators (see section 3.3.2 below).
3.2.3 Proposed additional indicators.
Most respondents thought that the list of indicators should be reduced rather than added to, focusing on a
‘core minimum group of indicators’. However, some of those interviewed suggested indicators that could
make potentially useful additions:
• Psychosocial well-being: The Human Insecurity Scale (HIS) was used by the Cash Consortium for Iraq
to measure the psychosocial wellbeing of households receiving MPC and they proposed that this could
be a useful (optional) addition to the indicator list. The scale used is grounded in a body of academic
research which suggests that reductions in insecurity amongst vulnerable households living in poverty
are linked to improved long-term economic outcomes.1 Documents (not yet published) shared by the
Cash Consortium for Iraq give an overview of how psychosocial wellbeing is being evaluated for their
programme, as detailed in the table below:
Psychosocial Wellbeing
Fear for Own Life Extent to which the respondent fears for their own life
Fear for Family Extent to which the respondent fears for their family
Providing for Family Extent to which the respondent fears they will not be able to provide their family with daily life necessities
Loss of Income Extent to which the respondent worries about losing their source of income or the source of income for
their family
Fear of Losing Home Extent to which the respondent fears losing their home
1
Maisa Ziadni et al., “Sources of Human Insecurity in Post-War Situations: The Case of Gaza,” Journal of Human Security 7, no. 3;
Hamayel Layaly, Assessment of the Psychosocial Health Status of Adolescents 12-18 Years Old in the Occupied Palestinian Territory
(Birzeit University, Institute of Community and Public Health, 2014)
7Fear of Displacement Extent to which the respondent fears they will be displaced or uprooted
Fear of the Future Extent to which the respondent fears for their future or their family’s future
Fear for Personal Safety Extent to which the respondent fears for their personal safety
Fear for Family's Safety Extent to which the respondent fears for the safety of their family
Family's Safety Concerns Extent to which the respondent’s family fears for their safety
• Livelihoods: some respondents noted that the potential contribution of MPC to longer-term
livelihoods would be interesting to measure. The qualitative questions and expenditure data could be
used to identify the percentage of households that saved money, invested in productive assets or other
investments that contribute to longer-term livelihoods.
• Process / performance indicators: though it is understood that the document focuses on ‘outcome
indicators’, one required process indicator is already included (protection mainstreaming). Some
respondents stated that other process / performance indicators should be included – e.g., ‘MPC amount
received’, ‘preference for cash or vouchers’ - to make the document a more complete checklist for
monitoring MPC.
3.2.4 Tools and guidance needed to make the indicators more ‘user-
friendly’.
Tools and guidance: feedback highlighted the need for tools to support organizations in using the
indicators. For example: sample survey questionnaires, ODK / KoBo forms, support in calculating
composite indicators, etc. Feedback included:
▪ “Document provides mandatory and optional indicators, but lacks guidance. So once the indicators are selected it
is difficult to know what to do with them.”
▪ “Interpreting is challenging. Have to search out the guidance to understand how to interpret the indicators. Need
to build forms… some of this could be done by CaLP to help organizations 'interpret' and then operationalize the
indicators?”
Survey design and the question of attribution: survey design was highlighted as a missing element in
the guidance. Could there be a link to other documents which provide guidance on different methods for
data collection and survey design, including suggestions on approaches to the complex question of measuring
attribution?
▪ “The question of attribution shouldn't be included in the indicators, it comes down to survey design in a way that
is statistically significant.”
▪ “The indicators are meant to measure impact, but cannot be used for attribution - so what's the point?”
▪ “You can measure standard sectoral indicators, but you have to understand that you can't attribute the change to
cash.”
3.2.5 Changes due to COVID-19.
Respondents stated that COVID does not affect the relevance of the indicators but does affect
data collection methods. Surveys need to be shorter and straight to the point. Many surveys have been
conducted on the phone, via text message, or, on occasion, face-to-face but with social distancing.
It was highlighted that expenditure data is difficult to collect remotely as expenditure modules tend
to be detailed and a level of trust can be built through face-to-face contact. Below is some feedback from
KII about how the monitoring of MPC was adapted to the COVID context:
▪ “Before, we collected data with house-to-house visits, but because of COVID, we are collecting data via mobile
phone. So, we need to have a shorter questionnaire. We are using KoBoCollect tools, so we can conduct some
surveys face-to-face, but with social distancing.”
8▪ “We started to ask questions about how they have been affected by the pandemic. Previously, would do a mixed
approach, some in the field and some telephone interviews. But have to limit face-to-face, so now we do 100%
on the phone, and the questionnaire is long.”
▪ “Have to make questions simpler. Can't repeat questions too much, respondent has to understand why we are
asking the questions. And we still had to ask the same questions, but tried to phone people at a better time of
day, so they have time.”
▪ “We cut down on qualitative indicators because of COVID.”
▪ “There are challenges collecting data face to face, and expenditure modules tend to be very detailed.”
▪ “Surveys need to be shortened in the current COVID context. We tried to do remote surveys. But, for example,
for expenditure it is much easier to have a discussion about this face to face. Due to COVID, surveys are short,
via phone, via text message.”
93.3 Feedback on specific indicators.
3.3.1 Cross-cutting indicators.
1 Required Outcome Indicator
INDICATOR FEEDBACK
Percentage of households Generally positive feedback but difficulties in using the indicator:
who report being able to ▪ “This one was really appreciated by teams and has been fully integrated”
meet the basic needs of ▪ “We like this indicator and think it is important, but had some difficulty trying to
their households figure out how to ask the question and define basic needs”
(all/most/some/none), ▪ “There is a lot of confusion about what it means to 'meet' basic needs, when
according to their priorities transfer values are pegged at 65%-80% of MEB (depending on donor). Feels like
a 'tick box' approach. But what does it actually mean?.”
▪ “Big defender of perception based indicators, but this mixes a lot of different
perceptions… what do they perceive as their priorities? What do they perceive as
meeting their needs? Methodologically, there are multiple layers of perceptions
here.”
Contextualise indicator rather than aiming for comparable datasets:
▪ “Should leave this open to interpretation... Needs to be contextualised, what we
consider to be 'basic needs' changes depending on the context.”
▪ “There is a lot of variation in how partners collect this data. Less useful for donors
in terms of aggregate level, but could be useful at an individual (project
management) level.”
▪ “Interpretation of results is important. Is it a good thing or a bad thing if more is
being spent on basic needs?”
DRAFT
Using a five-point rather than four-point likert scale is recommended:
▪ “Basic needs indicator – currently is based on a 4-point likert scale, but evidence
on the use of likert scales indicates that 5 points are more effective. This includes
making it easier for enumerators to understand and communicate, and in analysis
(Ground Truth has done some research into this).”
Bias to respond NO:
▪ “Such a strong incentive for households to state that their needs are not being
met, in order to continue getting assistance.”
▪ “Probably 'no' is overreported.”
▪ “Feels like what it's actually measuring is general 'satisfaction' with the assistance
and I think it needs to be pegged to something more specific.”
Improve cross-analysis and link to sectoral outcomes and
expenditure:
▪ “Is there a correlation between this and achieving sectoral outcomes?”
▪ “What does this mean? Some resistance to using this. In theory this should be
broken down by sector.”
▪ “Very tricky - in food security we use 'report being able to meet basic food needs'
but need a more systematic approach and more guidance. Try to calculate Kcal
to work out whether food needs are actually being met. Don't actually use this for
other sectors. Considered too subjective.”
▪ “Response options (food, water, hygiene items, health, rent, shelter repair, etc.)
used here should be the same as those used for the expenditure questions.”
10SUGGESTED REVISIONS
More specific details and guidance need to be developed in order to make this indicator operational. Modified
versions of this indicator were shared by Gaza Protection Consortium, UNHCR, WVI, IRC and Somali Cash
Consortium. Depending on the approach used, also consider basing this on a five-point likert scale (currently
the version in the guidance is a four-point scale).
It should be noted that these suggested revisions arose during KII and the intention is that they should inform
the revision of this indicator. The suggestions below have not been validated by the MPC Outcome Indicator
Reference Group.
Gaza Protection Consortium ‘Meeting Needs Index’: “We have developed this further, and it has become
an official indicator for ECHO globally. The indicator is still perception-based, but has categories and a weighted scoring
system. There are a number of basic needs in the index: income, food, water, healthcare, hygiene, clothing, energy and
fuel, shelter, education, transportation, household items, and communication (with the exception of income, these are all
components of the Gaza MEB). Each is weighted and then a composite score out of 1 is given. If the score is above
50%, it is considered that needs are being met.” (For further details, see: MPCA Post Distribution Monitoring, Round II
Report, Gaza Protection Consortium, March 2021 and Gaza Multipurpose Cash Transfer Programme in Palestine, Mercy
Corps Palestine, August 2020)
REVISIONS
UNHCR, WVI and IRC: Follow-up question to assess gaps in meeting basic needs
To better understand the extent to which basic needs are met, a number of organizations stated that they
added a second question to identify which of the basic needs cannot be afforded by the household. For example
(from UNHCR PDM household survey):
1. Overall, to what extent are you currently able to meet the basic needs of your household? (All / More
than half (but not all) / Half / Less than half / Not at all / Don’t know) NOTE: the term ‘most pressing
needs’ could be used as an alternative for ‘basic needs’ if this is easier to understand.
2. If more than half (but not all), half, a little or not at all: Which of your household’s basic needs
can you not afford? (Select up to three: Food, Water, Hygiene items, Health costs (including
medicines), Rent, Shelter repair (e.g. rehabilitation, extension, materials), Household items (e.g.
mattress, blankets, jerrycan), Firewood / Fuel for cooking or heating, Clothes / shoes, Utilities and bills
(e.g. electricity, water bills, phone calling credit), Towards a livelihood activity (e.g. seeds, tools,
farming, fishing, petty trade etc.), Education (e.g. school fees, uniform, books). Entertainment (including
alcohol, cigarettes), Transport, Debt repayment, Support other family members / relatives / friends,
Legal assistance / documents, Other (Specify)___________
Somali Cash Consortium, Qualitative perception-based indicators: “We conducted research and have
developed some qualitative perception-based indicators ('which statement do you agree with'?). This is a better way to
measure meeting basic needs as we see shifts in the middle. Puts more focus on the beneficiaries' self-perception of
resilience. Some are theoretical questions 'IF X happened...' Also ask about ability to withstand shocks, at community
level.” (Somali Cash Consortium and CWG)
112 Process Indicator for Quality, Protection Mainstreaming and Accountability to
Affected Populations (AAP)
INDICATOR FEEDBACK
Percentage of beneficiaries Widely used but considered complex
reporting that humanitarian ▪ “Mandatory for all assistance programmes with an asset transfer (in-
assistance is delivered in a safe, kind/cash).”
accessible, accountable and ▪ “Took some investment at the beginning around key questions and scoring.
participatory manner Once investment was made, went quite smoothly. ‘Note’ in the MPC document
seems to contradict what is written in the ECHO guidance!”
▪ “Like this indicator, in theory. Tried to use it but not necessarily in the same
way in each country.”
▪ “Teams find it difficult to properly report against this composite indicator.”
Questions around the logic of having a composite indicator
▪ “The structure of this is not very clear, team felt more comfortable resorting to
the Safer Cash Toolkit”
▪ “PDMs assessing each component individually and calculating an average of
all of those, which is not ideal to get to a meaningful measurement that
informs program adjustment.”
▪ “Find this indicator extremely difficult to calculate… think that some of the
components are not the best way to measure what we're trying to measure -
for example use of CRM is not a good indicator of 'good programming'. The
weighting seems artificial - lack of security at distribution site is extremely
serious, however 'were you involved in the community sensitisation' is less
DRAFT
important”
Modifications tested
▪ “We broke this indicator down into % of HHs reported feeling at risk, HHs
who report facing one or more problems keeping or spending the cash, and
communication with communities - % of HHs that know how to use
complaints and feedback.
Is ‘participation’ an accurate description for what’s included in the
indicators, and might this be more realistically framed as inclusive?
▪ “Arguably the questions on ‘participation’ are actually more about
accountability. There’s a larger point(s) here about exactly what participation
is in practice (e.g., what does it mean to have ‘achieved participation’ in a
programme), the extent to which varying levels of participation are actually
desirable from a recipient/community perspective, how this should be
monitored, and whether it’s something that can/should feasibly be set as a
target for all MPC at this stage. To that extent there’s a recommendation to
frame this element as a target of achieving ‘inclusivity’, which may be more
realistic in a context where most programmes have a way to go to effective
accountability”.
News that revised guidance has been released by ECHO was well
received.
SUGGESTED CHANGES
REVISIO
Link to new ECHO guidance, see Protection Mainstreaming Indicator Toolkit.
NS
Link to the Safer Cash Toolkit
3 Additional Outcome Indicator (optional)
12INDICATOR FEEDBACK
Percentage of households by Rarely used. Generally perceived as being complex for field
Livelihoods Coping Strategies teams.
(LCS) phase (Neutral, Stress, ▪ “Potentially interesting but a bit heavy for field teams to use.”
Crisis, Emergency) ▪ “Required by donors so used it. But a bit critical of it, I like the
straightforward sectoral way of approaching multisectoral outcomes.”
▪ “Unfortunately, we don't use it systematically. And not always easy in an
DRAFT
acute crisis, rather used in protracted situations (like Cameroon).”
▪ “Our teams don't like it. Has so much overlap with rCSI… To date we've
always taken it out (of surveys) at the last minute, wanting to save
recipients’ time. But I’m not opposed to keeping it in as an optional
indicator.”
▪ NB. ECHO is including LCSI as required indicator for MPC as per
their Jan 2021 internal guidance, with the role of protection
highlighted. The potential for CWGs to play a role in defining
context specific CSIs was noted.
SUGGESTED CHANGES
REVISIO
If trying to reduce number of core indicators, this is not often used and could potentially be removed from final
NS
version, although this should be cross-checked with donor plans – it may for example make sense to retain as
an optional indicator.
4 Gender Equity / Women’s Empowerment (optional)
INDICATOR FEEDBACK
Percentage of women reporting Sometimes used but often adapted, as indicator requires that
shared decision making on cash women (rather than men) respond to question:
transfer use ▪ “We like this, have used both for multipurpose cash and single purpose
cash. Having it as optional is good.”
▪ “Why not include percentage of men reporting shared decision-making on
DRAFT
cash transfer use? Also, indicator doesn't work with female headed
households so had to do some disaggregation.”
▪ “Many offices would've liked to have used this indicator, but changed so
that it reflects whoever the respondent is. Rarely get to speak to the
woman herself - often not doable. Suggest ‘% of HHs reporting joint
decision-making’ or ‘who makes the decision about spending on the
following (health, education, food, etc.)? Male head of HH, women, etc.?’”
SUGGESTED REVISIONS
Modify indicator so that it can be usefully used in the following contexts:
- when male-heads of households (rather than women) respond to questionnaires
- when households are female-headed (and therefore women are de facto responsible for all decision-
making)
World Vision International, Cash and Voucher Programming Compendium of Indicators:
REVISIONS
Ask women members of the household whenever possible. It is recommended to note down whether a woman
or man is asked these questions. (E.g. add a check box prior to these questions: Is the respondent a man or
woman?).
Q1. Are women involved in decision making about how to use cash/voucher assistance in this household?
(Yes/No)
Q2. [optional, recommended] If yes, how often are women involved in decision making about how to use cash
assistance provided? (Always / Sometimes / Rarely / Never)
Q3: [optional, recommended] What types of expenditure are women engaged in decision making about? (open
ended, or options). Possible options: food purchases, hygiene and personal care items, clothing purchases, use
of funds for services, education costs.
135 Recommended Qualitative Questions
QUESTIONS FEEDBACK
- What did the cash help Though rarely tested, the ‘spirit’ of this question was appreciated.
your household to do or ▪ “This was included in PDM in Afghanistan. Like the way that the question is
buy that you could not do formulated, because it asks what you were able to 'do' rather than just what you
or buy before you were able to buy. For example, in Jordan with MPC for winterisation, we didn't
received it? ask 'did you buy jackets' with the cash? But rather 'did you buy jackets during
- Are there important the winter'? so it doesn't have to absolutely be the exact cash you received, but
things that your were you able to do this... Also used in Kakuma camp in Kenya - this question
household is not able to was very interesting for the donors, they wanted to know what could be done
do or buy after receiving with the cash.”
the cash? ▪ “We ask this question in Turkey. Not in the PDM itself, but it is part of the
focus group discussions.”
▪ “Have not used these, because of COVID we cut down on qualitative work.
DRAFT
Think the questions are good but haven't tested them.”
▪ “We haven't used them, but they could be interesting. But would need general
'buckets' or categories. Might be more appropriate for focus group discussions.”
Considered too subjective by some KIs
▪ “Very qualitative. What would I do with this info? Even if wanted a perception
indicator, I wouldn't go for this.”
▪ “Yes, we use this. But one of the biggest complaints is always that the money
wasn’t enough.”
Link to sectoral outcomes
▪ “There is potential to have a lot of sector-related answers here, as it overlaps
with the spirit of the sectoral indicators. Cannot propose universal categories -
would need to be adapted to each context. And time is often limited in
emergencies.”
SUGGESTED CHANGES
Keep this indicator but provide more guidance on how to collect data and how to link with sectoral outcomes.
Potential for cross-analysis with expenditure data. If categories are proposed (as in the suggestion below),
these would need to be adapted to each context. These questions are appropriate for use in PDM and/or focus
group discussions.
Suggestion from GOAL:
We have found in GOAL that "What did the cash help your household to do or buy that you could not do or buy before
you received it?" works in quantitative form by having set response options plus an 'other- please specify' option. Our
REVISIONS
response options are:
a) Managed to acquire more food to eat
b) Family has been able to access good medical care
c) Family is eating more variety and nutritious food
d) Children are eating more often than before
e) Pay rent
f) Household has more money for education and other expenses
g) Repay debts
h) Invest in productive assets for income generation/livelihoods
i) The project has had no significant impact on the family
j) Other, specify
k) Don’t Know
143.3.2 Sectoral indicators.
The guidance in the MPC Outcome Indicator document states that “at least one indicator from each of
three sectors is required; the sectors should be selected based upon the identified needs and people’s
priorities. Using MEB/transfer value categories or amounts may be helpful.” It should be noted that only
one of the respondents in the KII had systematically followed the guidance and used indicators
from three different sectors. Rather, organizations had chosen indicators that seemed appropriate and
feasible for their context. See also section 3.2.2 (above) for analysis on the use of sectoral indicators to
measure outcomes when MPC is used to meet basic needs.
Food Security
INDICATORS FEEDBACK
- Percentage of households FCS widely used, provides useful data but can be complex to collect
by Food Consumption ▪ “Systematically used and mandatory”
Score (FCS) phase (Poor, ▪ “Bread and butter, we all know it”
Borderline, and ▪ “One of our 5 core indicators”
Acceptable) ▪ “Integration into IPC and is widely used. Provides a good baseline. However,
even this can be complex for non-food security teams.”
DRAFT
▪ “It’s a challenge, fixing the thresholds. Have developed a standard format as
the guidance does not make it super clear.”
▪ “Yes we use this and it's been useful, but teams complain that it is very long and
'not dignified'. In Gaza, asking questions about how many times you have
eaten, is considered very degrading to the head of household.”
▪ “There is a need to contextualize this, which also applies to CSI, so there are
challenges with these as comparable indicators. For example, partners in Turkey
have questioned its reliability in a context where baseline food consumption was
already acceptable.”
- Reduced Coping Strategy rCSI often used, suitable in many contexts
Index (rCSI) ▪ “We use a contextualised CSI and also rCSI. Both are very useful and show
interesting results, pick out where we need to focus on.”
▪ “Have adapted this so that it is CSI that can be contextualized and focuses on
protection-related risks. Not giving weighting to different questions - in
monitoring, need to know which coping strategies are used, so that we can
address them with programmatic response.”
▪ “Utility can be limited if there is no historic data. Only really telling you
directional change. Would switch it to Household Hunger Score (HHS), more
sensitive to changes over the last 30 days and can pick up severe food
insecurity.”
SUGGESTED CHANGES
Keep FCS as a required indictor for food security.
REVISIONS
Have rCSI and Household Hunger Scale (HHS) as optional, with a note suggesting that the use of these
indicators depends on the context.
Link to Food Security Indicator Manual
15Shelter & Settlements / Household NFIs
INDICATOR FEEDBACK
• Percentage of households Rarely used and not considered relevant for measuring effect of
whose shelter solutions MPC
meet agreed technical ▪ “MPC alone will not get you these outcomes. Shouldn't be measuring whether
and performance people have access to NFIs, but rather monitoring whether people can cook, eat,
standards sleep - domestic functions that shelter enables. That is the condition that we
• Percentage of target should be trying to measure rather than the technicalities of whether walls are
population living in safe of a certain standard.”
and dignified shelters ▪ “Used this and found that there was no change in quality of housing and
• Percentage of households thought this was good – as people shouldn't move based on a few months of
reporting adequate access MPC. We need to be realistic about the changes that MPC can bring about. But
DRAFT
to household non-food avoiding eviction would be a good indicator. There were changes in meeting
items rental payments (indicator is not included but should be).”
▪ “Indicator comes from SPHERE but is not really relevant. Doubt anyone is
actually using it.”
▪ “Should have % of cash expenditure on rent. Not so established in the shelter
sector, they don't understand why it would be useful to understand expenditure
on rent.”
▪ “More specific to refugee camps? Not the case here, where people find
somewhere to rent and cover their own utility bills. Huge refugee population that
are not able to do this and are evicted.”
▪ “These indicators come from a 'camp' perspective, not an accommodation
perspective. For example, for the Venezuela response, we had to adapt the
indicators.”
SUGGESTED CHANGES
▪ Members of the Shelter Cash and Markets Community of Practice would like to revise the indicators that
currently appear in the document and have shared a number of possible options (see below). Further
consultation should identify final indicators for the shelter sector.
▪ Somalia Shelter Cluster has recently worked with the Cash Working group to provide partners with PDM
REVISIONS
tools that can measure the difference in outcomes between in-kind and cash modalities for shelter and
NFI: https://www.sheltercluster.org/standardized-tools/library/post-distribution-monitoring-tool
▪ Many PDM tools are found both in the Shelter Cluster's Coordination and Information Toolkits:
o https://www.sheltercluster.org/global-shelter-coordination-toolkit/library/2g-response-monitoring-
and-gap-analysis
o https://www.sheltercluster.org/global-shelter-cluster-information-management-and-assessment-
toolkit/library/2d-response-monitoring
▪ UNHCR has been working on new indicators for Shelter and will soon be releasing a specific Shelter form
that helps in measuring outcome of shelter programming (to be included in the same toolkit links above).
16WASH
INDICATORS FEEDBACK
- Percentage of households Rarely used and not considered relevant for measuring effect of
using an unsafe water MPC
source because they ▪ “Should be % of households with access to safe water, according to locally
cannot afford to use a agreed standards.”
DRAFT
safer water source. ▪ “Very limited information would come out of this. Need to measure so many
different things in order to have useful information. Difficult to use. The why -
the causal pathways - might be difficult to ascertain.”
▪ “A lack of access to safe water is often not just a matter of purchasing power so
although this indicator makes sense when access to safe water is clearly
hindered due to financial barriers, it remains difficult to adequately measure
impact using this indicator in broader MPCA interventions.”
- Percentage of households ▪ “Should be % of households with minimum list of WASH NFI”
who have reduced ▪ “Is this a good thing or a bad thing? Hard to know what had to do with the cash
essential WASH related and what had to do with any other kind of implementation. Are you are trying
basic needs expenditures. to infer how cash is contributing to these outcomes?”
▪ “The logic behind this indicator is not entirely clear to me. The provision of cash
would increase purchasing power of a household along with its ability to spend
cash on WASH items, as well as any other items, so why would we want to see
a decrease in WASH expenditures specifically as a result of MPCA? Further
clarification is needed.”
▪ “What does it mean? Wording is really confusing. Are they using cash for
WASH, and therefore it is a good thing? How does it link to MPC?”
▪ “Need to have a panel survey approach, working with the same households. And
it is very difficult to work with the same sample at baseline and endline. Only
other way to ask the question is 'did you reduce your WASH expenditure?' but
real bias, participants are keen to please.”
▪ “Would be useful to see expenditure on soap, have to argue a lot in order for
sectors to understand this, for example, this is included in SPHERE guidance.”
- Percentage of households ▪ “Should be % of households with access to safe sanitation, according to locally
practicing open agreed standards.”
defecation because they ▪ “Not appropriate for urban contexts”
cannot afford to pay to ▪ “Feedback from the Colombia office was that this was also really long and
use a public latrine and/or complex. Could be done in coordination with the WASH unit, as need to
to build a latrine understand what the real barriers are. When you click on the link to the
current recommendations of the WASH cluster, you get to a document which
contradicts what is written here! Document has 6 indicators listed, if core
conditions are met. Which of these two documents take precedence?”
17SUGGESTED CHANGES
Suggest to use standard WASH-related indicators and note that, if certain conditions are met then some
WASH-related outcomes can be expected. Seems to have been some confusion when indicators were
submitted. Should refer to original guidance from WASH Cluster.
Indicators:
If water supply related costs are included in the transfer value:
- Percentage of beneficiary households with adequate access to water for Drinking, Cooking, and
Personal and Domestic Hygiene at agreed standards
REVISIONS
- Percentage of beneficiary households possessing minimum list of WASH NFI in their household,
following agreed standards, and with visible signs of use
If sanitation related costs are included in the transfer value:
- Percentage of beneficiary households with adequate access to a toilet at agreed standards
- Percentage of men, women, boys and girls who last defecated in a toilet (or whose faeces were last
disposed of in a safe manner)
If hygiene related costs are included in the transfer value:
- Percentage of beneficiary households possessing minimum list of WASH NFI in their household,
following agreed standards, and with visible signs of use
- Percentage of beneficiary households with a handwashing place identified including soap and water in
their household, with visible sign of use.
Education
INDICATOR FEEDBACK
- Percentage of households with school- Rarely used and not considered practical for measuring
age children with at least 1 school-age effect of MPC
child who had to miss school because ▪ “Has to be reformulated, not OK as it is... Need to look at an
of costs associated with schooling education outcome - focus on enrolment or access? To look at
(during the recall period) access, you need other data, you can't get this from PDM data,
you need to verify through other channels. If you can only focus
on PDM, let’s look at education-related expenditure. Can ask
what % of the cash was spent on education costs. And ‘Out of
your school age children, how many go to school?’ (but would
DRAFT
need further verification).”
▪ “We’re asking first part but not second part. For example
'financial barriers' are not always identified as such by the
households themselves. Even though school is free, cash might
be an enabler (cash can pay for transport).”
▪ “Think that this is a good indicator, even though it is perception
based – but need to have a follow-on question about why.”
▪ “We asked whether children had been withdrawn from school
because money had been used for food (linked to rCSI)”
▪ “We have other education questions.”
▪ “Really hard one. Think this needs to be revised.”
SUGGESTED CHANGES
Intend to revise existing indicator, with a preference for attendance, though understand that this could not be
REVISIONS
collected during PDM and may need further verification from other sources.
Would like to be consulted again and to check with Education and CVA task team.
18You can also read