Review on Infrared and Electroluminescence Imaging for PV Field Applications - Report IEA-PVPS T13-10:2018
←
→
Page content transcription
If your browser does not render page correctly, please read the page content below
Review on Infrared and
Electroluminescence Imaging
for PV Field Applications

Report IEA-PVPS T13-10:2018
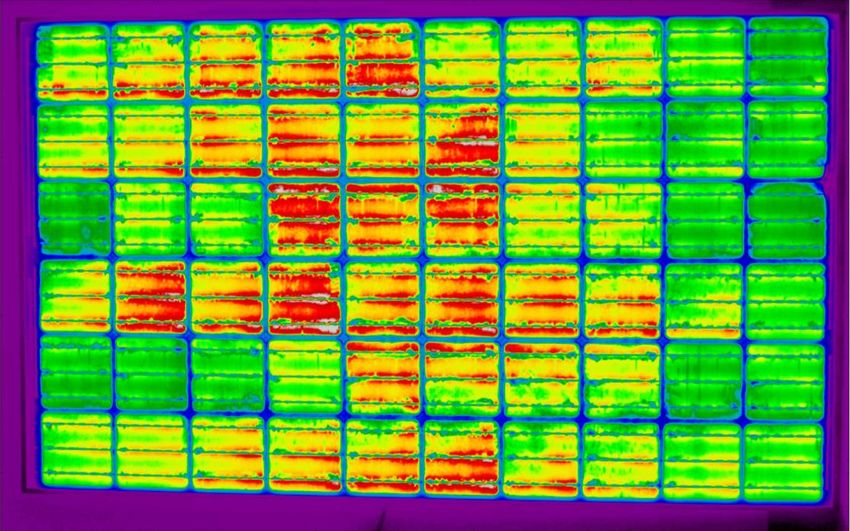
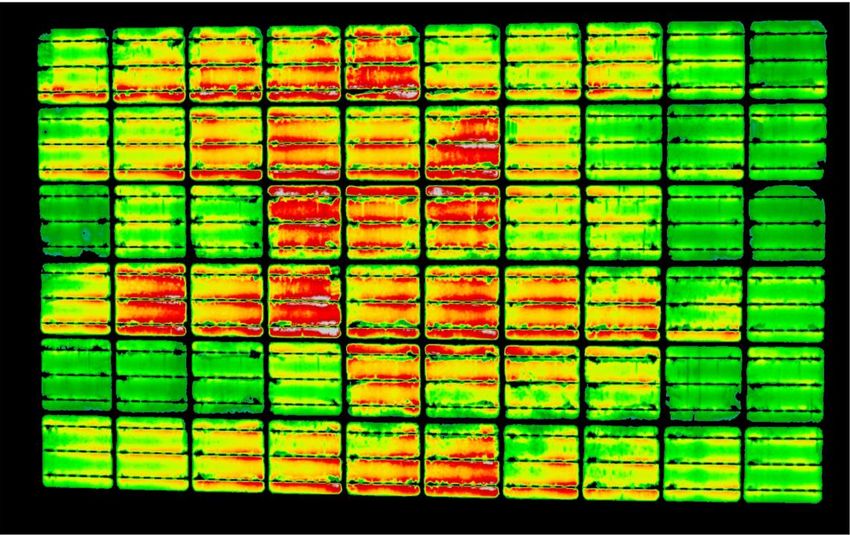
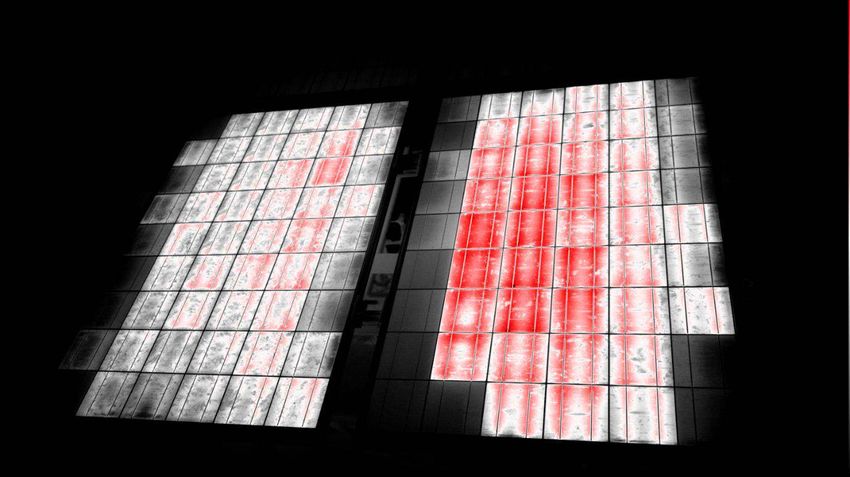
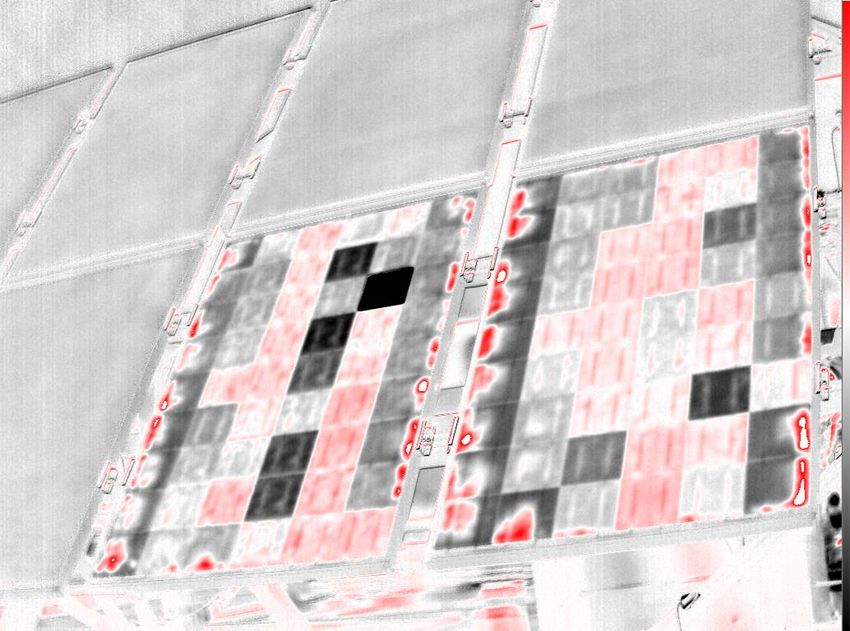
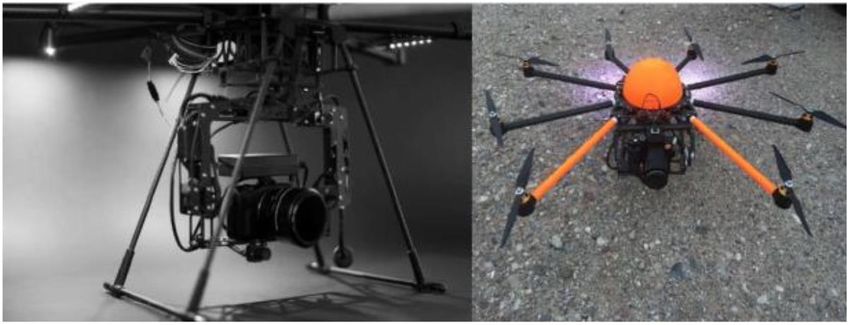
Cover Photos:
Left: Outdoor infrared inspection using a drone for IR failure detection of PV power
plants. Photo curtesy of TÜV Rheinland Energy, 2017.
Right: Night-time electroluminescence image using a consumer digital single-lens reflex
camera of PID affected PV modules, in a black-white-red colour scheme. Photo curtesy of
B. Kubicek, AIT, 2017.
INTERNATIONAL ENERGY AGENCY
 PHOTOVOLTAIC POWER SYSTEMS PROGRAMME

 Review on Infrared and Electroluminescence
 Imaging for PV Field Applications

 IEA PVPS Task 13, Subtask 3.3
 Report IEA-PVPS T13-10:2018
 March 2018

 ISBN 978-3-906042-53-4

 Primary authors:

 Ulrike Jahn, Magnus Herz
 TÜV Rheinland, Cologne, Germany

 Marc Köntges,
Institute for Solar Energy Research Hamelin, Emmerthal (ISFH), Germany

 David Parlevliet
 Murdoch University, Perth, Australia

 Marco Paggi
 IMT School for Advanced Studies Lucca, Italy
Ioannis Tsanakas
 Interuniversity Microelectronics Centre (IMEC), Leuven, Belgium

 Joshua S. Stein
 SANDIA National Laboratory (SNL), Albuquerque, NM., USA

 Karl A. Berger,
Austrian Institute of Technology GmbH, Center for Energy (AIT), Austria

 Samuli Ranta
 Turku University of Applied Sciences, Finland

 Roger H. French
 Case Western Reserve University, Cleveland, Ohio, USA

 Mauricio Richter
 3E, Belgium

 Tadanori Tanahashi
National Institute of Advanced Industrial Science and Technology (AIST),
 Japan

 Contributing authors:

 Erin Ndrio, Gerhard Mathiak
 TÜV Rheinland, Cologne, Germany

 Bernhard Weinreich
 HaWe Engineering GmbH, Germany

 David Hottenrott
 Fraunhofer ISE, Germany
Justin S. Fada
 Case Western Reserve University, Cleveland, Ohio, USA

 Bernhard Kubicek
 Austrian Institute of Technology GmbH, Center for Energy (AIT), Austria

 Claudia Buerhop-Lutz
 ZAE Bayern, Erlangen, Germany

 Vasco Medici
 SUPSI ISAAC, Canobbio, Switzerland

 This report is supported by

 Austrian government, by means of the Austrian Federal Ministry for
Transport, Innovation and Technology (bmvit), represented by the Austrian
 Research Promotion Agency (FFG), under contract No. 853028

European Research Council under the European Union’s Seventh Framework
Programme (FP/2007-2013) to the ERC Starting Grant “Multi-field and multi-
 scale Computational Approach to Design and Durability of PhotoVoltaic
 Modules” - CA2PVM (Grant Agreement n. 306622)

 German Federal Ministry for Economic Affairs and Energy (BMWi)
 under contract no. FKZ 0325786 A_B_C

 Swiss Federal Office of Energy (SFOE)

 U.S. Department of Energy (DoE)
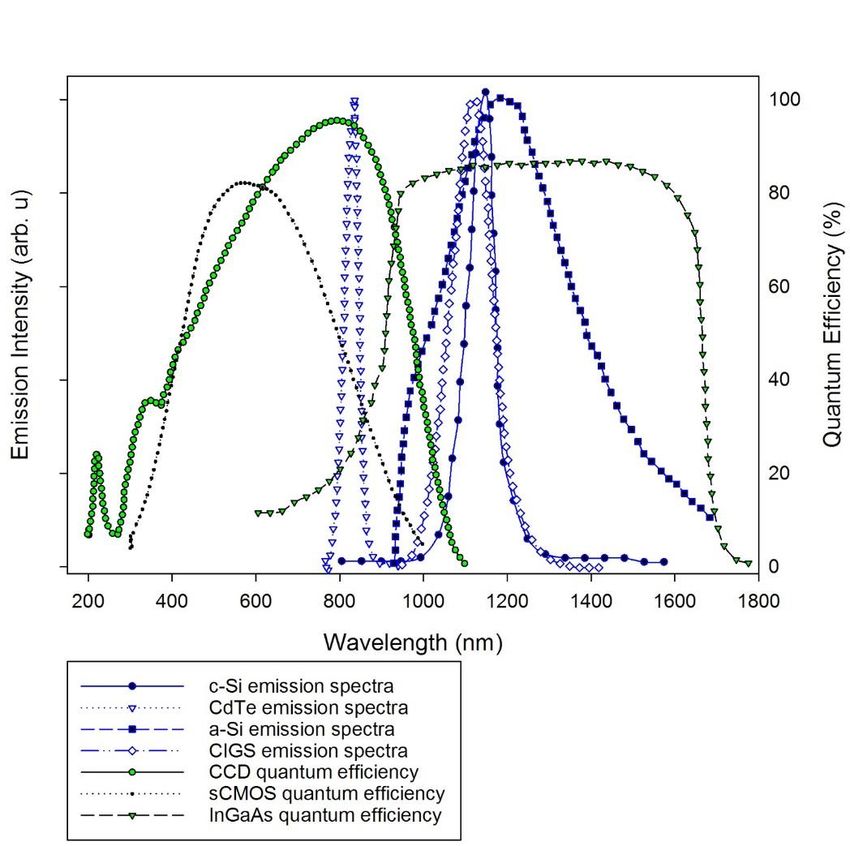
Table of Contents
Table of Contents ............................................................................................................................... 3

Foreword ............................................................................................................................................ 5

Acknowledgements ............................................................................................................................ 6

List of Abbreviations........................................................................................................................... 7

Executive Summary ............................................................................................................................ 8

1 Introduction ............................................................................................................................. 12

2 Infrared Imaging ....................................................................................................................... 15

 2.1 State of the art of IR Imaging ............................................................................................ 15

 2.1.1 Review of existing standards/guidelines .................................................................. 15
 2.1.2 Overview of camera types........................................................................................ 16
 2.1.3 Evaluation of existing practice ................................................................................. 18
 2.2 Test requirements............................................................................................................. 23

 2.2.1 Camera requirements .............................................................................................. 23
 2.2.2 Environmental conditions ........................................................................................ 28
 2.2.3 Recording procedures .............................................................................................. 32
 2.2.4 Comments and recommendations ........................................................................... 34
 2.3 Classification and evaluation ............................................................................................ 35

 2.3.1 Sample patterns with abnormalities ........................................................................ 35
 2.3.2 Infrared thermography imaging of PID-s affected modules .................................... 44
 2.3.3 Recommendation for analysis .................................................................................. 47
 2.3.4 Recommendations for action ................................................................................... 49
3 Electroluminescence Imaging .................................................................................................. 51

 3.1 State-of-the-art of electroluminescence imaging............................................................. 51

 3.1.1 Review of existing standards/guidelines .................................................................. 51
 3.1.2 Overview of electroluminescence camera types ..................................................... 54
 3.1.3 Evaluation of existing practice ................................................................................. 59
 3.2 Test requirements............................................................................................................. 61

 3.2.1 Camera requirements .............................................................................................. 61
 3.2.2 Recording procedures .............................................................................................. 62
 3.2.3 Comments and recommendations ........................................................................... 64
 3.3 Classification and evaluation ............................................................................................ 66

 3.3.1 Methods of analysis ................................................................................................. 66
 3.3.2 Recommendations for analysis ................................................................................ 70

 3
4 Pros and Cons ........................................................................................................................... 82

5 Conclusions............................................................................................................................... 84

6 References ................................................................................................................................ 87

 4
Foreword
The International Energy Agency (IEA), founded in November 1974, is an autonomous body within
the framework of the Organization for Economic Co-operation and Development (OECD) which
carries out a comprehensive programme of energy co-operation among its member countries. The
European Union also participates in the work of the IEA. Collaboration in research, development
and demonstration of new technologies has been an important part of the Agency’s Programme.

The IEA Photovoltaic Power Systems Programme (PVPS) is one of the collaborative R&D
Agreements established within the IEA. Since 1993, the PVPS participants have been conducting a
variety of joint projects in the application of photovoltaic conversion of solar energy into electricity.

The mission of the IEA PVPS Technology Collaboration Programme is: To enhance the international
collaborative efforts which facilitate the role of photovoltaic solar energy as a cornerstone in the
transition to sustainable energy systems. The underlying assumption is that the market for PV
systems is rapidly expanding to significant penetrations in grid-connected markets in an increasing
number of countries, connected to both the distribution network and the central transmission
network.

This strong market expansion requires the availability of and access to reliable information on the
performance and sustainability of PV systems, technical and design guidelines, planning methods,
financing, etc., to be shared with the various actors. In particular, the high penetration of PV into
main grids requires the development of new grid and PV inverter management strategies, greater
focus on solar forecasting and storage, as well as investigations of the economic and technological
impact on the whole energy system. New PV business models need to be developed, as the
decentralised character of photovoltaics shifts the responsibility for energy generation more into
the hands of private owners, municipalities, cities and regions.

IEA PVPS Task 13 engages in focusing the international collaboration in improving the reliability of
photovoltaic systems and subsystems by collecting, analyzing and disseminating information on
their technical performance and failures, providing a basis for their technical assessment, and
developing practical recommendations for improving their electrical and economic output.

The current members of the IEA PVPS Task 13 include:

Australia, Austria, Belgium, Canada, China, Denmark, Finland, France, Germany, Israel, Italy, Japan,
Malaysia, Netherlands, Norway, SolarPower Europe, Spain, Sweden, Switzerland, Thailand and the
United States of America.

This report focusses on test requirements, recording procedures, analysis methods and guidelines
of infrared (IR) and electroluminescence (EL) imaging for PV field applications. This document shall
help to identify, record and assess the most common failures of PV modules and components in
the field.

The editors of the document are Ulrike Jahn and Magnus Herz, TÜV Rheinland, Germany (DEU).

The report expresses, as nearly as possible, the international consensus of opinion of the Task 13
experts on the subject dealt with. Further information on the activities and results of the Task can
be found at: http://www.iea-pvps.org.

 5
Acknowledgements This paper received valuable contributions from several IEA-PVPS Task 13 members and other international experts, all of whom are listed as primary and contributing authors. In addition, we thank the following individuals for their careful reviews and suggestions: David Parlevliet Murdoch University, Perth, Australia Karl. A. Berger Austrian Institute of Technology GmbH, Center for Energy, Austria Samuli Ranta Turku University of Applied Sciences, Finland Marco Paggi IMT School for Advanced Studies Lucca, Italy Werner Knaupp PV-plan, Stuttgart, Germany Bengt Jäckel UL International Germany GmbH, Neu-Isenburg, Germany Furthermore, we like to thank Ms. Barbara Schiffer and Ms. Cathy Zhou, TÜV Rheinland, for their efficient coordination and editing work to prepare this report. 6
List of Abbreviations
BOS Balance of system
CCD Charge coupled devices
CdTe Cadmium telluride
CIGS Copper indium gallium selenide
CMOS Complementary metal oxide semiconductor
DSLR (camera) Digital single-lens reflex (camera)
EL Electroluminescence
FEM Finite element analysis
FOV Field of view
IFOV Instantaneous field of view
InGaAs Indium gallium arsenide
IRT Infrared thermography
IS International standards
MFOV Measurement field of view
MILC (camera) Mirrorless interchangeable lens (camera)
MPP Maximum power point
MPPT Maximum power point tracking
NETD Noise equivalent temperature difference
PID Potential induced degradation
PID-s Potential induced degradation by shunts
PVP Photovoltaic plant
ROI Regions of interest
TS Technical specifications
UASs Unmanned aerial systems
UAV Unmanned aerial vehicle

 7
Executive Summary
In this report, we present the current practices for infrared (IR) and electroluminescence
(EL) imaging of PV modules and systems, looking at environmental and device
requirements on one hand, and on the interpretation of sample patterns with
abnormalities on the other hand. The goal is to provide recommendations and guidelines
for using IR and EL imaging techniques to identify and assess specific failure modes of PV
modules and systems in field applications.
Currently, two Technical Specifications for IR Imaging are developed within the IEC
Technical Committee TC 82. They describe a test procedure, and are not intended to have
pass/fail criteria for the PV modules being investigated. While IEC/TS 60904-12 (draft)
describes general methods of thermographic imaging for laboratory or production line
purposes, focusing on the infrared imaging techniques of the PV module itself, IEC/TS
62446-3 describes investigations of PV modules and the entire plant in operation under
natural sunlight. This document gives guidance for preventive maintenance and fault
diagnostics of PV plants by means of infrared imaging techniques while the plant is
operating under natural sunlight. The subjects of the investigation include PV modules, as
part of the array, as well as balance of system (BOS) components such as cables, fuses,
switches and inverters.
There are two different types of infrared or thermographic cameras, having cooled or
uncooled detectors. The sensors of cooled thermographic cameras are made from narrow
band gap semiconductors and while having very high sensitivity, are not commonly used in
PV applications due to the cost and complexity of the associated cooling system. More
commonly used thermographic cameras are those based on uncooled sensors that can
work at ambient temperatures. These styles of sensors can be produced from a range of
materials, however a common architecture is the micro-bolometer. This style of uncooled
sensor is an appropriate thermographic camera type for PV applications due to its simplicity
and affordability.
There is a broad variety of infrared cameras with a range of specifications on the market.
The most suitable type of camera will depend on the application at hand. For example,
handheld cameras are suitable for field inspection of PV modules. However, the same range
of specifications may not be available for other applications such as airborne (UAV) surveys
of PV plants due to the different lenses and distances in use. An appropriate selection of
an adequate class of IR camera for use or purchase depends on the various possible use
cases and detailed inspection tasks for that camera. It is impossible to give a
straightforward decision matrix. While high end IR cameras will allow more possibilities for
the analysis of detected thermal abnormalities, we acknowledge that for a number of IR
inspection cases, medium class cameras are fully sufficient. In this report, Section 2.1.2
describes the types of cameras used for IR imaging.
Stable environmental conditions are a pre-requisite for high quality outdoor IR imaging of
PV modules and arrays. Weather fluctuations must be much slower than the thermal time
constant of the PV module. A typical PV module takes 5 to 15 minutes to thermally stabilize
for new environmental conditions such as change of global irradiation intensity,
temperature, or wind speed. Furthermore, thermal reflections of clouds, buildings, trees,
or other objects on the PV modules must be avoided or minimized as they may distort the
 8
evaluation of the IR image. This is usually done by either waiting for more stable conditions
or moving the position of the IR camera to avoid specific reflections.
One important parameter derived from IR images is the temperature difference between
different parts of the module or between modules and/or strings of modules. Inactive areas
of a module or string usually appear hotter than surrounding active areas. When a PV
module or string is not functioning, this energy is not converted to DC power and therefore
remains as excess heat, which raises the temperature of the module or string. Inactive
modules often suffer from one of the following defect types: disconnected PV modules or
strings, PID effects or shunted cells, and short-circuited bypass diodes. These types of
failures cause only a slight temperature increase between active and inactive parts, and
this difference is often proportional to the irradiance. Thus it is more difficult or even
impossible to detect these types of failures under low irradiance conditions. Hot spots that
arise from poor electrical connections or severe mismatch within a module are another
important type of failure that is usually easily detectable using IR.
The aim of thermographic inspections is to detect failures before yield reduction or serious
material damage will occur. Because outlined damages often have not developed yet, the
objective interpretation of thermographic scans is not trivial. However, these defects have
the potential to cause power degradation in subsequent years. Hot spots with strong local
heat gradients can affect the performance of the PV modules significantly and even, in
extreme cases, lead to smouldering fires. IR imaging is a valuable tool to detect power
relevant, malfunctioning PV modules, module strings, and certain devices in a PV array if
the presence of artefacts, like partial shading, dirt, can be excluded. For high quality images
it is recommended to take the IR images at high solar irradiance (> 600 W/m²) and constant
ambient conditions (no clouds, low wind speed, stable ambient temperature).
The International Technical Specification IEC/TS 60904-13 (draft) specifies methods to
capture electroluminescence images of photovoltaic modules, process images to obtain
quantitative descriptors, and provide guidance to qualitatively interpret the EL images. EL
images are obtained with camera detectors that are typically charge coupled devices (CCD)
or complementary metal oxide semiconductor (CMOS). They may be cooled, usually with
thermoelectric cooling, to achieve better signal to noise ratio by means of reducing device
dark current originating from thermally generated charges. Relevant parameters in
choosing detectors include number of pixels, noise, quantum efficiency at the wavelength
of interest, and dynamic range. Silicon detectors are very often used and, for special
applications, InGaAs detectors are employed.
High quality images are best taken in darkened environment for a better signal to noise
ratio. Precautions should be taken to eliminate stray light entering the imaging studio, such
as with use of hard walls, curtains, baffles, and sealing of any gaps with material that are of
light absorbing nature (black). Fixed mounting of the camera and a mounting rack for PV
module(s) to be imaged are used so that the camera and the module positions are stable.
In the field, an option is to use curtains supported by a frame to cover the camera and the
photovoltaic module. Alternatively, images have to be taken at sunset or during night.
There are a range of manufacturers in the market that produce cameras suitable for EL
applications. The key specification for EL camera systems is derived from the need for the
camera to be sensitive to the emission spectra of the material being tested. For a crystalline
silicon solar module the emission spectra has a peak at 1150 nm, while for other

 9
technologies such as organic PV the emission peak resides at a longer wavelength (1200 nm
– 1400 nm) as described by T. Fuyuki et. al. in Appl. Phys. Letters in 2005.
While task specific EL camera can be prohibitively expensive for many users, it has been
shown by K. Mertens that a relative simple modification enables consumer DSLRs to
perform EL imaging. More recently non-reflex, mirrorless interchangeable lens cameras
with large sensors can also be modified for EL application as demonstrated by J.S. Fada.
The choice of the type of EL camera that is used when imaging PV modules is dependent
on a range of factors. As with many types of camera equipment there is trade-off between
cost, resolution and sensitivity. For example, silicon CCD cameras tend to have a higher
resolution and lower cost than InGaAs CMOS sensors. While their high resolution makes
silicon CCD sensors a popular choice, the InGaAs sensor would have a significantly greater
sensitivity to crystalline silicon and some thin-film technologies. Despite the differing levels
of sensitivity, with appropriate data collection intervals and methodologies, such as longer
exposure times, filters and active cooling of the sensor, either camera type can be used for
EL imaging of PV modules. This allows a great deal of flexibility in terms of the equipment
used, but does make standardization of test images and measurements a challenge.
The EL technique can be profitably applied to detect and distinguish between different
failures modes. This type of non-destructive inspection includes the possibility to observe
defects and attribute them to the different stages of the PV module lifetime. For instance,
defects can be caused by production problems not noticed after quality control, wrong
handling of the PV module without enough care during transport or installation, or can be
induced by environmental loading and degradation in the field after installation. Clearly, all
of these causes might have different implications in terms of warranty claims and operation
and maintenance actions. EL images taken on a set of PV modules before their installation
can be very useful in case of legal actions against producers, since production defects can
be clearly distinguished at that time. However, in many cases EL imaging is requested by
customers at a much later stage, after detecting an unexpected low power output of their
PV parks. However, the amount of time required to take a good quality EL image of a PV
module, adjusting the focus and finding the right time of exposure depending on the
module type, is often still a limiting factor for large-scale applications of EL imaging in the
field.
In this report, Section 3.1.2 describes the types of cameras used for EL imaging and provides
a discussion of sensors. Sensors with larger numbers of pixels per unit area typically yield
better results for resolving image features, however, depending on the material, noise and
quantum efficiency limitations can increase with higher resolution. Though with modern
signal processing algorithms and image analysis software it is possible to mitigate a portion
of the effects of noise on the resultant images.
This report provides a comparison of the relative merits of EL and IR imaging techniques in
Chapter 4. These types of optical measurement provide fast, real-time and high resolution
images with a two-dimensional distribution of the characteristic features of PV modules. IR
imaging measurements of the thermal behaviour of cells in a module allows a number of
defects to be easily and quickly identified. These include short circuits in solar cells, shunts,
inactive cell parts and PID. However, not all the failures of PV modules lead to an increase
in temperature. Taking this into consideration the IR measurements alone cannot identify
all the types of failures. On the other hand, PV modules with clear EL-images sometimes
provide IR-images with hot areas. A combination of both techniques quickly detects the
 10
most common defects in a PV module with high accuracy and provides a good indication of
the health and reliability of the PV modules with a plant.

 11
1 Introduction
The quality assurance measures for PV modules are of fundamental importance for any PV
power plant asset. The failure-free operation of the PV modules is a prerequisite for
efficient energy production, long life, and a high return on the investment. During
operation PV modules may develop defects which can be repaired if they are detected in
time, but they can cause a severe drop in energy production and sometimes safety issues.
To ensure the operation of the PV modules without significant losses, fast and reliable
methods to evaluate the performance of the photovoltaic modules are required, both
during the production process and after the installation of the PV modules. For that reason
more and more EPC and O&M companies offer regular IR and EL imaging inspections of PV
plants to ensure the safety and high performance of the PV array in addition to IV curve
measurements and monitoring. IR and EL are two imaging techniques, which identify faults
and problems developing with PV modules.
The use of infrared (IR) imaging for the evaluation of PV modules has many advantages.
First of all, a great number of failures developed on PV modules can be detected using IR
imaging, from hot-spots to mismatch losses or installation failures. Furthermore, IR imaging
technique can be applied for non-destructive testing and used to scan installed PV modules
during normal operation. Finally, thermal cameras also allow scanning large areas within a
short time frame. In Figure 1-1 (bottom) the required time for the inspection of a PV plant
is shown, according to its nominal power, using a hand-held IR camera. For instance, a PV
plant of 4 MWp nominal power will require approximately 15 to 20 hours of IR inspection
taking into consideration that all the other factors that might affect the inspection are ideal.

In Figure 1-1 (top) the required time for IR inspection using an IR camera attached to a
drone, with respect to its nominal power, is shown. Due to the high resolution of IR cameras
existing in the market today, such an inspection approach using drones, is possible. Using
drones, for instance, a PV plant of 4 MWp nominal power will require approximately 5 to
10 hours of IR inspection taking into consideration that all the other factors that might
influence the inspection are ideal.

The optimized operation of the PV cell is to absorb the light and convert it into electricity.
However, due to reciprocity principle the opposite is also possible and offers the
opportunity of Electroluminescence (EL) imaging. Electroluminescence is a phenomenon
that has been used for a long time for other applications such as lightening, but recently
has been introduced as an investigation procedure for PV modules and strings. It consists
of applying a direct current to the PV module and measuring the photoemission by means
of an infrared-sensitive camera. EL imaging provides insight into micro cracks and other
defects within the cell material. This in turn helps identify faults and problems present or
developing within the PV module.

 12
0h 20 h

 0h 40 h

Figure 1-1 The required time for the inspection of PV modules using IR cameras, attached
to a drone (top), and hand-held camera at the ground (bottom) with respect to the nominal
power of the PV plant. The colours are used to identify the different time ranges for IR
inspections.

In Figure 1-2 the required time for the inspection of a PV plant, with an EL camera attached
to a drone, according to its nominal power is shown. In this case a PV plant of 4 MWp
nominal power needs approximately 20 to 40 hours of EL inspection taking into
consideration that all the other factors that might influence the inspection are ideal.

In Figure 1-2 (bottom) the required time for the inspection of a PV plant, with one EL
camera, according to its nominal power is shown. For instance, a PV plant of 4 MWp
nominal power requires approximately 100 - 150 hours inspection taking into consideration
that all the other factors that might influence the inspection are ideal.

 13
0h 80 h

 0h 300 h

Figure 1-2 The required time for the inspection of PV modules with EL Imaging, attached to
a drone (top), and hand-held camera at the ground (bottom) with respect to the nominal
power of the PV plant. The colours are used to identify the different time ranges for EL
inspections.

This report presents a review of current practices used in regarding IR and EL Imaging. In
Chapter 2 an introduction in the IR Imaging is given as well as test requirements and
examples. The-state-of-art technology and techniques are given. Chapter 3 deals with the
EL Imaging and has the same structure as Chapter 2. For both inspection methods an
overview is given to include information about the current market. In Chapter 4, the
advantages and disadvantages of both methods are compared and discussed.

 14
2 Infrared Imaging

2.1 State of the art of IR Imaging
2.1.1 Review of existing standards/guidelines
Within the IEC Technical Committee TC 82 (Photovoltaic), currently two Technical
Specifications are developed: Technical Specifications (TS) approach International
Standards (IS) in terms of detail and completeness, however, they usually describe a (test)
procedure and do NOT include pass/fail criteria associated with the test results.
The TC 82 system working group (WG3) was working on a new TS embedded in the IEC
62446 series, dealing with system testing, documentation and maintenance of PV plants,
IEC/TS 62446-3 “Photovoltaic modules and plants – Outdoor infrared thermography“ [1].
In this document guidance for preventive maintenance and fault diagnostics of PV plants
by means of infrared imaging techniques is given, while the plant is operating under natural
sunlight. The subjects of the investigation include the PV modules, as part of the array, and
the Balance of System (BOS) components such as cables, fuses, switches, inverters. While
IEC/TS 62446-3 describes investigations of PV modules under natural sunlight in operation,
procedures that use external current sources - e.g. for indoor inspections in the dark - are
also described. As mentioned above, it is a Technical Specification too, having an
instructional purpose, and is not intended to have pass/fail criteria for the PV modules
being investigated.
A chapter in IEC/TS 62446-3 deals with the principles of heated and cooled regions in PV
modules operated with and without irradiation applied, and how quantitative metrics of
the severity of module failures/damages can be achieved. The TS closes with reporting
requirements, and with a Table for qualitative interpretation of IR images and failure
modes (from [3], with some modifications). In an Appendix additional information about
optics and optical calculations are summarized.
The TC 82 photovoltaic module working group (WG2) is - within the IEC 60904
“Photovoltaic Devices” series of standards, dealing with measurement procedures - also
working on the proposed Part 12, IEC/TS 60904-12 “Infrared thermography of photovoltaic
modules” [2]. It describes general methods of thermographic imaging for laboratory or
production line purposes, focusing on the infrared imaging techniques of the photovoltaic
module itself. Guidance will be given on how to capture thermal images of photovoltaic
modules with sufficient quality, how these data can be processed to obtain quantitative
metrics to gain further insight, and to provide guidance on how such images can be
interpreted qualitatively.
In introducing the chapters terms, definitions and acronyms are assembled that have to do
with the (electrical) operation of a photovoltaic module, as well as basics about thermal
imaging cameras, its lenses, resolution and aberrations. Common helpful post processing
features are also briefly summarized and hints for the useful range of the angle of view and
precautions to minimize reflections are given.

 15
For (indoor) dark thermography using external power supply under forward bias
conditions, it is recommended not to take only a single image for (almost) equilibrium
conditions, but to take images in (predefined) time intervals. Typical values for the time
span from applying the forward bias are given in brackets for a standard module that is
viewed from the back sheet side, to:
 ● have an initial thermal image including artefacts and reflections, useful for
 calculating differential images (0 s),
 ● see where possible extreme heating points occur during heating process, (20 s),
 ● image an equilibrium temperature distribution pattern, for e.g. the maximum
 power point current (2 min),
 ● better image the less severe heating effects (4 min), for two times the maximum
 power point current - if that can be safely applied, and
 ● list these points of time and the image numbers together with the current and
 voltage measurements in a tabulated form.

If a PV module is operated in steady state under illumination within a string, the operating
point is normally set by the inverter close to the maximum power point of the string,
depending on the actual irradiation and temperature. If the I-V curve of a (faulty) module
investigated differs from the I-V curve of the other modules in a string, the resulting
operating point will differ from the operating point of a single module if a resistive load is
applied. The string behaviour can be reproduced by a controlled power source applied on
a single module with the maximum power point current set point calculated from the data
sheet values considering the measured in plane irradiation and module temperature. As
described above for dark conditions, an analogue procedure is described for irradiated
outdoor conditions or in steady state solar simulators.

2.1.2 Overview of camera types
Infrared thermography (IRT) has been used for detecting shunts in solar cells under reverse
bias in the dark since 1990 [4]. However, lately uncooled infrared detectors have gained
wide attention for infrared imaging applications, due to their advantages such as low cost,
low weight, low power and large spectral response compared to those of photon detectors
[5].
According to the black body radiation law any object above absolute zero will emit infrared
radiation and its characteristics can be used to measure the temperature. Therefore,
infrared measuring devices acquire infrared radiation emitted by an object and transform
it into an electronic signal [6]. The detected radiation from the objects can be imaged from
the IR camera and abnormalities in the temperature of the objects can be observed.
However, the IR camera does not receive only the radiation from the object but the
reflection of surroundings as well. Emissivity, reflection radiation and absorption of the
atmosphere are some parameters that influence the measurement of the temperature of
the inspected object. Therefore, the following parameters have to be measured or/and
entered into the camera software:
 1. Emissivity, which qualifies how much radiation is emitted compared to a
 blackbody. Typical emissivity values are 0.85 for the glass and 0.95 for the polymer

 16
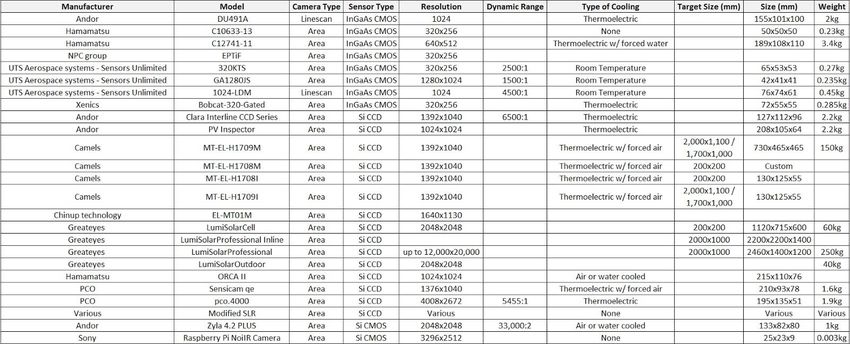
back sheet, respectively, if the angle of view is within 90°- 60° (glass) and 90°- 45°
 (polymer)
 2. Reflected temperature in order to compensate for the radiation reflected in the
 object
 3. Atmospheric temperature and humidity.

 The sensors of
There are infrared or thermographic cameras with cooled and uncooled detectors.
cooled thermographic cameras are made from narrow band gap semiconductors and while
having very high sensitivity, are not commonly used in PV applications due to the cost and
complexity of the associated cooling system.
Commonly used thermographic cameras are based on uncooled sensors that can work at
ambient temperatures. The most common sensor architecture is the micro-bolometer.
These styles of sensors can be produced from a range of materials, however a common
architecture is the micro-bolometer. This is seen in a range of consumer handheld
thermographic cameras. This style of uncooled sensor is an appropriate thermographic
camera type for PV applications due to its simplicity and affordability. There are a broad
range of these styles of cameras available on the market.
Some important characteristics for an IR camera system for PV applications are:
 1. Detector resolution, the higher the resolution, the higher the cost of the camera.
 Pixels are the data acquisition points for thermal measurements, and the data are
 used to create a visual image from the thermal profile. The more pixels and data
 points per investigated area, the more accurate the thermal interpretation and
 the higher the resolution of the thermal image. High resolution is particularly
 important because it allows identification of smaller image details and therefore
 more accurate temperature measurements, for the same field of view [7].
 2. Noise equivalent temperature difference (NETD) or thermal sensitivity is
 considered to be of great importance for the process of evaluating and comparing
 performances of thermal imagers which are essentially non-contact temperature
 measurement devices [8].
 3. Accuracy, including tools for entering emissivity and reflected temperature values.
 Those parameters, when have been correctly inserted, can produce accurate
 temperature measurements.
 4. Intercompatibility of the generated photos
 5. Screen resolution
 6. Ergonomic features:
 a. Weight
 b. Battery
 c. Interactive controls
 7. User Interface:
 a. Report generation
 b. Connectivity
 8. Warranty

 17
Table 2.1.1: Overview of camera characteristics.

An overview of the range of characteristics and specifications for IR cameras used in PV
applications is shown in

Table 2.1.1. As can be seen, there is a broad variety of infrared cameras with a range of
specifications on the market. The most suitable type of camera will depend on the
application at hand. For example, handheld cameras are suitable for field inspection of PV
modules, however, there are recommendations on the minimum resolution required as
described in section 2.2. However, the same range of specifications may not be available
for other applications such as airborne (UAV) surveys of PV plants due to the different
lenses and distances in use.

2.1.3 Evaluation of existing practice
A significant amount of published research studies have been reported in the literature
through the last decade, reflecting the increasing interest in the application of infrared
thermography (IRT) measurements and their potential for fault diagnosis of PV installations
in the field [9].
In the early steps of such studies, [10] first investigated the applicability and practicality of
IRT imaging of PV modules under outdoor conditions. For PV array-scale applications, [11]
used IRT to assess the condition of a building integrated, grid-connected PV array. The
investigated PV system presented abnormally low performance, which finally exhibited
abnormal temperature profiles through the acquired thermal images. These abnormalities
were due to either the panel material itself or the overall function. In terms of accuracy
and practicality of IRT measurements of PV modules’ materials, three different early
studies [12], [13], [14] discussed the infrared reflection errors related to the glass covers as
well as variations between the cell temperature and the measured modules’ temperature
for different back sheet materials. In addition, [15] presented a procedure for accurate
measurement of IR emissivity of the glass surface, in the spectral range of the thermal
cameras that were used, proposing a necessary correction (offset) of the temperatures
measured by such bolometer detectors.
The importance of further interpretation of the thermal images and the correlation
between performance degradation, fault types and thermal signatures of PV modules was
introduced in [16], [17]. In particular, [16] showed that by the combination of several IRT

 18
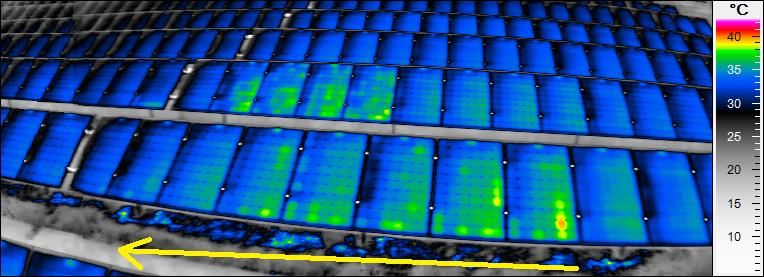
measurement methods typical defects in crystalline silicon (c-Si) PV modules and their
influence on the I-V curve (e.g. the series resistance or the short- circuit current) can be
explained. In particular, it was found that in the case of sun illuminated thermography
several defects can be distinguished by varying the electrical load on the PV module. In
another experimental study [17], daily profiles with one minute I-V field measurements
were acquired from a range of defective PV modules. These were collected together with
additional continuous IR imaging and meteorological data sampling. A direct relation
between the power output (thus, energy yield) losses and the thermal differences was
observed; however, in order to quantify the effective loss in kWh/kWp per year further
evaluation is needed and is not published yet.
Focusing on more particular mechanisms of abnormal heat development in PV modules, in
[18], [19], [20], the formation of hot spots and the early challenges upon their
quantification and detection by means of IRT were addressed. Being focused on indoor IRT
applications, the approach proposed by [18] shows that, through short-time illumination
of c-Si PV modules at high irradiance (1000 W/m²), the location, the geometry and the area
size of hot spots can be evaluated from raw IRT data. It was particularly concluded that hot
spots with smaller area or higher leakage current densities, are more critical for a hot spot
formation in a partially shaded PV module and present higher temperatures. On the other
hand, in [19], [20] field IRT measurements and basic thermal image analyses were
implemented toward the successful detection of hot spots corresponding to individual
defective cells or group of cells. For such so-called regions of interest (ROIs) assigned to hot
spot areas, the resultant increase of the operating temperatures was quantified in a fast
and fairly accurate way.
As more and more PV plants are installed and the existing PV modules age further (and,
thus, more faults evolve) there has been increased scientific interest in this research field
through the last ten years. This is added by the fact that IRT measurement equipment is
more readily available for PV inspection applications, in terms of cost and usability.
Recent studies focused not only on improving the already developed concepts, but also on:
 ● Better understanding of the degradation/ageing mechanisms and their impact on
 the thermal behaviour of PV modules.
 ● Classification of different fault types by correlating their thermal signature with the
 I-V characteristics.
 ● Implementation of wide-areas measurement applications of IRT for large-scale PV
 plants.
 ● Eliminating sources of measurement errors or uncertainties; understanding all
 characteristics of IRT measurements and developing standards and technical
 specifications).

Further experimental data and preliminary analysis techniques were added during recent
studies [21], [22], [23], validating and/or improving already suggested concepts. In [21] IRT
was proved to be a fitting way for fast detection of invisible defects that were
experimentally investigated in their first stages of development. Such an early detection of
occurring faults allows the time needed for assessing the risk of potential domino effects
from the evolving defects to adjacent parts of the installations and, thus, for adopting
preventive maintenance actions and planning for the whole PV installation. On the other
hand, in [22], [23], the use of basic thermal image analysis tools, such as temperature line
 19
profile and histogram-based statistical analysis of ROI, applied to both outdoor and indoor
IRT measurements, were proved easily-implementable and efficient tools for qualitative
analysis of hot spots under short-circuit conditions.
In particular, the thermal signatures of potential faults, such as hot spots, can be observed
as bi- or multi-modal formed histograms, thus characterized by higher variance, standard
deviation and skew values. Besides, line profiles have been proved useful to yield the
temperature fluctuation across the abnormal thermal signatures of planar defects in PV
module (Figure 2-1). Such simple techniques provide complementary qualitative
information about the thermal signature of occurring faults in PV modules, which can be
valuable for thermal modelling and classification of different failure modes in PV modules.

Figure 2-1: Example of a simple analysis based on temperature line profiles of ROIs
corresponding to hot spots in a PV module under short circuit conditions.

Experimental results and observations presented in several recent studies focused on the
need for better understanding of the degradation/ageing mechanisms and their
interrelation with the resultant thermal signatures of PV modules, obtained by field IRT
measurements. The degradation/ageing impact on the thermal signature can be
investigated following either real-time exposure to field conditions [24], [25], [26] or
accelerated-time ageing in an environmental chamber (e.g. thermal cycling) [26], [27].
Particularly, in [24], an IRT analysis was performed to study the degradation mechanisms
in a 2 kWp c-Si PV installation after 12 years of exposure. One of the most significant
findings following their analysis was the fact that all solar cells located close to the junction
boxes typically feature operating temperatures about 3°C higher than the rest ones in the
same cell matrix. Consequently, it can be assumed that the thermal degradation of these
cells evolves at a higher rate. Besides, string-to-string mismatches were also observed in
several modules with the help of IRT imaging. Surprisingly, despite the higher operating
temperatures of some cells, no visible defects were observed, while modules with visible
hot spot damage showed no abnormal thermal signatures. For such observations it was
assumed that once the rupture of the cell occurs, the shunt resistance becomes sufficiently
low for the temperature to increase significantly. Moreover, IRT observations of aged PV
modules, after longer field exposure periods (18-22 years), were made in [25], [26]. IR
thermography was proved an effective and reliable tool for diagnosis of occurring and
propagating defects, particularly revealing the existence of hot cells, hot spots on the

 20
busbars, and optical degradation in the form of colder bubbles (delamination). Accelerated
ageing tests, by thermal cycling, were attempted in [27], in order to study the propagation
of existing hot spots and the evolution of abnormal thermal signatures, through the
module’s lifetime. The IRT imaging results of this study might be assumed surprising, since
the initial temperature differences (corresponding to hot spot areas) were decreased. It
was concluded that such observations could be explained as a result of the expansion of
the dissipated heat to the defective areas and the allocation of such areas to the whole
surface of each defective module.
The classification of different fault types by correlating their thermal signature with the I-V
characteristics is of utmost importance for assessing the expected power output losses and
scheduling the needed maintenance actions to prevent further failure or even safety risks
for the PV system. [28] proposed hot spot evaluation procedures and well defined
acceptance/rejection criteria, on the basis of several observations (among them IRT
inspections) of 200 field exposed and defective modules. These evaluation procedures
address both the lifetime and the operational efficiency of the modules.
[29] presented an IRT-based temperature distribution analysis to analyse three different
categories of faults in PV modules. The proposed methodology, which was validated by
both simulation and experimental test results, was proved to be effective in establishing
parameter-based electrical/thermal models and developing an optimized global maximum
power point tracking (MPPT) algorithm. In their extensive experimental work, [14], [30],
investigated numerous c-Si PV modules from 16 different PV plants with a range of field
exposure times. The evaluated data from IRT measurements, together with electrical
characterization and electroluminescence imaging, manifested various failure
mechanisms, such as cell fracture, deficient solder joints, short-circuited cells and bypassed
substrings. The impact of these frequently detected defects on the resulting temperature
was discussed and differing defects could be diagnosed by characteristic temperature
differences. Such different thermal “patterns” were then correlated with the current
voltage (I-V) characteristics at STC, and the resultant power output losses. In both of these
two studies, the high reliability and usefulness of IRT mapping for PV plants for fault
classification, were the main conclusion.
Advances in the field of fault analysis and characterization for installed PV modules, based
on IRT imaging, were recently reported in [31], [32]. The influence, in particular, of differing
ambient conditions on the characteristics and the temperature profile of defects in PV
modules is studied in [31]. All investigated faults were distinguished by the authors as three
different types; areal/planar defects, cell defects (e.g. cell fracture and shunted cells) where
an individual cell is heated up, and point-shaped defects which are considered much
smaller (e.g. solder joints).
Finite element analysis (FEM) and experimental measurements were evaluated. As a result
areal cell defects behave linearly with the solar irradiance, while the temperature
development in point-shaped defects exhibits a less predictable behaviour due to the glass
cell temperature difference, the limited resolution and possible material changes.
The demonstrated reliability and effectiveness of IRT imaging also encourages the
implementation of wide area measurements (WAMs) for large-scale PV plants, by means
of aerial IRT [33], [34], [35], [36], [37], [38]. The general potential of aerial thermographic
inspections for operating PV installations are briefly addressed in [34]. In early though

 21
significant steps of such large-scale applications, in [35], an experimental set-up was
implemented, based on a remote-controlled drone, to investigate 60 different PV plants of
up to 1 MWp. With the proposed set-up, the performed aerial IRT inspections had a typical
duration (net flight time) ranging from just few minutes to up to 1 hour, depending on the
size of the PV plant. As it was concluded in the same paper, defects like disconnected
strings, substrings, shunted cells, faulty soldering and cell fracture could be visualized and
distinguished. Moreover, the impact of such faults was further studied and understood by
means of electrical simulations. Furthermore, in [36], a novel concept was proposed for
monitoring PV plants by using light unmanned aerial vehicles (UAVs) or systems (UASs)
during their operation and maintenance, providing additional experience and solutions in
the field of large-scale IRT.
More recently, in [33], the preliminary results of an ongoing study were presented on an
application for detection, diagnosis and classification of faults in large-scale PV plants, by
means of both aerial IRT mapping and auxiliary diagnosis/characterization on the ground
(i.e. IRT, I-V characterization and EL). The developed IRT mapping technique was proven to
be efficient though practically limited to provide diagnosis only in qualitative terms and for
small-scale plants. As the authors noticed, the advantage of large-scale applicability of
aerial IRT, should be evidently exploited in a more efficient way. This can be achieved by
implementing less complex qualitative diagnosis and by quantifying the radiometric data
of each fault’s thermal signature in terms of the electrical power output loss of the
impacted module. On the basis of this “strategy”, a novel methodology of both qualitative
and quantitative fault diagnosis for PV plants is under development by the authors.
Towards the same research direction, in the field of UAV-based IRT mapping of PV plants,
another two in-progress studies were also recently published [37], [38]. In the study of [37],
several diagnosed faults in a PV plant of more than ten thousand modules, were
quantitatively correlated with the generated currents of the associated strings, by means
of aerial IRT imaging and monitoring data respectively. The correlation analyses indicated
that one or more inactive submodules as well as severe cell defects with significant ΔΤ
(>15οC) strongly correlate with a reduced current in the associated modules’ string. In the
same study, the authors also attempted a preliminary techno-economic analysis in order
to quantify the impact of such diagnosed module defects, in terms of energy yield and
consequential financial losses, which could be balanced or even avoided by proper
inspection/maintenance. As a general conclusion, coming out from all these preliminary
studies and results, within such recently opened research field, the strategy of utilizing
thermographic UAVs can be a cost-effective and much less time-consuming option for fault
diagnosis of large-scale PV plants.
Considering that IRT is a relatively new method, especially for fault diagnosis of PV
modules, the need of reliable measurements and accurate interpretation of the inspected
thermal signatures becomes increasingly important, especially when dealing with large-
scale PV plants and, thus, high PV investments. A missed fault diagnosis, either as non-
detected fault or as “false alarm” may lead to wrong performance assessment and
maintenance decisions. For these reasons, the upcoming international standards and
technical specifications of IRT for PV applications (IEC 60904-12, IEC 60904-14 and IEC
62446-3) should be established and followed [39]. Moreover, sources of possible
measurement uncertainties and incorrect interpretation of thermal image data should be
further investigated, as in [40], and addressed in such technical specifications. Last but not

 22
least, careful analysis and thermal image processing comprise key steps for efficient IRT-
based diagnosis, especially for large-scale measurements.

2.2 Test requirements
2.2.1 Camera requirements
There is a broad variety of different IR cameras available on the market. As to provide a
useful guidance in an appropriate selection of a specific IR camera product, we classified
typical parameters of different IR cameras. Table 2.2.1 lists the main differences for each
of the four camera classes we distinguished. No matter what camera class, a calibration
certificate is a clear prerequisite. This prerequisite is therefore included in the overview
given in Table 2.2.1 for completeness. The recalibration of the camera should be carried
out on an annual basis.
The stated temperature ranges listed in Table 2.2.1 are kept in italic letters, since these
values are not reflecting actual prerequisites of IR quality assurance services of PV
applications directly: It is clear that listed temperature ranges of up to 2000 °C are not
needed for any type of PV application. However, “Professional upper class” cameras have
highly sensitive infrared detectors to allow for parameters “Thermal Sensitivity” and
“Accuracy” to be as high as listed. In turn, this brings along this broad temperature range.
The following paragraphs briefly summarize each parameter that is relevant for IR imaging
tasks of PV systems, listed in Table 2.2.1.
Table 2.2.1: General camera requirements.

 Camera Lower class Medium class Professional class Professional
 parameter upper class

 Calibration Yes
 Certificate

 Temperature -20…+250 °C -20…+650 °C -20…+1200 °C -40…+2000 °C
 Range

 Resolution 160 x 120 320 x 240 320 x 240 640 x 480
 (Super (640 x 480) (1280 x 960)
 Resolution*)

 Thermal
Accuracy +/- 2 °C +/- 1 °C

 Focus Fix focus Manual Manual and auto

 Digital Camera - 2 Megapixels 3 Megapixels 5 Megapixels

 Adjustable 0.01…1
 Emissivity

 Voice Recording - Yes (short) Yes

 Interchangeable - Yes (telephoto Yes (telephoto, wide angle,
 Lens and wide angle) macro)

 GPS Recording - - Yes Yes

 External Wireless - - Yes Yes
 Sensor**
 Function

* Some cameras are equipped with an additional function that will increase the available
resolution by combining multiple images.
** Wireless current clamp, humidity or temperature sensor
Resolution
Pictures taken with an infrared camera have a specific resolution. Depending on the
thermal abnormality of a PV module, a higher resolution might be necessary. Higher
resolution images also allow pictures to be taken from a further distance and thus capturing
a greater number of modules per image.
Thermal Sensitivity
Infrared detectors have their intrinsic thermal sensitivity. This thermal sensitivity correlates
with temperatures differences that can be detected. This parameter therefore directly
reflects the ability of the camera to detect a particular minimum temperature difference.
Accuracy
This parameter includes all errors for the internal technical process and calculations
performed within the camera to identify the temperature value listed for each pixel in the
obtained IR images.
Focus

 24
You can also read