REVIEWED LED STRATEGY 2015 - Emalahleni Local Municipality
←
→
Page content transcription
If your browser does not render page correctly, please read the page content below
REVIEWED LED STRATEGY
                                    2015
CONTACT DETAILS HEAD OFFICE: 37 INDWE ROAD, PRIVATE BAG X1161, LADY FRERE, 5410
                       TEL: 047 878 0020, FAX: 047 878 0112
     DORDRECHT UNIT:    GREY STREET, TOWN HALL BUILDING, DORDRECHT , 5431
           TEL: 045 943 1017/ 1018 FAX: 045 943 1966INDWE UNIT:
                        40 FLETCHER STREET, INDWE, 5445
                    TEL: 045 951 1070/ 1008, FAX: 045 952 1008
                 EMAIL: MNTUYEDWAN@EMALAHLENILM.GOV.ZA,
                     WEBSITE: WWW.EMALAHLENILM.GOV.ZA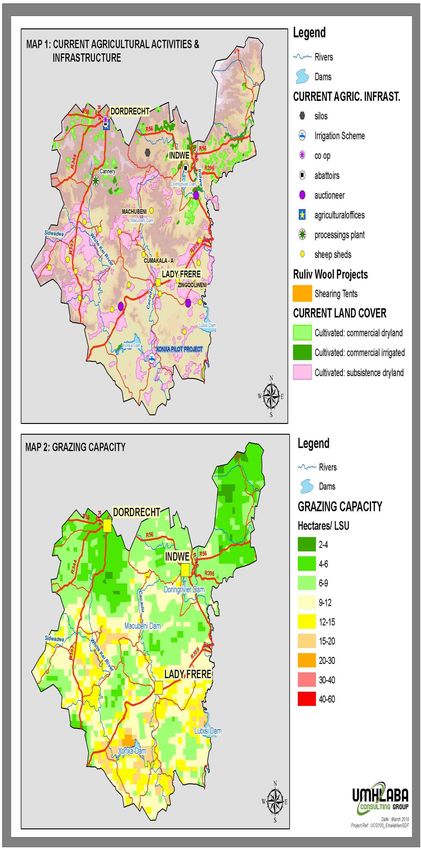
TABLE OF CONTENTS
List of Abbreviations                                            4
1. Introduction                                                  5
1.1.   Background                                                5
1.2.   Profile of the Municipality                               6
1.3.   Methodology                                               7
1.4.   Local Economic Development Context                        8
1.4.1. What is LED?                                              8
1.4.2. Stakeholder roles and responsibilities                    10
1.4.2.1.   Role of government                                    11
1.4.2.2.   Role of community                                     12
1.4.2.3.   Role of private sector                                13
1.4.3. Guiding Principles                                        14
1.5.   Strategy Outline                                          16
2. Situational Analysis                                          17
2.1.   The physical context for LED                              18
2.1.1. Key towns / nodal areas around Emalahleni                 19
2.1.2. Emalahleni Municipality Infrastructure                    21
2.1.3. Natural Resources in Emalahleni Local Municipality        26
2.2.   The Enabling Environment for Local Economic Development   26
2.2.1. Institutional Facilitation of LED                         26
2.2.2. Government Institutions and Parastatals                   27
2.3. Demographic Profile in ELM                                  31
2.3.1. Population                                                31
2.3.2. Education and Skills                                      34
2.3.3. Human Development Index                                   34
2.4. Employment in ELM                                           35
2.4.1. Informal Sector                                           36
2.4.2. Unemployment Rate                                         36
2.4.3. Poverty                                                   37
2.4.4. Poverty rate                                              37
2.4.5. Human Settlements                                         38
2.5. Status Quo of the Local Economy at Emalahleni               38
2.5.1. Economic Profile                                          38
2.5.2. Emalahleni’s Contribution to National Economy             38
2.5.2.1. Imports and Exports                                     38
2|Page
2.5.2.2. Economic Output                                39
2.5.2.3. Contribution to VAT                            39
2.6. Gross Value Added                                  39
2.7. An Emalahleni Economic Overview                    42
2.7.1. Economic Sector Analysis                         42
2.8. Legislative and Policy Context for LED             54
2.8.1. National Policies, Plans and Legislations        54
2.8.2. Provincial Policies and Plans                    55
2.8.3. Intra-Municipal Plans, Policies and Strategies   55
3. SWOT Analysis                                        57
3.1. Institutional SWOT Analysis                        57
3.2. Directorate SWOT Analysis Per Priority Area        65
4. LED Strategy Framework                               69
4.1. Objectives                                         70
4.1.1. Objective 1                                      70
4.1.2. Objective 2                                      72
4.1.3. Objective 3                                      73
4.1.4. Objective 4                                      73
5. Action Plan                                          75
6. Risks                                                84
7. Risk Mitigation Strategies                           85
Conclusion                                              85
Reference list                                          86

3|Page
LIST OF ABBREVIATIONS

ARC          Agricultural Research Council
ARDA         Agrarian Research and Development Agency
BBBEE        Broad Based Black Economic Empowerment Act
BEE          Black Economic Empowerment
CHDM         Chris Hani District Municipality
DEDEAT       Department of Economic Development, Environmental affairs and Tourism
DRDLR        Department of Rural Development and Land Reform
DRDAR        Department of Rural Development and Agrarian Reform
ECDC         Eastern Cape Development Corporation
ECRDA        Eastern Cape Rural Development Agency
ECPTA        Eastern Cape Tourism and Parks Agency
GDP          Gross Domestic Product
GIS          Geography Information System
GVA          Gross Value Add
IDC          Industrial Development Corporation
IDP          Integrate Development Plan
SDBIP        Service delivery and Implementation Plan
LED          Local Economic Development
ELM          Emalahleni Local Municipalities
LTO          Local Tourism Organisation
NDP          National Development Plan
PGDP         Provincial Growth and Development Plan
PPP          Public Private Partnerships
SME          Small Enterprise Development
CHCDC        Chris Hani Cooperative Development Centre
CHDA         Chris Hani Development Agency
IAP          Investment Attraction Plan
EDTA         Economic Development, Tourism and Agriculture
DSD          Department of Social Development
DTI          Department of Trade and Industry
AG           Auditor General
GTZ          Gesellschaft fur Technical Zusammenarbeit
ILO          International Labour Organisation
ECPTA        Eastern Cape Parks and Tourism Agency
IQ           Indwe Quarries

4|Page
1. INTRODUCTION

1.1.   Background

The current LED strategy of the municipality was first developed in 2009, and was approved
by the Council in 12 December 2010. This was the first strategy since the establishment of
the wall to wall municipality. It was then developed in order to guide the economic
development of the municipality and fulfil legislative requirements which are, Constitution of
the Republic of South Africa Act No 108 of 1996 (objects of Local Government Section 152).
The statistics that was used in the current LED Strategy (2010-2015) was taken from Global
Insight which is a private company that is not recommended by government; therefore this
statistics did not show an accredited reflection of the demographic profile of the Emalahleni
Local Municipality.

The Local Economic Development Strategy was supposed to be guided by the Spatial
Development Framework, but it was concluded before the Spatial Development Framework
was developed. There was an omission of Mining Sector and infrastructure needs in the
strategy, the role of economic stakeholders, their contribution and influence was not clear.

A lot has changed in the municipality since the adoption of the current strategy and
therefore necessitated a review since it was adopted for a 5 year period. The analysis in the
current review uses information that has been freshly sourced from Statistics South Africa
2011 which is an accredited source of information in Government.

Due to unresponsive funding model for the realization of the programmes in the current
strategy, it failed to attract resources for its implementation. The review of the strategy
suggests various sources and resource combinations to be mobilized for the realization of
the pronounced strategic intent, for example LED Programmes.
In order to foster high level buy-in and funding support by critical stakeholders (Sector
departments, and Private Investors) the review also suggests mechanisms for distribution of
roles and responsibilities among expected implementing agencies for the successful
delivery of the reviewed LED strategy. The review proposes that the municipality takes
strategic decisions on key driving sectors of the local economy that council must invest
heavily on and also identifies other sectors where the municipal role will be to facilitate
participation by other role players.

LED Strategy is aimed at providing a framework for municipal interventions and planning for
sustainable economic development in the municipal jurisdiction. This also serves to
encourage community involvement and ensure maximum participation in the municipal
affairs.

5|Page
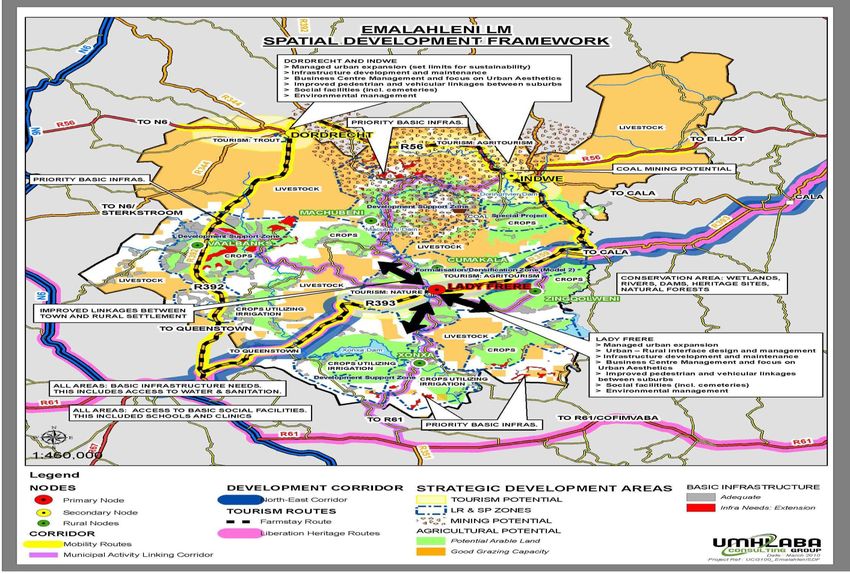
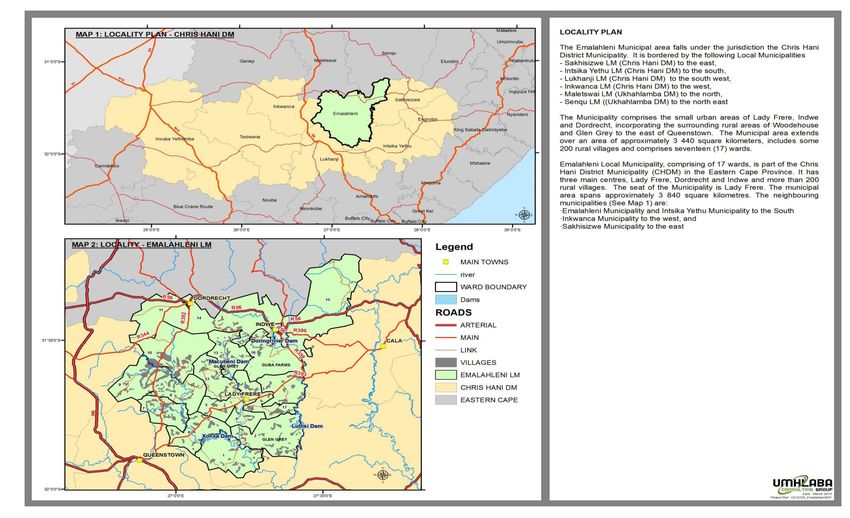
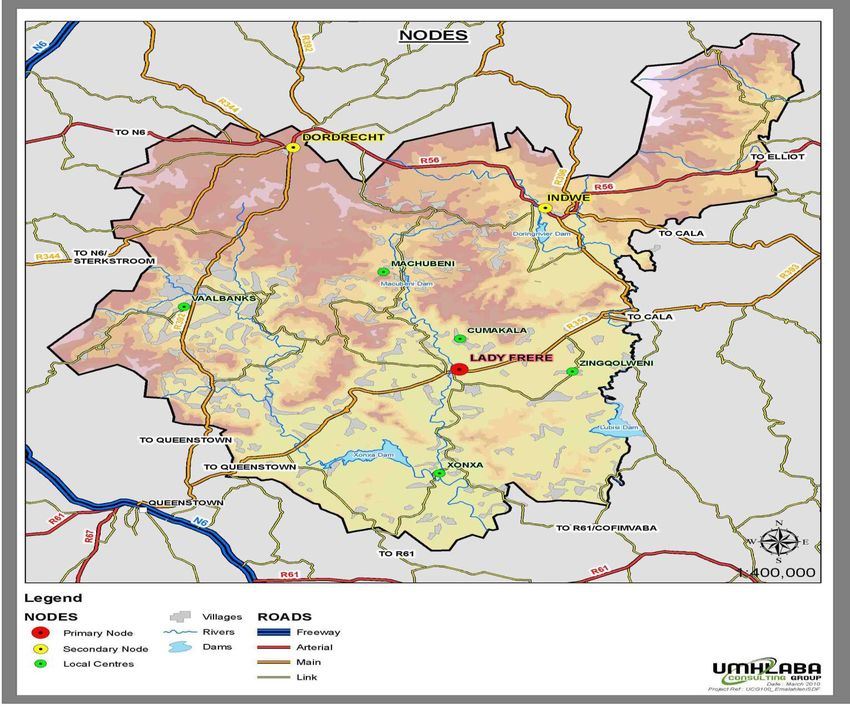
1.2.   Profile of the Municipality

   Emalahleni is a category B municipality situated within the Chris Hani District (see figure below)
   of the Eastern Cape Province. It consists of the three main urban nodes being the towns of
   Lady Frere, Indwe and Dordrecht surrounded by a large rural settlement s and many
   surrounding villages.

6|Page
1.3. METHODOLOGY
Methodologies used in the review include:
Consultation: Local Economic Development Sectors were engaged.
Mentoring: The review was conducted with extensive interaction between relevant
municipal and LED officials. This ensured transfer of skills, ownership of the LED
strategy with guidance from Centre for Municipal Research and Advise (CMRA).
Action Plan: it was developed for the key LED Projects identified in the reviewed LED
Strategy. This action includes timeframes and responsibility allocation.
The activities in the LED Strategy review are shown in the diagram below:
LED Strategy Review Process
Strategic
Document
Planning Direction
Review
Review
Outcome:
Meeting Stakeholder
Report Consultation
Review Strategy
Project
Implementati Review
Prioritization
on Plan
Outcome: Reviewed LED Strategy
and Implementation Plan
7|Page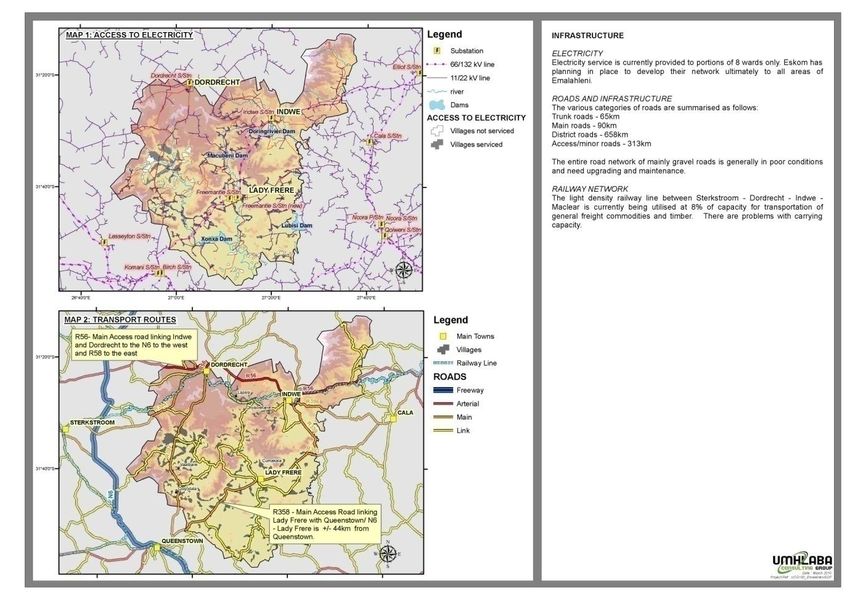
1.4.   LOCAL ECONOMIC DEVELOPMENT CONTEXT

The purpose of this section of the strategy is to provide an overview of ‘what LED is’, as well
as the roles and responsibilities of the various stakeholders in LED planning and
implementation.

 1.4.1. WHAT IS LED?

The purpose of LED is to build up the economic capacity of a local area to improve its economic
future and the quality of life for all. It is a process by which public, business and non-
governmental sector partners work collectively to create better conditions for economic growth
and employment generation (World Bank). According to GTZ LED is an ongoing process by
which key stakeholders and institutions from all spheres of society, the public and private sector
as well as civil society, work jointly to create a unique advantage for the locality and its firms,
tackle market failures, remove bureaucratic obstacles for local businesses and strengthen the
competitiveness of local firms.

ILO defines LED as a participatory process which encourages social dialogue and public-private
partnerships. It enables local stakeholders to jointly design and implement a development
strategy which fully exploits local resources and capacities, and makes best use of the area's
comparative advantages.

Mohr, Fourie and Associates (2015) define Economic Growth as an annual rate of increase in
the total production or income of the economy”. A positive economic growth is measured when
the economy is above the population growth. “Economic Development: It is reduction of
unemployment, poverty and inequality in the growing economy”. According to Economic
Development National, LED was originally a term that referred to deliberate intervention to
promote economic development in a specific area that is not the national area. The district views
LED as the tool to maximise the economic value, job creation, potential of the district through a
focus on the strengthening of the comparative advantages of priority sectors and creating a
distinctive competitive advantage.

Given the above definitions the municipality defines its Local Economic Development as
reduction of unemployment, poverty and inequality in the growing economy of the locality, as the
Municipality’s vision is about delivering appropriate, sustainable and affordable services towards
socio-economic growth for the development of its community.

   a) The National LED Context

The National Framework for LED in South Africa has been developed as a guide that seeks to
advance an understanding of LED and has put forward a strategic implementation approach that
municipalities, provinces, national government, state-owned enterprises and communities may
concentrate on in order to improve local economic development. This Framework also seeks to
guide the implementation of the LED Key Performance Indicator of the back to basics through the
suggested actions.

8|Page
Of the priority sectors in the developed economy which were identified: tourism, call centres and
Business Process Outsourcing (BPO), bio-fuels, downstream mineral beneficiation, agricultural
and agrarian reform and information communication technology (ICT) some of which are relevant
at Emalahleni. The economies of the poor, crafts, fresh produce, waste, street trading, Small
Medium and Micro Enterprise (SMMEs) support and the Expanded Public Works Programme
(EPWP) are all critical to local economic development.

   b) Provincial LED Context

The economy of the municipality cannot be discussed outside of the economic imperatives of the
Eastern Cape and more particularly the economies of the Chris Hani area. The municipality’s LED
Strategy will be interfaced with the economic thrusts defined by the Province. Provincial
Government has constitutional obligation to align LED initiatives with National and Local Priorities,
strengthen and support the capacity of Local Government, make available financial and technical
resources to implement and sustain LED, share information regularly (Provincial Economic
Trends, land use, investment and new developments) with municipalities, monitor and evaluate
the impact of LED initiatives Provincially.

   c) District Context

The philosophy underpinning the basic understanding in the jurisdiction of CHDM in relation to the
economic trajectory of the District is that of “positioning the region in such a way it maximizes the
economic potentials offered by its natural endowments and making choices about where to
allocate scarce resources to ensure maximum impact so that the region gets the best possible
economic leverage to achieve its socio economic objectives”

Based on this understanding, the economic development vision and strategic intent of the District
is determined as follows:

CHDM Economic Development Vision

The District grows and develops through social partnerships so that all people benefit from the
economy and have equitable access to social services

Regional Economic Strategic Intent

Maximize the economic value and job creation potential of the District through a focus on the
strengthening of the comparative advantages of priority sectors and creating a distinctive
competitive advantage in the timber and livestock production and processing sectors

Strategic Differentiation

Regional Economic Strategic Intent

Maximize the economic value and job creation potential of the District through a focus on the
strengthening of the comparative advantages of priority sectors and creating a distinctive
competitive advantage in timber and livestock production and processing sectors.

9|Page
d) Municipal Context
The municipality’s economy does not operate in a vacuum; it is affected and influenced by
changes in the provincial, national and global stage. It is therefore important to set the local
economic development strategy within the framework of national and more particularly the
provincial policies and legislation. In terms of past national trends municipality supplied national
mining with scores of migrant labour. When the mining sector started to show signs of decline
many migrant labours lost their jobs and had to return to their areas of origin or birth.
The following are the key sectors that the municipality will be focusing its attention to, in
developing and making a sustainable economic environment:
Agriculture and Agro-processing
Trade, Retail and wholesale
Informal sector (street trading)
Mining (Coal and Small Scale: Sand Mining and Brick Makers)
Tourism and Heritage Management (Arts and Craft)
Forestry
1.4.2. STAKEHOLDER ROLES AND RESPONSIBILITIES IN LED
The promotion of economic growth and development is an integrated effort for all key
stakeholders in the local community. This means that all key stakeholders in a municipal area
must work together to tackle challenges, find ways to ensure the provision of services in a
sustainable manner in order to create conducive environment for the creation of job
opportunities. This is shown in the diagram below.
Private Sector
Integration
Community
Government
10 | P a g eThese stakeholders should not only be the end beneficiaries of LED interventions. They must be
involved in;
Planning for LED
Implementation of LED
Monitoring and Evaluation of LED
The primary stakeholders and their roles are as follows:
1.4.2.1. Role of Government
Government officials and politicians have a combination of roles to play, including the roles of
manager / co-coordinator, facilitator, investor, representative and regulator. The focus will be on
the responsibilities of local government. However, as stated earlier, the local economy is
inextricably linked to the district, provincial and national economies. The district has a role to
play in respect to coordination between surrounding areas, facilitation of sector strategies and
investment in district-wide initiatives. Province and national have a role as regulator, investor
and coordinator. Local government must play all the various roles in partnership with the district
and province, the remainder of this section focuses on the role of local government.
a) Manager and coordinator
In this role, local government is the implementer or responsible authority;
Policy formulation and leadership of integrated local economic development planning;
Collation and interpretation of economic intelligence;
Identification of infrastructure needs;
Management of national and provincial government mandates and interventions;
Facilities management;
b) Facilitator
In this role, local government improves the environment and services, and facilitates
outside expertise and resources to meet needs.
Dissemination of information;
Creating a conducive and enabling business environment and culture;
Infrastructure provision;
Support of the informal sector and SMMEs;
Facilitation of development funding;
Process facilitator.
c) Investor
Government is a major investor and can use its resources to drive and stimulate the local
economy. Below is a list of investment vehicles. Some are funded via the province, with
the Municipality acting only as an agent, while others involve the direct resources of local
government.
Procurement policy;
Use of state assets (province and local);
Infrastructure investment (province and local);
Housing investment (agency function for province);
Land use planning;
Environmental regulation (province and local).
11 | P a g ed) Regulator
Government is responsible for policy, and as such is a regulator and enforcer and need to
ensure that this role supports rather than constrains economic development. Here issues
of environmental management, zoning, licensing, by-laws and municipal policy and
enforcement are all important.
e) Representative
This is usually the role undertaken by elected representatives within local government.
Understanding citizen’s needs and communicating these to the administration
Monitoring delivery and performance against the agreed plan.
1.4.2.2. Role of Community
They are buying, selling, building, saving and investing lie at the heart of community
organization, culture and identity. To ignore the community voice in an LED process would
be to miss a fundamental constituency.
a) Labour
Organized labour is an important stakeholder in the implementation of LED initiatives and
programmes. Increasing the number of jobs is a key objective of LED. Job seekers as well
as those already employed must be consulted in the LED process. Labour represents the
backbone of the economy. Workers have a role as productive human capital, as
consumers and as political interest groups.
As labour representatives the mandate is to:
Understand workers’ needs and communicate these to the management through
lobbying consultation, negotiations and bargaining
Monitor delivery and performance against the agreed plan.
b) Consumers / investors
Without consumption the local economy would not grow at an acceptable level. By
choosing where to spend their money, on what products and on what suppliers,
communities invest in the local economy daily. Recognizing their power is an
important part of LED.
c) Stimulators / entrepreneurs
Communities stimulate business creation or expansion through:
Identification and support for markets
Partnerships
Non-profit organisations identify gaps and areas of need in communities and the
design and development of programmes to address these needs
d) Facilitator
Non-profit organisations facilitate outside expertise and resources to meet needs
through:
Dissemination of information
Support for targeted groups
Facilitation of development funding
Facilitation of partnerships between different stakeholders to address a need or deliver a
project
Process facilitator.
12 | P a g ee) Investor
Non-profit organisations are a significant resource in a community. The commitment and
passion of members along with the funds raised can be used to drive and stimulate
aspects of the local economy. This role is at times shared with the public sector,
parastatals, communities and the private sector who choose to become partners in the
development of a project, area or target group.
1.4.2.3. Role of Private Sector
While the role of business in LED is widely acknowledged, there is a tendency only to focus
on big business and the formal sector. The informal sector also has an important role to play
as investor and entrepreneur. Roles cross the formal and informal divide.
a) Investor
The private sector is a major investor. Its resources drive and stimulate the local economy,
both spatially and sectorally. This role is at times shared with donors or parastatals, which
provide capital to the public or private sectors and become a partner in the development of
the area.
b) Stimulator / entrepreneur:
In this role the private sector undertakes the following:
Promotion of particular sectors or areas that could be sustained by the market in the
long term, for example, the development of business infrastructure to attract business
in a situation where the market (consumer or skills) exists, or the development of
specialist skills, for example in specialised agriculture, or the mobilisation of a sector
on the understanding that organised business is better able to engage government
than fragmented and disparate individuals and firms.
13 | P a g e1.4.3. GUIDING PRINCIPLES
The following principles will guide economic development at municipality;
a) Balanced Development
The development of the local economy will ensure that the uniqueness of the local
environment is protected. Balanced development also means that at tough times
choices will need to be made and environmental, social and economic needs will
have to be balanced to ensure that local economic development actions benefit all
residents of the municipal area.
b) Diverse Economy
The municipality has the following key economic sectors: tourism; agriculture and
agro-processing; construction services, retail and manufacturing. The development of
the local economy will ensure that diversity recognises the uniqueness and assets of
the local economy. This offers a greater resilience and ability to respond to
unforeseen events and external shocks.
c) Inclusiveness
Consultations with communities have created a very strong need for an inclusive
approach to local economic development. The principle of inclusiveness means
optimising the rainbow community, uniqueness and connectivity of the various
stakeholders and the need to develop a united community.
d) Partnerships
It is by working together through partnerships and by having a common vision that
sustained economic development will be achieved. The key to success is in
mobilizing the municipal community resources and assets to achieve a common goal.
This guiding principle ensures that in all actions and programmes (municipality,
business, communities and non–governmental organizations) the municipality
creates partnerships and ensures integration of activities wherever possible.
This approach also entails the development of appropriate structures to ensure that
such partnerships are developed and effective.
e) Sustainability
Sustainability requires the use of municipal assets and resources in a manner that
maintains them for future generations. Sustainability planning also ensures that
projects and programmes that have been identified are able to sustain themselves
and generate the required economic spin-offs that in the long run benefit the local
economy.
f) Quality
Underpinning all the economic development work will be a commitment to quality.
Commitment to quality means ensuring that resources and assets are deployed in a
14 | P a g emanner that increases the value for money, by contributing towards the improvement
in the quality of life of all the people of the municipality. This principle too ensures that
a thorough assessment is undertaken of each opportunity identified, and value for
money and effort is enhanced.
g) Innovation and Human Development
The sustained growth and development of the municipal economy will depend on the
extent to which local communities, business and government are able to innovate
and develop the capacities of the local communities to be creative. Human resource
development will form one of the key pillars to the development of the local economy.
With high levels of appropriate skills and education the possibilities for innovation and
creativity are enhanced.
15 | P a g e1.5. STRATEGY OUTLINE
The strategy outline:
Examines the Status Quo, in terms of spatial issues, services, the institutional
context for LED and demographics. The section also examines the current labour
market within the municipality, as well as the current economic situation.
Analyzes the current situation with a view to identifying interventions to grow the local
economy. Specifically, this is done through Strengths, Weaknesses, Opportunities
and Threats (SWOT) analysis, as well as an analysis to identify the competitive
advantages within the local economy.
Presents the Vision, Goals and Strategic Direction based on the analysis done in
preceding sections.
Presents an action plan putting forward key projects to meet the vision and goals for
LED. The purpose of this framework is to assist the municipality and its partners in
implementing LED Strategy.
16 | P a g e2. SITUATIONAL ANALYSIS
The purpose of this section of the strategy is to examine the current level of economic
development within the municipality, with specific reference to issues effecting, or being
effected by LED. Here, issues related to highlighting potential opportunities and weaknesses
within the local economy are explored, in order to assist in identifying intervention areas by
the municipality and its stakeholders. The section analyzes the following;
The physical context
The institutional context
The policy context
The demographic profile
Employment
Status quo of the local economy
Overview of the local economy
17 | P a g e2.1. PHYSICAL CONTEXT FOR LOCAL ECONOMIC DEVELOPMENT 18 | P a g e
2.1.1. KEY TOWNS/ NODAL AREAS AROUND EMALAHLENI

19 | P a g e
20 | P a g e
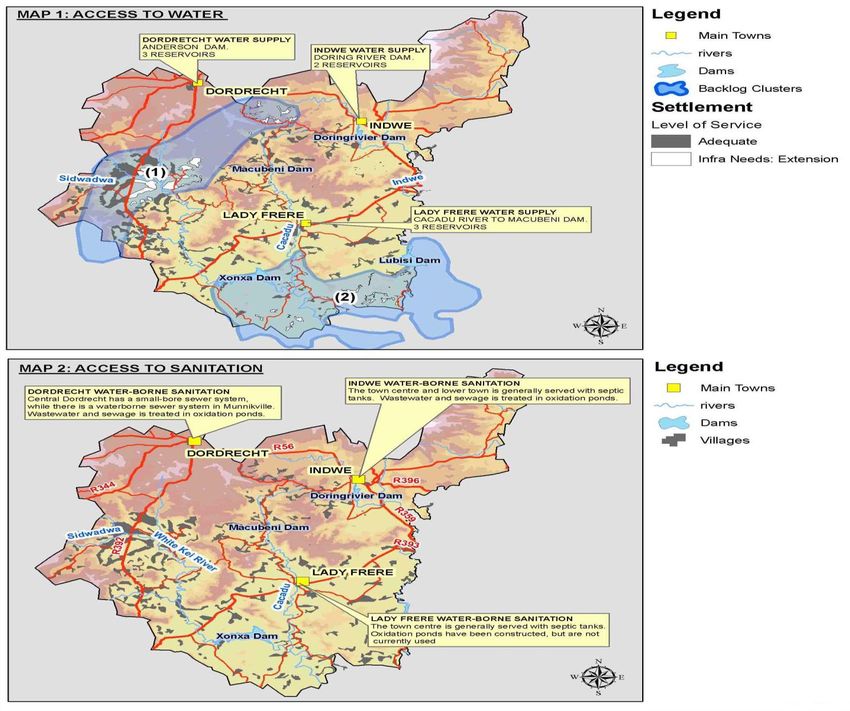
2.1.2. EMALAHLENI MUNICIPALITY INFRASTRUCTURE (BASIC SERVICE DELIVERY/ INFRASTRUCTURE INDICATORS)

21 | P a g e
a) Infrastructure Development: Indwe Water
Indwe water treatment works obtains raw water from a pumped water supply from the Doring River Dam.
The current volume of water being processed by the water treatment works has been measured at approximately 1.8Mℓ/day against a rated
capacity of 1.2Mℓ/day.

  Component               Description                                                       Condition

  Pumps                   Water is pumped from the dam to the purification works.                             Poor
                                                                   3
  Source                  Doring River Dam, Extraction – 780,000 m /year                                       Fair
                                             3
  Treatment               Capacity of 90 m /hr                                                                Poor
                                         3         3
  Reservoirs              No. 2, 2,200 m , 1,100 m                                                            Good
  Control (meters)        Metered in Town Centre, Lower Town, and some in Mavuya                              Fair

b) Infrastructure Development: Lady Frere Water

The water treatment works obtains raw water from a pumped water supply from the Machubeni Dam.
The current volume of water being processed by the water treatment works has been measured at approximately 3.5Mℓ/day (or 40ℓ/s).

  Component                Description                                                       Condition

  Pumps                    Pumping scheme from the river to the treatment works using two                      Good
                           pumps
  Source                   Cacadu River to Macubeni Dam                                                          -

  Treatment                Capacity of 40 ℓ/s                                                                   Fair

  Reservoirs               No. 3, each 600 kℓ                                                                  Good

  Control (meters)         Metered                                                                               -

  22 | P a g e
c) Infrastructure Development: Dordrecht Water Dordrecht water treatment works receives raw water through a pumped system from the Anderson and Munnik Dams. Water from the treatment works gravitates through a network of domestic, commercial and institutional connections to Dordrecht town and the hospital. Some of the water is pumped to two off-site reservoirs from where it gravitates to Munniksville, Sinakho and Tyoksville villages. Component Description Condition Pumps Only from Munnik Dam, Pump rate 100m³/hr Needs refurb Source Anderson Dam by gravity, Capacity of 2.2 Mℓ +, Fair Treatment Full treatment Capacity ±2Mℓ/day Needs refurb Reservoirs No. 3, 2x 1Mℓ, and 0.6 Mℓ Good Control (meters) Metered in Dordrecht Central 23 | P a g e
24 | P a g e
25 | P a g e
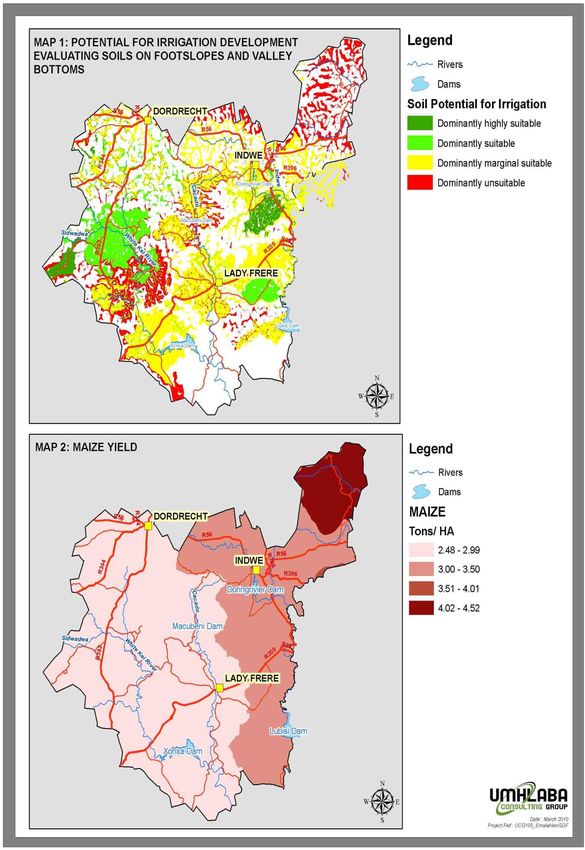
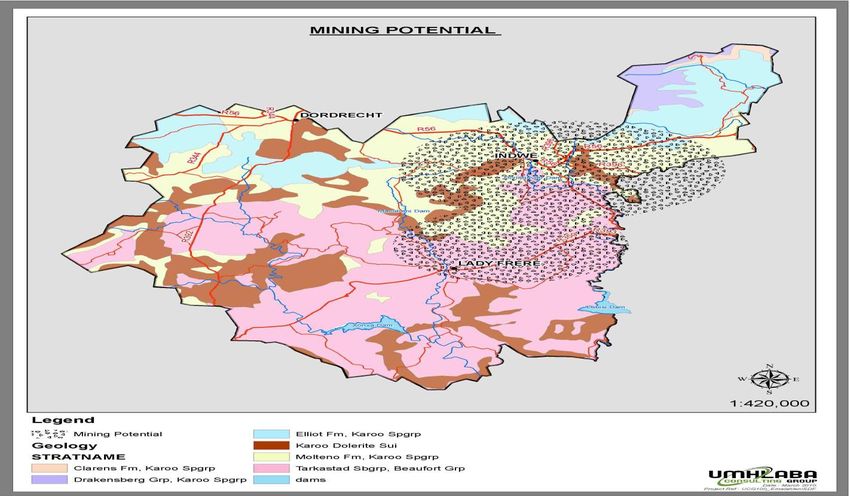
2.1.3. NATURAL RESOURCES IN EMALAHLENI LOCAL MUNICIPALITY
The available natural resources are as follows:
Coal Deposits
Sweet Veldt for livestock production
Dry land for sorghum production
Dams- Xonxa, Machubeni, Doring and Lubisi
Waterfalls- Glen Grey
Mountains- Qwempe, Zingxondo, Magxibha, Ngcwele and many others
Woodlots- Khophe, Khundulu and Longo
2.2. THE ENABLING ENVIRONMENT FOR LOCAL ECONOMIC DEVELOPMENT
The current status of the institutional context for LED within the municipality is provided below:
2.2.1. INSTITUTIONAL FACILITATION OF LED
Economic development within the municipality falls under the Directorate: Economic
Development, Tourism and Agriculture. The organogram is shown below:
Municipal Manager
Director EDTA
Administrator
LED Manager
LED Practitioner: Livestock LED Practitioner: LED Practitioner: LED Practitioner:
Production Crop Production SMME Tourism
2 X General Assistants LED Assistant
According to the Municipal organogram, the duties and responsibilities of the directorate are
as follows;
Create a conducive environment for economic development
Assisting the previously disadvantaged to be part of the main stream of economy.
Supporting small business enterprises and sourcing funding for entrepreneurs.
Retain established business in area and increasing trade.
26 | P a g e Recruit investment into area.
Create new industry (Business process outsourcing; green economic activities; sustainable
development).
Poverty alleviation and skills development.
Development of LED strategy.
Facilitation of LED projects
2.2.2. GOVERNMENT INSTITUTIONS AND PARASTATALS
The institutions that play a vital role in creating conducive environment for the local economic
development are as follows:
a) Chris Hani District Municipality
The district assists in the following:
Creating an enabling environment by developing programmes and making available
resources to support projects that will in turn be identified by local municipalities,
private sector and entrepreneurs.
Funding, Infrastructure Development, and Capacity Building
Monitor and coordinate the activities of all the partners involved in establishing and
strengthening of the LED Programmes
Source investors that will partner with business entities to ensure business
sustainability and future viability.
b) Chris Hani Development Agency
Developing catalytic value chain projects within the various corridors supported by
public and private investments;
Attract funding from the development funds and donor sources, for stimulation of job
creation programmes over the various development sectors identified in the IDP and
Corridor Development Plan
Secure a market for primary and secondary produce
Facilitating linkages between the projects and major markets
Fast track Development within the District.
c) Chris Hani Cooperative Development Centre
Provide co-operative capacity building through the provision of co-operative
governance and business management trainings
Provision of monitoring and evaluation
Assist co-operatives with compliance to legislation (co-operatives act)
Assist with development of management accounts
Assist with meeting protocols for co-operatives for development of proper Board
minutes and assist with Annual General Meetings processes.
Assist with social facilitation when the need arises
Assist with Conflict resolution when the need arises
27 | P a g ed) Corporate Government and Traditional Affairs-Eastern Cape
Capacity building in the form of human resource to incapacitated local municipalities
ensures credible integrated development planning and monitors the management of
capital funding.
e) Department of Rural Development and Agrarian Reform
Funding for primary production
Provide technical support for cooperatives
Skills development for projects
Provision of agricultural infrastructure development
f) Eastern Cape Rural Development Agency
Provision of capital for primary and secondary production infrastructure to Rural
Enterprise Development Hub (RED Hub)
Provide technical support and advice to the primary and secondary cooperative.
To provide sustained social facilitation for the purpose of capacity building,
economic spin offs of the programme and its general impact to society
To identify and rally other partners in support of Rural Economic Growth; and
Lobby lucrative markets for rural produce
g) Department of Rural Development and Land Reform
Avail land for commercial farming, development and spatial structuring
Provision of start-up capital for communal farming community
Provision of agriculture infrastructure
h) Department of Economic Development and Environmental Affairs and Tourism
Capacity building and information dissemination,
start-up capital and top-up funding
Ensure compliance in business operations
Prevention of environmental degradation
Tourism development
Fund administration and capacity building for developing business through Eastern Cape
Development Cooperation
i) Department of Social Development
Forms an important part of government strategy to fight triple challenge of poverty,
inequality and unemployment
Empowering young and old people, those with disabilities as well as women in particular,
helps rebuild families and communities.
House hold profiling
Social facilitation and funding
28 | P a g ej) Department of Trade and Industry
Working capital for bigger businesses and production inputs
Capacity building for foreign markets
Financial incentives and support for SMMEs
Non-financial support, business plan development, and capacity building through
Small Enterprise Development Agency
k) Eastern Cape Parks and Tourism Agency
To serve as a catalyst for all dimensions of tourism in the Province
To establish and maintain an efficient and effective institution
To promote the Province as a preferred tourism destination
To enhance Provincial tourism transformation
To enhance Provincial tourism product development
To facilitate infrastructure development for tourism growth
To utilise partnerships with key stakeholders successfully to achieve specific outputs
Providing appropriate, credible information on tourism in the province.
Undertaking collaborative marketing of the Province as a tourism destination
Promoting special events
Enhancing infrastructure for tourism information and marketing
l) Logo South
It is a partnership between Emalahleni Local Municipality and the municipalities in Netherlands.
The partnership aims at:
Developing communities
Training of personnel and councillors
m) Official Twinning between Dordrecht – Emalahleni / Dordrecht Netherlands
It is a bond of friendship and cooperation between the municipality of Emalahleni / Dordrecht
in South Africa and Dordrecht in the Netherlands. The cooperation aims at:
Promoting the bond between Dordrecht and Emalahleni in general and village of
Dordrecht in particular.
Organising exchanges for the purpose of strengthening the administrative, financial
and technical knowhow of Emalahleni Local government.
Forging personal relations between social, cultural, political and religious
organisations, groups and institutions in both cities especially targeted at the village of
Dordrecht in Emalahleni.
Rendering administrative and technical assistance to Emalahleni Local Municipality
Improving the economic development of Emalahleni and especially the Dordrecht
Village where possible.
29 | P a g en) Educational Institutions within the municipality or who have potential input in
Local Economic Development
Institutions at the Local level
Institution Role Projected Impact
Bengu Agricultural Agricultural Skill Development Availability of
School from Secondary to High Agricultural Technical
School Expertise
Ikhala Tertiary Business Studies Skills development in
Vocational Education Qualifications from National Business Studies
and Training (TVET) Qualification Framework from
level 2 to 4 and N 4 to 6 after
grade 12.
Institutions at the District level
Institution Role Projected Impact
Walter Sisulu Business Development Skills development in
University Qualifications from National Business Studies
Diploma and B-Tech.
Grootfontein Agricultural Skill Development Availability of
Agricultural Agricultural Technical
Development Institute Expertise
Boston City Campus Business Development Skills development in
& Business College - Qualifications Business Studies
Queenstown
Institutions at the Provincial level
Institution Role Projected Impact
University of Fort Business Development Skills development in
Hare Qualifications Business Studies
Agricultural Skill Development Availability of
Agricultural Technical
Expertise
30 | P a g eNelson Mandela Business Development Skills development in
Metropolitan Qualifications Business Studies
University Agricultural Skill Development Availability of
Agricultural Technical
Expertise
Rhodes University Business Development Skills development in
Qualifications Business Studies
Agricultural Skill Development Availability of
Agricultural Technical
Expertise
Fort Cox college Agricultural Skill Development Availability of
Agricultural Technical
Expertise
Tsolo Agricultural Agricultural Skill Development Availability of
College Agricultural Technical
Expertise
2.3. DEMOGRAPHIC PROFILE OF THE ELM
2.3.1. POPULATION SIZE, GROWTH RATE, GENDER DISTRIBUTION AND
POPULATION GROUPS
Emalahleni has the fourth largest population with a total of 119,460 (15% of the district
population) in the Chris Hani district and extends over an area of approximately 3 840 square
kilometres, includes more than 200 rural villages and comprises seventeen (17) wards. The
head office of the Emalahleni Local Municipality is situated in Lady Frere and has satellite
offices in Dordrecht and Indwe. Growth trend analysis shows that Emalahleni population had
a marginal growth of between 2% to 5% over the last 5 years. The marginal growth could be
attributed to a variety of factors such as death, poverty, HIV/AIDS and/or family planning.
The following tables and graphs reflect the population of Emalahleni by various categories.
The Black Africans and Black African females in particular are the largest group of the
population at 51% (and 53% including all races) of the total population. The high
representation of females in the population represents an opportunity for the municipality to
develop and implement programs for women empowerment.
Black African Coloured Indian or White Other Grand
Asian Total
Male 55 614 350 135 322 199 56620
Female 62058 341 39 340 61 62839
Grand 117672 691 174 663 260 119459
Total
a) Emalahleni Local Municipality 283 from Census 2011
Area: 3447.21km²
Population: 119460(34.65perkm²)
Households: 31681 (9.19 per km²)
31 | P a g eStatistics by Gender as per Census 2011
Gender People Percentage
Female 62839 52.60%
Male 56620 47.40%
The above table shows that Emalahleni Local Municipality population is mostly dominated by
females. It therefore means there is a possibility that males are outside the Emalahleni Local
Municipality in search of greener pastures and females are households.
Population by Ethnicity as per Census 2011
Population group People Percentage
Black African 117672 98.50%
Coloured 691 0.58%
White 663 0.55%
Other 260 0.22%
Indian or Asian 174 0.15%
The above table shows that Emalahleni Local Municipality ethnicity is dominated by black Africans
and the level of economic participation is revolving around primary production in a form of crop
and livestock production.
The Pie Chart below reflects the following:
Females are more than males at Emalahleni Local Municipality
There is a possibility of male migration from Emalahleni Local Municipality to other cities
in search of employment opportunities.
There is a possibility of high male death rate as compared to females
32 | P a g ePopulation by gender
Percentage of Females Percentage of Males
53% 47%
Statistics South Africa: Web page: www.statssa.gov.za, 2011
Population Pyramid
80+
75 - 79
70 - 74
65 - 69
60 - 64
55 - 59
50 - 54
45 - 49
Male
40 - 44
35 - 39 Female
30 - 34
25 - 29
20 - 24
15 - 19
10 - 14
5-9
0-4
-8.0 -6.0 -4.0 -2.0 0.0 2.0 4.0 6.0 8.0
The above pupation pyramid reflects a perfect planning informant for the municipality.
From this age distribution above, the following observations can be eluded:
the 0-19 years comprised of 47% of the total population
ages 20-59 years of the economically active population, show a fairly distributive
population
ages 60 upwards represent 13% of the population
The municipal population has a large representation of the youth (comprising of
47%) of the total population. The retired age group of age 60 and above
represents 13 percent of the population. These two above point also pose a great
33 | P a g echallenge for the Emalahleni municipality. This challenge being that the 60 percent
of the population is both under 19years and above 60years and thus most likely
economically in active and reliant on social grants. The resultant of this compels
the municipality to increase its commitment to Special Programmes
According to statistics released by ECSECC, about 47% of the population earns
just under R3500.00 and 13% of the population leaves under the bread line and
would therefore not be able to afford housing or other services and rely on state
subsidies. Emalahleni thus can be classified as a low wage economy which is a
factor of low or negative growth. This fact will be dealt with throughout the
document.
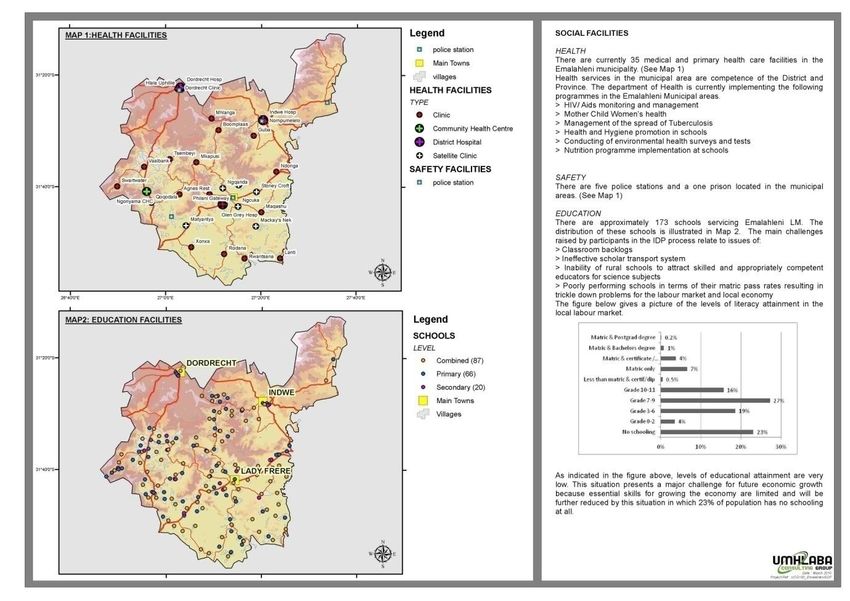
2.3.2. EDUCATION AND SKILLS
1.1 ABOUT 35% OF THE ENTIRE POPULATION HAS NO SCHOOLING WHILST ONLY 5% OF THE
POPULATION HAS A MATRIC (GRADE 12) QUALIFICATION. AS INDICATED IN GRAPH BELOW , THE
LEVELS OF EDUCATIONAL ATTAINMENT ARE VERY LOW . THIS SITUATION PRESENTS A MAJOR
CHALLENGE FOR FUTURE ECONOMIC GROWTH BECAUSE ESSENTIAL SKILLS FOR GROWING THE
ECONOMY ARE LIMITED AND WILL BE FURTHER REDUCED BY THIS SITUATION IN WHICH 35% OF
POPULATION HAS NO SCHOOLING AT ALL.
Highest Education Levels
Unspecified
Other
Honours degree
Bachelors Degree
Higher Diploma
Certificate with Grade 12 / Std 10
Certificate with less than Grade 12 / Std 10
N5 /NTC 5
NTC III /N3/ NIC/ V Level 4
NTC I / N1/ NIC/ V Level 2
Grade 11 / Std 9 / Form 4
0 2000 4000 6000 8000 10000 12000 14000 16000 18000
Source: Statistics SA 2011
2.3.3. Human Development Index (2008 – 2010)
The Human Development Index at Emalahleni Local Municipality is at Medium level on the
following areas:
Life expectancy at birth
Educational Attainment
Standard of living measured by real per capita income measured at purchasing power parity
34 | P a g eHDI
2010 2009 2008
,0.3619
Emalahleni Local Municipality ,0.3742
,0.3721
,0.4126
Chris Hani District Municipality ,0.4244
,0.4243
,0.4828
Eastern Cape ,0.4931
,0.4942
,0.5501
RSA (Total - National) ,0.5617
,0.5649
2.4. EMPLOYMENT IN ELM
Official Employment Status
53735
41449
9344 8070 6861 0
Employed Unemployed Discouraged work- Other not Age less than 15 Not applicable
seeker economically active years
Sources: Statistics SA, 2011
The current employment statistics of the municipal area released by Stats SA on
quarterly basis is as follows:
Person weighted
Employed 9345
Unemployed 8070
Total 17415
% of Person weighted
Employed 53.7
Unemployed 46.3
Total 100.0
35 | P a g eThis situation means that people are either dependent on informal sector; have their own
businesses and or coops or unemployed at all and that will have a knock on effect on socio
– economy of the area.
The GDP of Emalahleni has been anchored by the wholesale and retail sector which has
contributed a higher percentage in terms of Real Money. The wholesale and retail sector
has contributed about 80% to the Gross Domestic Product and has seen a steady growth
for the past three financial years (2008, 2009 and 2010).
2.4.1. INFORMAL SECTOR
2010
EC
2009
CHDM
ELM
2008
In
- 50,000 100,000 150,000 200,000 250,000 300,000 350,000 400,000
as
far as it relates to the informal sector, Emalahleni is still making no progress for the past three
years (2008 – 2010).
2.4.2. UNEMPLOYMENT RATE
Sakhisizwe Local Municipality
Engcobo Local Municipality
Emalahleni Local Municipality
Intsika Yethu Local Municipality 2010
Lukanji Local Municipality 2009
2008
Inkwanca Local Municipality
Tsolwana Local Municipality
Inxuba Yethemba Local Municipality
- ,10.0 ,20.0 ,30.0 ,40.0 ,50.0 ,60.0
36 | P a g eIn the district, Emalahleni Local Municipality, is leading in as far as the unemployment rate is
concerned and this has been the case since 2008 – 2010. There is a lot that needs to be
done in terms of job creation.
According to data released by Statistics South Africa for the Year 2007, 2008 and 2009
indicates that the economy of Emalahleni has been shedding jobs except for the wholesale
& retail sector which maintained a low but steady growth in terms of employment figures.
2.4.3. POVERTY
Number of People living in Poverty
2010 2009 2008
63,680
Emalahleni Local Municipality 64,298
67,575
470,212
Chris Hani District Municipality 467,037
481,897
3607,030
Eastern Cape 3559,198
3638,921
20696,500
RSA (Total - National) 20424,091
20704,873
There has been a slow decrease in a number of people living in poverty from 67,575 to 63,
680 since 2008 – 2010. This might be due to number of government interventions in terms
of social grants, or people leaving the area for greener pastures.
Due to the snail pace inwhich poverty is decreased, Government in general and Emalahleni
Local Municipality in particular, need to introduce aggresive measures that will seek to
accelerate the pace of poverty eradication and such can be encapsulated in LED strategy
and other relevant strategies.
2.4.4. POVERTY RATE (2008 – 2010)
Poverty rate
2010 2009 2008
55.9%
Emalahleni Local Municipality 55.9%
58.3%
58.1%
Chris Hani District Municipality 57.7%
59.5%
53.6%
Eastern Cape 53.2%
54.6%
42.4%
RSA (Total - National) 42.1%
42.9%
37 | P a g e2.4.5. HUMAN SETTLEMENTS
1.2 THE GRAPH BELOW SHOWS THAT MOST OF THE HOUSES IN THE MUNICIPALITY ARE THOSE MADE
OF BRICKS AND TRADITIONAL HOUSES, IT ALSO SHOWS A SLOW INCREASE FROM 2008 OF
BRICK AND TRADITIONAL HOUSES. THERE IS A VERY MINIMUM NUMBER OF INFORMAL
SETTLEMENTS AND THE NUMBERS ARE SHOWING A SLOW DECLINE SINCE 2008 AND THIS CAN
BE ATTRIBUTED TO THE INCREASE IN BRICK AND TRADITIONAL STRUCTURES.
18000
17000
16000
15000
14000
13000
12000
11000
10000
9000 Yr 2011
8000
7000 Yr 2008
6000
5000
4000
3000
2000
1000
0
Informal Dwellings Traditional Dwellings Formal Dwellings
2.5. STATUS QUO OF THE LOCAL ECONOMY AT EMALAHLENI
2.5.1. ECONOMIC PROFILE
2.5.2. EMALAHLENI’S CONTRIBUTION TO THE NATIONAL ECONOMY
The strength of a country's economy can be measured by analysing a few key indicators. These
include:
Imports and Exports
Economic Output
Contribution to Gross Value Added (Tax)
2.5.2.1. Imports and Exports
94,17% 5,83% 99,7% 0,3%
Other Prov
Eastern Cape
Chris Hani District
38 | P a g eThe total value of goods imported by South Africa in 2008 was R721 Billion. The Eastern
Cape imported 5.83% of those goods, valued at R42 Billion. The Whole of Chris Hani DM
only imported goods to the value of R130 745 968, which is 8, 3 % of the total. South
Africa exported goods to the value of R636 Billion in 2008, the contribution from Chris Hani
as a district was 0,056%
2.5.2.2. Economic Output
Other Provinces
Eastern Cape
7,44%
91,98% 0,58% 94,78% Chris Hani DM
Emalahleni LM
5,22%
The economic output of total production for 2008 was R2, 752,117m. The Eastern Cape
contributed 8% valued at R220, 734m. Emalahleni LM contributed 5, 2% to Chris Hani DM, which
in turn contributed 0, 58% that of the National output.
2.5.2.3. Contribution to VAT
Other Provinces
7,12%
0,66% Eastern Cape
92,22% 94,94%
Chris Hani
Emalahleni LM
5,06%
The total for General Value Added Tax for 2008 in South Africa was R1, 159,313m. The
Eastern Cape contributed 7, 78% valued at R90, 162m. Emalahleni LM contributed 14,45% to
Chris Hani DM, which contributed 6,486m, which is 0,66% that of the National figure.
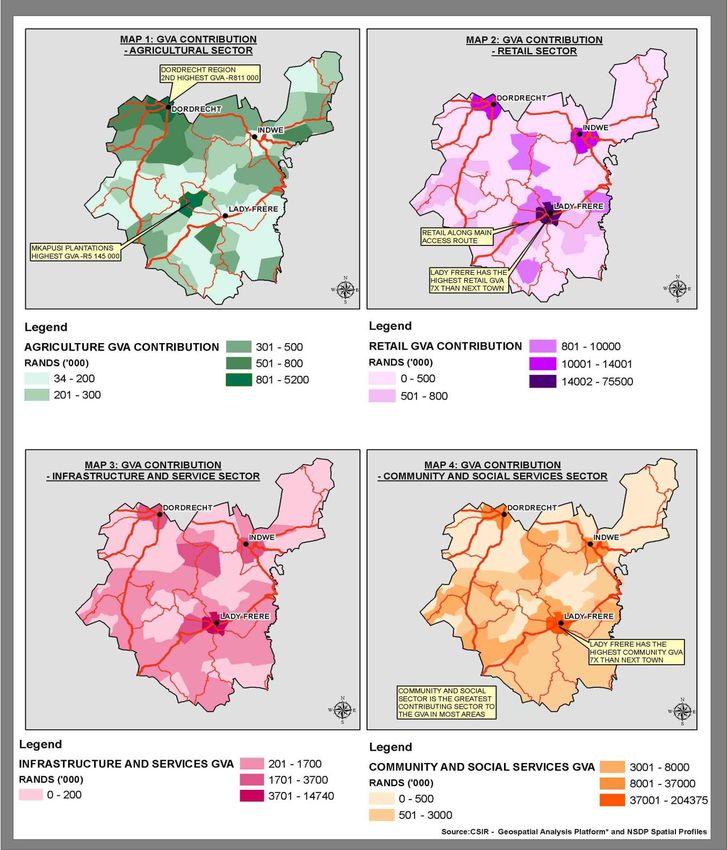
2.6. Gross Value Added
The sector contribution of each individual producer, industry or sector to the economy is
measured through Gross Value Added (GVA). Gross Value Added (GVA) by Region is the
GVA for a specific geographic area. The link between GVA and GDP can be defined as GVA
39 | P a g eplus taxes on products less subsidies on products equals GDP (GVA = GDP - taxes on
products + subsidies on products).
This is the value of the total economic contribution of each sector as listed in the legend
below. Clearly the towns of Lady Frere, Dordrecht and Indwe are the major contributors as
indicated by the size of their charts.
The Community and Social Sector is the greatest contributor to Emalahleni's GVA. This
sector contributes to more than half the Municipalities GVA. This highlights the lack of
diversity in the economy.
The primary sectors of agriculture and mining contribute to less than 5% of the formal
economy. There are opportunities for these sectors to grow.
Lady Frere is the hub of the retail, commercial and manufacturing sectors in the Municipality.
The town contributes to more than half the Municipalities GVA. This highlights the
importance of developing and maintaining infrastructure and links to the town
a) CONTRIBUTION PER SECTOR TO THE EMALAHLENI LM
GVA CONTRIBUTION PER SECTOR
4%
0%
6%
7%
AGRICULTURE
19% MINING
MANUFACTURING
RETAIL
FINANCE
COMMUNITY
7% INFRASTRUCTURE
57%
Geographic Distribution of GVA per Sector (as a %)
40 | P a g eSource: CSIR - Geospatial Analysis Platform* and NSDP Spatial Profiles
TOTAL
AREA AGR MINING MANU. RETAIL FINANCE COMM INFRA. GVA
LADY FRERE 0 100 76 62 73 56 37 56
DORDRECHT 3 0 23 10 19 10 6 11
INDWE 0 0 1 10 7 5 9 6
REST OF LM 97 0 0 18 0 29 48 27
41 | P a g e2.7. EMALAHLENI ECONOMIC OVERVIEW
Economics-Profile Implications:
On both a District and National scale, Emalahleni’s contribution to the economy is small.
Emalahleni contributes less than 1% to the National GVA.
The Lady Frere is the hub of economic activities in the Municipality.
In spite of its contribution to GVA, the community services sector is not an economic growth
sector. This is due to the fact that the products that drive this sector are not tradeable and
therefore do not result in increased economic output. As a result, they are unlikely to attract
investment and by implication, cannot be relied upon to impact on unemployment.
2.7.1. ECONOMIC SECTOR ANALYSIS
Local Economic Development
In line with the requirements of Sections 152 (1) (c) and 153 of the Constitution of the Republic of
South Africa, 1996; municipalities have a constitutional obligation to promote social and economic
development within the municipal area. The Council has structured its Council committees
according to local government key performance areas which as well consist of local economic
development. A directorate for economic development, tourism and agriculture was established
and is responsible for execution of economic development plans.
In 2010, the municipality developed and approved a 5 year local economic development strategy
to provide a strategic guidance on issues of economic development, and as well align district,
provincial and national economic development plans. The 2015/2016 financial year is last year of
the implementation plan in the current LED Strategy. The strategy warrants a review and/or
development of a new strategy which will talk to the 2016/2021 financial years, and is under
review.
The municipality has a fully-fledged directorate which is responsible for the implementation of the
LED programmes and projects. The main focus areas of the directorate are agricultural
development, mining, tourism, SMME’s (small medium micro enterprise) development, heritage
management and agro-processing.
The municipality has a functional LED Forum for purposes of consultation and engagement with
LED stakeholders on LED matters. The LED Forum has two categories; the government
[Department of Economic Development, Environmental Affairs and Tourism (DEDEAT), Chris Hani
District Municipality(CHDM), Department of Rural Development and Agrarian Reform (DRDAR),
Department of Rural Development and Land Reform (DRDLR), Chris Hani Development Agency
(CHDA), Chris Hani Cooperative Development Centre (CHCDC), Eastern Cape Rural
Development Agency (ECRDA), Eastern Cape Development Corporation (ECDC), Eastern Cape
Parks and Tourism Agency (ECPTA), Department of Trade and Industry (DTI), Department of
Social Development (DSD)] and communal business entities (brick-makers, agricultural primary
cooperatives and secondary cooperative, caterers, crafters, contractors, hawkers and B&B
owners. The forum meetings are held on a quarterly basis.
42 | P a g eThe economy of the municipality is made of the following sectors:
(a) Agriculture
Agriculture is made up of two primary production components which are as follows:
Livestock and Wool Scientific research conducted by the Agricultural Research
Production Council (ARC) in 2005, has revealed that the municipal area has
got sweet veldts, that on its own is showing that this area is rich
in livestock production despite climatic conditions, as the area is
dry in nature. According to the department of Agriculture, in the
2015 season the municipal area had at the least 270 000 to 300
000 sheep per year, 75 000 to 100 000 goats and 36 000 to
40 000 cattle. This excludes commercial farmers, as they are
not serviced by the department of Agriculture.
The municipality is in a process to improve the cattle breed in
the municipal area by introducing Nguni bulls which are an
African breed that is resilient to prevailing climatic conditions.
The municipality is adding value on livestock production by
putting in place necessary infrastructure in a form of dipping
tanks for health purposes and stock pen sales for marketing
purposes. It further puts in place measures to reduce stock theft
in the area by introducing livestock branding programme. The
Act which is regulating Livestock Branding is Livestock Branding
Act No 6 of 2002.
The municipality has the following infrastructure:
Animal health infrastructure: dipping tanks more than 100.
Most of these structures were constructed in the 1980’s
and are in a bad condition which requires renovations.
The municipality is in a process of completing 10 dipping
tanks which were started by the Chris Hani District
Municipality before 2002.
Since 2000, the DRDAR has been supplying the communal
farmers with free dipping medication to prevent external
parasites in livestock.
Stock auction infrastructure: the municipality has 11 stock
pens which are still in good condition which is utilized for
stock auction in the communal space of the municipal
area.
Wool Production infrastructure: the municipality has 74
shearing sheds for wool production; 40% of them are in a
bad condition and 60%are in a good condition. The
municipality has a huge backlog in shearing sheds and its
suitable equipment. For the municipality to reach its
maximum potential on wool production, a minimum of 100
shearing sheds is still required.
Battering system has been introduced to improve the wool
production quality in the case of sheep. The challenge that is
facing battering system is that some communal farmers are not
43 | P a g ecooperating to the requirements of the system.
Crop Production Scientific research conducted by the Agricultural Research
Council (ARC) in 2005, revealed that due to the prevailing
climatic conditions in the municipal area is now suitable for
Sorghum Production and all value addition efforts must go
towards that direction. The municipality has set a target to
plough more than 1 000 hectors from 2014 that is incremental to
35 000 hectors in 2020. The Act which is regulating this is
Agricultural Development Act No 52 of 1960. IDA is the area
that produces maize in large qualities because of climatic
conditions in that region.
The municipality is battling with fencing as the fence is easily
damaged and stolen. Currently, fencing is provided to organised
communal producers located in 08 different wards; and the
programme to educate communities on how fencing is provided
is still ongoing.
The municipality has a programme of reviving small scale
irrigation schemes with the intention to produce crop throughout
the year.
Agro-Processing The municipality has facilitated the establishment of a milling
plant owned by Ibuyambo secondary cooperative which is made
up of six primary cooperatives. Its objective is to add value to
grain produce for purposes of marketing.
44 | P a g e45 | P a g e
46 | P a g e
(b) Mining
Coal Mine
The Municipality has got coal reserve on its northeast part (Indwe, Guba A/A, Machubeni A/A and
Mhlanga A/A) which is covering more than 10 000 hectares. The mining of this coal mineral is
anticipated to have the life span of more than 30 years. The discovery of coal mineral took place
100 years ago at Strekstroom and Guba hoek. In the case of Emalahleni Local Municipality, the
mining operation was taking place in Guba Hoek area but due to the quality of the coal which is
low when it is compared with the coal mineral in Mpumalanga Province, the Emalahleni coal mine
was abandoned.

In 2006, an attempt was made by Elitheni coal mine, a company which is based in Port Elizabeth;
to reopen the mine. After all the required processes were followed, mining permit and mining
license were granted by the Department of Mineral Resource to Elitheni Coal Mine. The mine
operated in 2012, for a period of one and a half years and had to close down operations due to
technical and financial capacity to date. The municipality has engaged relevant national
government ministries to assist the municipality lobby for other investors to operate the mine.

Sand Mining

Small-scale excavation mining is occurring near local rivers with ad hoc mining of sand for building
and brick making purposes by individuals and/or operators without permit. The lack of regulation of
this activity poses an environmental threat. There is a great need for the Municipality, with the
assistance of DEDEAT and DME, to develop a functional by-law to regulate and manage this
activity to protect the environment from damage.There are a few companies that have obtained a
mining permit based on an agreement with the affected communities.
47 | P a g e
You can also read