Reviews and syntheses: Arctic fire regimes and emissions in the 21st century
←
→
Page content transcription
If your browser does not render page correctly, please read the page content below
Biogeosciences, 18, 5053–5083, 2021
https://doi.org/10.5194/bg-18-5053-2021
© Author(s) 2021. This work is distributed under
the Creative Commons Attribution 4.0 License.

Reviews and syntheses: Arctic fire regimes and
emissions in the 21st century
Jessica L. McCarty1 , Juha Aalto2,3 , Ville-Veikko Paunu4 , Steve R. Arnold5 , Sabine Eckhardt6 , Zbigniew Klimont7 ,
Justin J. Fain1 , Nikolaos Evangeliou6 , Ari Venäläinen2 , Nadezhda M. Tchebakova8 , Elena I. Parfenova8 ,
Kaarle Kupiainen9 , Amber J. Soja10,11 , Lin Huang12 , and Simon Wilson13
1 Department    of Geography and Geospatial Analysis Center, Miami University, Oxford, OH, USA
2 Weather   and Climate Change Impact Research, Finnish Meteorological Institute, Helsinki, Finland
3 Department of Geosciences and Geography, University of Helsinki, Helsinki, Finland
4 Centre for Sustainable Consumption and Production, Finnish Environment Institute (SYKE), Helsinki, Finland
5 Institute for Climate and Atmospheric Science, School of Earth and Environment,

University of Leeds, Leeds, United Kingdom
6 Department of Atmospheric and Climate Research (ATMOS), Norwegian Institute for Air Research, Kjeller, Norway
7 International Institute for Applied Systems Analysis (IIASA), Laxenburg, Austria
8 V. N. Sukachev Institute of Forests, Siberian Branch, Russian Academy of Sciences, Krasnoyarsk, Russian Federation
9 Ministry of the Environment Finland, Aleksanterinkatu 7, P.O. Box 35, 00023 Government, Helsinki, Finland
10 National Institute of Aerospace, Hampton, VA, USA
11 National Aeronautics and Space Administration (NASA) Langley Research Center, Hampton, VA, USA
12 Climate Research Division, ASTD/STB, Environment and Climate Change Canada, Toronto, Canada
13 Arctic Monitoring and Assessment Programme (AMAP) Secretariat, Tromsø, Norway

Correspondence: Jessica L. McCarty (jmccarty@miamioh.edu)

Received: 1 April 2021 – Discussion started: 8 April 2021
Revised: 7 July 2021 – Accepted: 24 August 2021 – Published: 15 September 2021

Abstract. In recent years, the pan-Arctic region has experi-      are driven by natural (i.e. lightning) and human-caused igni-
enced increasingly extreme fire seasons. Fires in the north-      tion sources, including fires caused by timber and energy ex-
ern high latitudes are driven by current and future climate       traction, prescribed burning for landscape management, and
change, lightning, fuel conditions, and human activity. In        tourism activities. Little is published in the scientific litera-
this context, conceptualizing and parameterizing current and      ture about cultural burning by Indigenous populations across
future Arctic fire regimes will be important for fire and         the pan-Arctic, and questions remain on the source of igni-
land management as well as understanding current and pre-         tions above 70◦ N in Arctic Russia. (2) Climate change is ex-
dicting future fire emissions. The objectives of this review      pected to make Arctic fires more likely by increasing the like-
were driven by policy questions identified by the Arctic          lihood of extreme fire weather, increased lightning activity,
Monitoring and Assessment Programme (AMAP) Working                and drier vegetative and ground fuel conditions. (3) To some
Group and posed to its Expert Group on Short-Lived Cli-           extent, shifting agricultural land use and forest transitions
mate Forcers. This review synthesizes current understanding       from forest–steppe to steppe, tundra to taiga, and coniferous
of the changing Arctic and boreal fire regimes, particularly as   to deciduous in a warmer climate may increase and decrease
fire activity and its response to future climate change in the    open biomass burning, depending on land use in addition
pan-Arctic have consequences for Arctic Council states aim-       to climate-driven biome shifts. However, at the country and
ing to mitigate and adapt to climate change in the north. The     landscape scales, these relationships are not well established.
conclusions from our synthesis are the following. (1) Cur-        (4) Current black carbon and PM2.5 emissions from wild-
rent and future Arctic fires, and the adjacent boreal region,     fires above 50 and 65◦ N are larger than emissions from the

Published by Copernicus Publications on behalf of the European Geosciences Union.
5054                                                J. L. McCarty et al.: Arctic fire regimes and emissions in the 21st century

anthropogenic sectors of residential combustion, transporta-         land in 2019, and the Russian Federation in 2020, mainly in
tion, and flaring. Wildfire emissions have increased from            the boreal zone, i.e. at and above 50◦ N, but with expand-
2010 to 2020, particularly above 60◦ N, with 56 % of black           ing fires into the Arctic region (Walsh et al., 2020), even
carbon emissions above 65◦ N in 2020 attributed to open              reaching as far north as the Arctic Ocean in eastern Siberia
biomass burning – indicating how extreme the 2020 wild-              (Kharuk et al., 2021). Thus, quantifying the impact of climate
fire season was and how severe future Arctic wildfire sea-           change, human ignition sources, and biophysical parameters,
sons can potentially be. (5) What works in the boreal zones          such as availability and/or distribution of aboveground fu-
to prevent and fight wildfires may not work in the Arctic.           els, permafrost thaw, and drying of peat, on increased fire
Fire management will need to adapt to a changing climate,            activity in the Arctic and boreal regions is needed to under-
economic development, the Indigenous and local communi-              stand the emerging Arctic fire regime (Krawchuk and Moritz,
ties, and fragile northern ecosystems, including permafrost          2011). Here we define an emerging fire regime in the Arctic
and peatlands. (6) Factors contributing to the uncertainty of        as documented increased frequency and lengthened seasonal-
predicting and quantifying future Arctic fire regimes include        ity (earlier springtime fires and fires later in autumn) of both
underestimation of Arctic fires by satellite systems, lack of        natural and human-caused surface and ground fires (i.e. peat)
agreement between Earth observations and official statistics,        increasing total fire emissions within the Arctic (see Table S1
and still needed refinements of location, conditions, and pre-       in the Supplement for a list of all key terms).
vious fire return intervals on peat and permafrost landscapes.          For this review paper, the definition of open biomass burn-
This review highlights that much research is needed in order         ing in the Arctic will include wildland fires (sometimes re-
to understand the local and regional impacts of the chang-           ferred to as and encompassing wildfires, forest fires, peat
ing Arctic fire regime on emissions and the global climate,          fires, and prescribed fires in natural areas) and fires in human-
ecosystems, and pan-Arctic communities.                              dominated landscapes (i.e. agricultural open burning, pre-
                                                                     scribed burning in agroforestry, timber, rangelands), with
                                                                     natural fires (lightning-caused ignitions) and human-caused
                                                                     fires differentiated where possible using reported statistics
1   Introduction                                                     and geospatial methods. Given the strong influence of boreal
                                                                     systems on the Arctic in terms of fire disturbance, emissions,
For more than a decade, climate modelling studies have pro-          and shifting vegetation, we have included boreal fire regimes
jected an “invasion” of fires to the Arctic regions (Krawchuk        in this review, while specifically identifying each climatic
et al., 2009). In this paper, we review the current understand-      zone as needed. Open biomass burning is a known distur-
ing of the changing Arctic fire regime and its impacts on fire       bance in the Arctic Council region1 (AMAP, 2011, 2015).
emissions, providing a foundation for future systemic pan-           The 2015 Arctic Monitoring and Assessment Programme
Arctic fire and fire emissions analyses and coordination in          (AMAP) assessment on black carbon (BC) and ozone as Arc-
the context of the Arctic Council members, Permanent Par-            tic climate forcers noted key characteristics of open biomass
ticipants, observers, and working groups. This review paper          burning in the Arctic region, including human influence on
is also the first to link emissions with a changing fire regime      both ignition and fuel management, significant interannual
for the pan-Arctic. Previous published reviews on fires in the       variation in fire events and emissions, spatial and seasonal
high northern latitudes have linked increasing fire activity in      clustering of burning related to active land management, and
the Arctic and the boreal regions to climate-driven warming          fuel conditions (AMAP, 2015). Since 2015, evidence of di-
and drying (Hu et al., 2015; Walsh et al., 2020). While fires        rect climate change influence on large, early season fires
in the Arctic, defined as latitudes above 66◦ N by the Arc-          has increased (Wang et al., 2017) as well as fuelling ex-
tic Monitoring and Assessment Programme (AMAP) defini-               treme wildfires at the wildland–urban interface (WUI) and
tion (AMAP, 1998), are not new (Wein, 1976), a consensus             not just remote boreal forests and Arctic tundra (Abatzoglou
of evidence suggests that tundra fires are increasing (Hu et         and Williams, 2016; Kirchmeier-Young et al., 2019). In terms
al., 2015; Masrur et al., 2018), with a potential for novel fire     of burned area, 2015 was the largest fire year for the Alaskan
regimes (Young et al., 2016). Fire regimes are often defined         tundra ecoregion (Michaelides et al., 2019).
as the main characteristics of fire activity for a given location:      Under future climate change, an overall increase in fires is
frequency, typical sizes of fires, annual burned area, severity,     expected in the Arctic Council region, indicating that associ-
seasonality, type (surface, ground, or crown fires), and igni-          1 The Arctic Council membership comprises the eight member
tion cause (human or natural) (Hanes et al., 2019).
                                                                     states: Canada, the Kingdom of Denmark, Finland, Iceland, Nor-
   Over the past 4 decades, fire activity has increased in           way, the Russian Federation, Sweden, and the United States of
Alaska and the Sakha Republic of Russia but decreased                America, as well as six Permanent Participants representing Arctic
slightly in the Northwest Territories of Canada, indicating          Indigenous peoples, including the Aleut International Association,
large spatio-temporal variability of pan-Arctic fire dynamics        the Arctic Athabaskan Council, the Gwich’in Council International,
(York et al., 2020). Further, in the past 3 years, there have        the Inuit Circumpolar Council, the Russian Association of Indige-
been large fires in Fennoscandia in 2018, Alaska and Green-          nous Peoples of the North, and the Saami Council.

Biogeosciences, 18, 5053–5083, 2021                                                     https://doi.org/10.5194/bg-18-5053-2021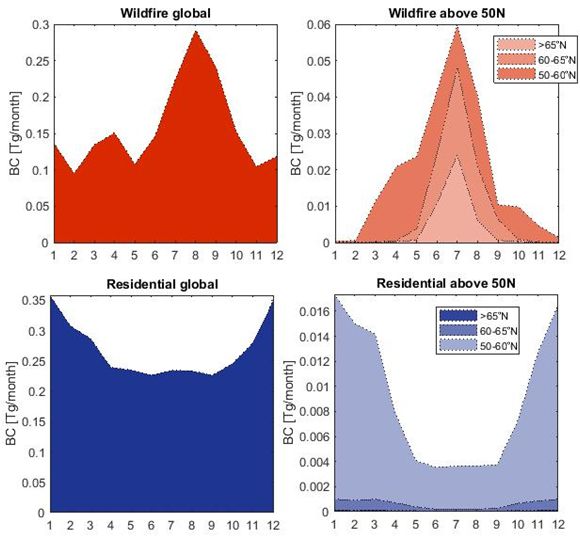
J. L. McCarty et al.: Arctic fire regimes and emissions in the 21st century                                                      5055

ated emissions are also likely to increase. For instance, nat-              regions that impact the Arctic (paper Sect. 4 and policy
ural fires, defined as lightning-caused fires, may increase as              questions 1 and 3–5 in Table S2);
lightning is predicted to increase (Púčik et al., 2017; Veraver-
beke et al., 2017; Bieniek et al., 2020), under Representative           3. contextualize emissions from the Arctic fire regime with
Concentration Pathways (RCPs) 4.5 (stabilizing emissions)                   other sectoral sources for the pan-Arctic (paper section
and 8.5 (high emissions) developed for the Intergovernmen-                  5 and policy questions 5–6 in Table S2);
tal Panel on Climate Change (IPCC) Fifth Assessment Re-                  4. identify key challenges and research questions that
port (AR5). Likewise, using the same scenarios, wildfire                    could improve understanding, monitoring, and manage-
emissions of BC, CO, NOx , PM2.5 , and SO2 could exceed                     ment of Arctic fires in the 21st century (paper Sects. 6–8
anthropogenic emissions in northeastern Europe, including                   and policy questions 2 and 6 in Table S2).
Sweden and Finland, by 2090 (Knorr et al., 2016). There is a
clear consensus that the emerging Arctic fire regime will be            Our focus is SLCF emissions, but we note that wildfires
marked by shifts in fire seasons; i.e. likelihood of extreme         are also a source of CO2 and other contaminants of environ-
fires later in the growing season will occur in the boreal           mental and human health concern in the Arctic, including
forests of eastern Canada (Boulanger et al., 2013); central          mercury and polycyclic aromatic hydrocarbons (PAHs).
and northwestern Canada (Boulanger et al., 2014); and Eu-
ropean Russia, West Siberia, and the Far East (Sherstyukov
and Sherstyukov, 2014). By the end of the 21st century un-           2    Drivers of Arctic fire regimes
der RCP6.0 (stabilizing emissions with higher CO2 equiva-
                                                                     Broadly speaking, wildfires are driven by climate and
lency than RCP4.5), the annual chance of large tundra fire
                                                                     weather conditions influencing flammability, fuels, and fuel
in Alaska will be almost one in four, i.e. a range of 13 %–
                                                                     conditions (Silva and Harrison, 2010; de Groot et al., 2013).
23 % predicted increases (Hu et al., 2015). Moreover, Wang
                                                                     Ignition from lightning strikes, fire weather (i.e. tempera-
et al. (2017) noted that a recent lengthening in the fire sea-
                                                                     ture, humidity, precipitation, and wind), and fuel abundance
son in Canada has led to the increase in the total number of
                                                                     (build-up) and conditions (moisture) are the typical control-
fire spread days, leading to large increases in total fire size
                                                                     ling processes for “natural” fires, i.e. fires not caused directly
and emissions for early season fires like the Fort McMurray
                                                                     by human activity. Human-caused fires are driven by fuel
megafire in Alberta. Lengthening the fire season, a compo-
                                                                     management to reduce fire risk, land management in agricul-
nent of the emerging Arctic fire regimes, means increased
                                                                     tural and timber landscapes, cultural practices, and accidents
potential for more and larger fire emissions throughout the
                                                                     (Granström and Niklasson, 2008; Bowman et al., 2020).
fire season, starting earlier in spring and lasting later into au-
                                                                        Historically, both climate and humans have influenced
tumn.
                                                                     fire activity in the pan-Arctic region. Paleofire meta-analysis
   For the past 2 decades, it has been well established that un-
                                                                     of boreal biomass burning during the Holocene (4000 to
derstanding fire regimes improves emission estimates from
                                                                     200 years ago) for the boreal zone of North America and
fires in high northern latitudes (Conard and Ivanova, 1997;
                                                                     Fennoscandia shows general trends in boreal biomass burn-
Soja et al., 2004a) and may even be necessary for creating
                                                                     ing were primarily controlled by climatic changes, mainly
emission models (van der Werf et al., 2010). Further, climate
                                                                     mean annual precipitation in Alaska, northern Quebec, and
change is expected to alter fire regimes and likely increase
                                                                     northern Fennoscandia and summer temperatures in central
emissions (Sommers et al., 2014). For that reason, this review
                                                                     Canada and central Fennoscandia (Molinari et al., 2018). Bo-
also includes emission estimates from adjacent boreal fires
                                                                     real needleleaf evergreen fuel composition at the landscape
as well as temperate fire sources known to impact the Arctic
                                                                     level across Alaska and central and southern Fennoscandia
region via increased atmospheric abundance and deposition
                                                                     was secondary to climatic controls. These paleofire results
of black carbon as well as greenhouse gas emissions. This
                                                                     align with recent findings by Walker et al. (2020), show-
review paper took shape from policy questions (Table S2)
                                                                     ing fine-scale drainage conditions, overstorey tree species
that the Expert Group on Short-Lived Climate Forcers (SLCF
                                                                     composition, and fuel accumulation rates across 417 sites
EG) of AMAP, a Working Group of the Arctic Council, was
                                                                     in boreal and taiga ecoregions of northwestern Canada and
asked to answer for its 2021 Assessment Impacts of short-
                                                                     Alaska were more important than incidental fire weather
lived climate forcers on Arctic climate, air quality, and hu-
                                                                     in terms of fire severity and subsequent carbon emissions.
man health (AMAP, 2021). Our specific objectives are to
                                                                     Pollen-based reconstructions show prehistoric and early his-
  1. identify and review the key drivers of the Arctic fires         toric human settlements increased during wetter climates
     today and in the future to characterize an emerging Arc-        in Minusinsk Hollow in south-central Siberia, where grain
     tic fire regime, with potential changes (paper Sects. 2–3       and pasture yields increased 2-fold, rather than dry peri-
     and policy question 1 in Table S2);                             ods that favoured pastoralist lifestyles (Blyakharchuk et al.,
                                                                     2014), highlighting the connections between fire, climate,
  2. characterize fire emissions from ground- and satellite-
                                                                     and human-dominated landscapes.
     based data sources in the Arctic, boreal, and temperate

https://doi.org/10.5194/bg-18-5053-2021                                                       Biogeosciences, 18, 5053–5083, 2021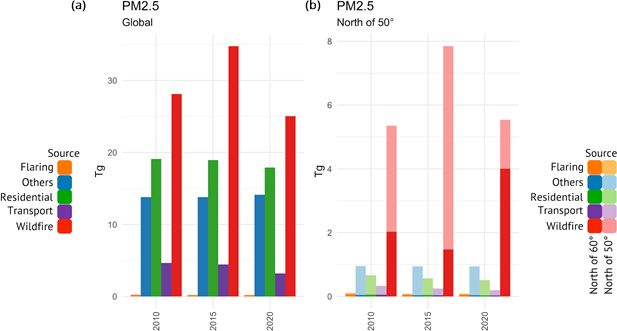
5056 J. L. McCarty et al.: Arctic fire regimes and emissions in the 21st century
Open biomass burning from anthropogenic activities like 3 Future Arctic fire activity
agriculture, timber, and energy extraction are expected to
increase in the Arctic as climate change expands human- 3.1 Climate change and future fires
dominated landscapes northward, increasing potential igni-
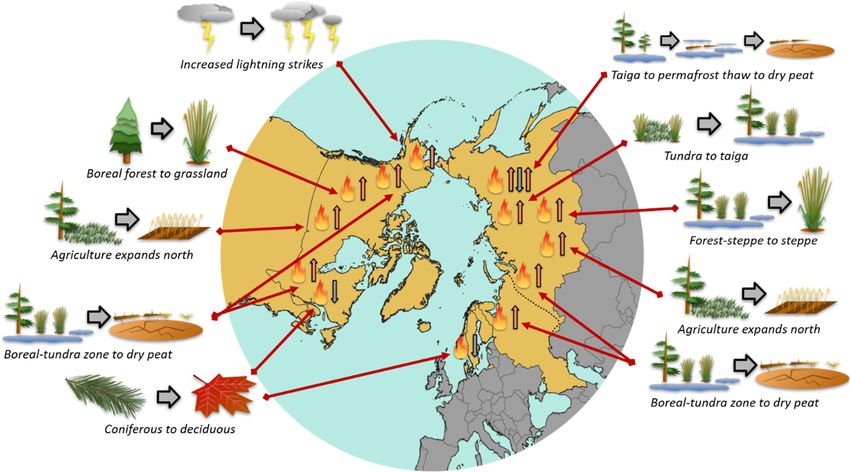
tion sources (Fig. 1). The 2019 Greenland wildfire, which Many future fire modelling approaches use greenhouse gas
consumed surface vegetation and high-carbon soils for nearly emission scenarios to project the impact of climate change
a month, was caused when a campfire ignited dry ground on future temperature and precipitation – both influencing
near a public camping site of the world-renowned Arctic Cir- fuel ignition and subsequent burning (Veira et al., 2016). In-
cle Trail (McGwinn, 2019), indicating that tourism will need creased fire risk will not be uniform across the pan-Arctic
to adapt to increased fire risk in tundra landscapes. Green- (Fig. 1). For instance, permafrost thaw will lead to a rewet-
land wildfires in 2017 and 2019 occurred east of Sisimiut ting of soils (Wrona et al., 2016), reducing above-ground and
in tundra areas with low vegetative cover and degraded per- below-ground fire risk. Boike et al. (2016) showed that in-
mafrost but high-carbon soils during warm, dry, and sunny creasing areas of thermokarst lakes were not coincident with
summers (Evangeliou et al., 2019). Timber extraction and areas of increasing fire in the central Sakha Republic. Surface
site preparation, including operation of machinery and ve- fires can cause permafrost to thaw, producing thermokarst
hicles on ground covered in dry wood residues, currently lakes (Jones et al., 2015), which previously have been consid-
cause large wildfires in the Arctic Council region, includ- ered to reduce fire risk (Sofronov et al., 2000) but are not per-
ing the 2014 Västmanland fire in Sweden ignited by forestry fect fire breaks as wildfires can “jump” (Sofronov and Volok-
vehicles during subsoiling activities (Lidskog et al., 2019), itina, 2010). Further, changing precipitation regimes in the
which actively burned for 18 d, creating a burn scar of over form of more rainfall in the Arctic for the months of March
14 000 ha (Pimentel and Arheimer, 2021). Northward agri- through December by the end of century using RCP8.5 pro-
cultural expansion will likely increase human-caused open jections (Bintanja and Andry, 2017) could both reduce fire
burning as wheat and maize production is expected to grow risk through increased wetness and increase fire risk through
in previously permafrost areas of west Siberia (Parfenova more vegetation growth and/or shifting fuel regimes. End-
et al., 2019). West Siberia is currently a minor source re- of-century modelled fire–climate interactions under RCP6.0
gion of agricultural burning (Hall and Loboda, 2017), with for Alaska showed summer temperatures and annual precip-
many farmers insisting that fire is necessary to clear fields itation are the most important climatic factors driving the
under present-day management and resource constraints de- likelihood of new wildland fire regimes in tundra and the
spite bans on open agricultural burning (Theesfeld and Je- boreal forest–tundra boundary (Young et al., 2016). Burned
lenik, 2017). This northward agricultural land could expand area is predicted to increase 40 % to 50 % in the high lati-
into the cold regions of the boreal zone (Kicklighter et al., tudes under climate-forcing scenario RCP8.5 given modelled
2014; King et al., 2018), nearing the Arctic Circle for cen- changes in fuel loads, fuel moisture, and increased lightning
tral Siberia (Tchebakova et al., 2016). Of course, the north- frequency (Krause et al., 2014). Increased convective cloud
ward agricultural transitions will also be dependent on local formation has been documented in the Russian Arctic (Cher-
and/or in situ conditions limiting its expansion, such as infe- nokulsky and Esau, 2019) and the North American boreal
rior soils, existing land uses not compatible with agricultural forest (Veraverbeke et al., 2017), with a 5 % increase in con-
conversion, and topographic limitations (Ioffe and Nefedova, vective storms in northern Europe projected by the end of the
2004; Dronin and Kirilenko, 2011; Tchebakova et al., 2011). 21st century under RCPs 4.5 and 8.5 (Púčik et al., 2017). In
However, given the degraded conditions of most abandoned general, lightning frequency is expected to increase over ar-
agricultural land in the steppes of Siberia and high interest eas north of 50◦ N. The strongest projected relative increase
in northern agricultural development by neighbouring Asian is approximately 100 % across northern Europe under the
countries, northward development of grains and other com- RCP8.5 scenario by the end of the century (Groenemeijer
modity crops is expected (Prishchepov et al., 2020). Finally, et al., 2016). Moreover, since summers are expected to be-
suppression of wildfire in Canadian boreal communities has come drier in the future (Venäläinen et al., 2020), the role of
increased their likelihood of burning, allowing fuels to build lightning as an ignition source for wildfires may increase for
up in and near populated places (Parisien et al., 2020), call- northern Europe.
ing into question what other wildland–urban interfaces in the Figure 1 depicts transition themes and associated fire risks
Arctic region may experience increased fire risk and fires due taken from the scientific literature, with general locations on
to long-term aggressive fire suppression. the map derived from the locations of these studies. These
ecological and meteorological studies rely on gridded cli-
mate scenarios from future greenhouse gas emission scenar-
ios in order to predict fire risk for mid-century (2050) and late
century (2100). First, as boreal forests experience permafrost
thaw, where initially wet soils (Wrona et al., 2016; O’Neill
et al., 2020) are followed by increasingly dry ground fuels
Biogeosciences, 18, 5053–5083, 2021 https://doi.org/10.5194/bg-18-5053-2021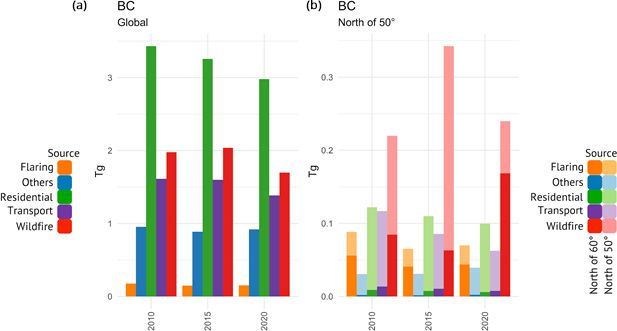
J. L. McCarty et al.: Arctic fire regimes and emissions in the 21st century                                                               5057

Figure 1. A sample of peer-reviewed future Arctic fire risk variables due to expected ecological and meteorological transitions by mid-
century and late 21st century climate change for Arctic Council member states. Upward arrows indicate increase in fire risk and downward
arrows indicate a decrease in fire risk, with the location of the arrows approximate to the location of fire risk from the literature and not
projections for a given country; the dashed line indicates the boundary between European Russia and Siberia and the Russian Far East. Note
that taiga is used in northern forest zones completely contained in Russia while boreal is used for the rest of the pan-Arctic northern forests.

(Turetsky et al., 2015; Box et al., 2019). Topography plays               ing systems show a decrease in fire risk from light nee-
a crucial role in determining shifting habitats, where drying             dle conifers (Scots pine, larch) to deciduous broad-leaf tree
will dominate on tilted surfaces and bogging will dominate                species (birch, aspen, willow) that exist between the temper-
on flat terrain (Tchebakova et al., 2009). As the Siberian Arc-           ate and boreal zones, as well as along river valleys. Fire risk
tic tundra is dominated by relatively flat terrain, bogging is            is also lower in dark-leaf conifers (Melekhov, 1980). Fire re-
predicted to prevail. Second, anticipated transitions of bo-              turn intervals (FRIs) are consistent with Melekhov (1980),
real forest to deciduous forest stands would decrease fire                with a mean FRI of 36 years (range 17–133) in light conifer-
risk in eastern Canada and small regions of interior Alaska               ous forest compared with a mean FRI of 196 years (range 75–
(Terrier et al., 2013; Foster et al., 2019; Mekonnen et al.,              725) in dark-coniferous forest (Furyaev, 1996; Shvidenko
2019), as deciduous species are less flammable than conif-                and Nilsson, 2000; Soja et al., 2006). Larix are a fire-tolerant
erous species (Päätalo, 1998; Krawchuk et al., 2006). Third,              species, and dark-leaf coniferous species are a shade-tolerant
expansion of grassland ecosystems is predicated in north-                 secondary-succession cohort (Shugart et al., 1992). Sixth,
western Canada and Alaska (Wang et al., 2019; Whitman                     forest–steppe and steppe are predicted to dominate over half
et al., 2019) and Siberia (Tchebakova et al., 2009, 2016).                of Siberia, largely forced by climate and increases in fire
Fourth, increased lightning strikes will increase fire risk in            regimes (Tchebakova et al., 2009). The forest–steppe that
Alaska (Veraverbeke et al. 2017) but also northern Europe                 exists at the southernmost extent of the Siberian boreal for-
(Púčik et al., 2017). Fifth, the interaction between climate-            est is transitioning to steppe due to increases in extreme
driven changes in fire regimes and permafrost will compel a               fires that burn the soil organic matter to mineral soil and
decrease in and a northern migration of Siberian taiga, which             repeated fires and high temperatures that kill regenerating
will result in the transition of tundra to taiga in northern              seedlings. Seventh, northward agricultural expansion may
Siberia (Tchebakova et al., 2009, 2011; Sizov et al., 2021).              increase human-caused agricultural burning as wheat and
Permafrost is not predicted to thaw deep enough to sustain                maize (silage) establish in previously permafrost areas of east
dark-needled taiga (Pinus sibirica, Abies sibirica, and Picea             Siberia (Tchebakova et al., 2009; Parfenova et al., 2019), ex-
obovata); nonetheless light-needled coniferous Larix is pre-              panding into the cold regions of the boreal zone (King et al.,
dicted to continue to dominate in eastern Siberia, maintain-              2018) in North America as well. Finally, a 3-fold increase in
ing a higher fire risk according to the Russian fire hazard               permafrost thaw in the boreal zone under RCP4.5 by 2100
rankings (Melekhov, 1980). The Russian fire hazard rank-

https://doi.org/10.5194/bg-18-5053-2021                                                             Biogeosciences, 18, 5053–5083, 2021
5058                                                 J. L. McCarty et al.: Arctic fire regimes and emissions in the 21st century

is likely to increase the amount of peat fuels available for          ous stands (Alexander and Mack, 2017). Further, with satel-
burning (Nitzbon et al., 2020).                                       lite mapping of taiga–tundra vegetation of moderate to high
   Previous work has identified the Arctic as a regional “hot         spatial and temporal resolution shows a northern expansion
spot” for interannual variability of key atmospheric con-             of trees, but with complex patterns of diffuse and abrupt tran-
stituents, with wildfire being the major driver of this vari-         sitions from forests to non-forests (Montesano et al., 2020).
ability (Fisher et al., 2010; Monks et al., 2012; Voulgarakis            There is a consensus that prolonged fire seasons will be-
et al., 2015). As stated earlier, climate warming can cause           come more common, increasing in the eastern boreal forests
more ignitions from lightning (Veraverbeke et al., 2017) and          of Canada (Boulanger et al., 2013), central and northwestern
degraded permafrost due to increasing dry ground fuels, in-           Canada (Boulanger et al., 2014), and European Russia (par-
cluding peat (Turetsky et al., 2015), and increased fire sever-       ticularly the Republic of Karelia and Leningradskaya oblast),
ity (Teufel and Sushama, 2019). Using the RCP8.5 scenario,            west Siberia, and the Far East (Tchebakova et al., 2009; Sher-
Teufel and Sushama (2019) estimate that a 2.0 ◦ C global              styukov and Sherstyukov, 2014). Wang et al. (2017) note
threshold in temperature increase, which could be reached             that recently the fire season in Canada is characterized by
around 2031, may cause 42 % of pan-Arctic permafrost to               a higher total number of fire spread days, leading to large in-
abruptly degrade and increase fire severity in Russia, Canada,        creases in total fire size and emissions for early season fires
and Alaska. By the end of the century, wildland fire risk             like the Fort McMurray megafire in Alberta, which burned
is expected to increase, with length of fire seasons – mea-           both forests and peatlands and was caused by humans (Hanes
sured in terms of daily severe fire weather occurrence – pre-         et al., 2019). Lengthening the fire season means increased
dicted to expand by as much as 20 d for high northern lat-            potential for more and larger fire emissions throughout the
itudes using the A1B (roughly corresponding to RCP6.0),               fire season, starting earlier in spring and lasting later into au-
A2 (∼ RCP8.5), and B1 (∼ RCP4.5) scenarios (Flannigan                 tumn. Ignition likelihood is often modelled by considering
et al., 2013). Similarly, Sherstyukov and Sherstyukov (2014)          the moisture conditions of ground fuels (i.e. litter) and the or-
predict an increase of >50 d of high-fire-risk days by 2100           ganic layer (i.e. forest canopy), whereby humans are the most
for Russia under the RCP8.5 scenario, with a potential to             likely source of fire on the ground, and lightning is the most
double annual forest-fire-burned area. Using CMIP5 model              likely the source for canopy fires (Wotton et al., 2003). Ver-
intercomparisons, Lehtonen et al. (2016) found that large             averbeke et al. (2017) introduced a positive feedback loop be-
(≥ 0.1 km) boreal forest fires in Finland may double or even          tween climate, lightning, fires, and northward forest expan-
triple by the end of century, using RCP4.5 and RCP8.5 sce-            sion, whereby surface energy fluxes from forests appeared to
narios, but with large inter-model variability. Robust predic-        be increasing the probability of lightning in Alaska.
tions of future burned area in wildland and human-dominated              Boreal fire regimes and related changes in spring albedo
landscapes for the Arctic require an understanding and quan-          (relative reflectance) and the radiation balance are distinct
titative simulation of the major drivers of fire (specifically cli-   in North American (crown-fire-dominated) and northern
mate and fire weather, ignition, fuels, and humans), including        Eurasian (surface-fire dominated, smaller negative shortwave
coupled dynamics between and among these drivers (Riley et            forcing) systems (Rogers et al., 2015). In the near future,
al., 2019).                                                           these changes may be positive but become negative in the
                                                                      midterm and long term. In general, climate change acceler-
3.2    Biogeography of future fires                                   ates forest growth at high northern latitudes due to a longer
                                                                      growing season. Elevated CO2 concentration decreases tran-
The climate-induced vegetation shifts, which would also               spiration and increases photosynthetic rate and thus enhances
modify fire risk and related emissions, present a complex             forest growth (Peltola et al., 2002; Kellomäki et al., 2018).
matrix for the Arctic Council member states. Predictions of           However, abiotic and biotic damages in particular may have
boreal forest transition to deciduous forest stands would de-         negative effects on forest growth and dynamics (Seidl et al.,
crease fire risk in eastern Canada and interior Alaska (Terrier       2014). For example, drought increases the risk of forest fires
et al., 2013; Foster et al., 2019; Mekonnen et al., 2019). Wang       but also negatively impacts the growth of Norway spruce
et al. (2019) found that these trends are already occurring in        (Picea abies) and exposes trees to biotic damages. Snow
Alaska and northwestern Canada using 3 decades of Land-               damages are estimated to increase in northeastern Europe but
sat imagery with a 30 m resolution, as climate drives grass           decrease elsewhere in Europe by the end of century under the
and shrub expansion in the Arctic, and wildfires drive most           RCP4.5 and 8.5 scenarios (Groenemeijer et al., 2016). Wind
of the evergreen forest reduction and expansion of decidu-            damage risk is expected to increase due to the shortening of
ous forests in the boreal regions. Further work in mature de-         the soil frost period (Venäläinen et al., 2020), as frozen soils
ciduous forests of Interior Alaska show that current canopy           anchor trees in the ground, thus making them less vulnera-
“gaps” are related to ecological shifts to evergreen shrubs           ble to uprooting. Many forest insects responsible for bug kill
and lichens, grasses, and mosses, thus increasing overall fire        of trees will benefit from climate change due to established
risk due to presence of these high-flammability coniferous            linkage of increased habitat range and increased winter tem-
species in these small areas within low-flammability decidu-          peratures (Pureswaran et al., 2018). Climate-driven bug kill

Biogeosciences, 18, 5053–5083, 2021                                                      https://doi.org/10.5194/bg-18-5053-2021
J. L. McCarty et al.: Arctic fire regimes and emissions in the 21st century 5059 increases the amount of easily burnable material in forests for transport and thus deposition on snow and ice that accel- and can influence fire risk. For example, a large-scale bark erates melting, as well as associated climate feedback due to beetle invasion could increase the amount of fuel via dead effect on albedo. Given this, current and future early season wood, increasing ignition risk and crown fire risk as well fires are particularly relevant because Arctic snow and sea ice as increasing the need, danger, and cost of fuels and fire coverage are much more widespread in the early burning sea- management of insect-attacked forests (Jenkins et al., 2014). son than late season – meaning earlier BC deposition could According to Venäläinen et al. (2020), a warming climate accelerate springtime melt to April, before the usual start of is likely to increase the risk of bark beetle outbreaks and the melt season in May (Stroeve et al., 2014). Emission fac- wood decay caused by Heterobasidion spp. root rot in Fin- tors for biomass burning in grassland and steppe ecosystems land’s coniferous forests. Siberian forests have already ex- are generally smaller than those of boreal forests (Akagi et perienced a northern progression of the destructive Siberian al., 2011; Andreae, 2019), which potentially implies differ- moth (Dendrolimus sibiricus Tschetvericov) by a distance ent impacts on atmospheric chemistry and SLCFs. There- of ∼ 0.5◦ and a decrease in its regeneration cycle from 2 fore, while boreal forest fires emit more SLCFs than grass- to 1 year, prompted by drought and increasing temperatures lands and cropland fires, the springtime burning of northern (Baranchikov and Montgomery, 2014; Kharuk et al., 2017). grasslands, peatlands, and croplands – often human-caused – Moreover, the probability of forest-damaging cascading and means these emissions are more likely to be transported to compounding events, i.e. large-scale wind damage followed the Arctic during favourable transport conditions in March, by a widespread bark beetle outbreak, may increase remark- April, and May than summertime forest fires. ably in the future for the high northern latitudes. Future cli- mate conditions are expected to become more favourable for forest fires in the boreal zone, even in highly managed re- 4 Arctic fire emissions gions. Under RCP8.5, Stralberg et al. (2018) estimated that In Sects. 4 and 5, we present new emissions work that builds by 2100, grasslands will replace much of the upland conifer, on the 2015 AMAP assessment of BC and ozone (AMAP, mixed forests, and deciduous forests for a large area of the 2015), which included 2005 biomass burning emissions from boreal forest zone of northern Alberta. Shorter fire return in- an the Global Fire Assimilation System (GFASv1.2; Kaiser tervals combined with climate-change-induced drought will et al., 2012), Global Fire Emissions Database version 2 reduce the resiliency of evergreen and broadleaf species to (GFEDv2; van der Werf et al., 2006), GFEDv3 (van der Werf re-seed and/or establish after wildfires, leading to expansion et al., 2010), the Global Inventory for Chemistry-Climate of grassland ecosystems in what is now northern Canadian studies (GICC; Mieville et al., 2010), MACCity (Lamarque forests (Whitman et al., 2019). Increased grass-dominated et al., 2010), and the Fire Inventory from NCAR (FINNv1.5; landscapes would create a new fire regime of frequent but Wiedinmyer et al., 2011) for above 60◦ N. For the 2021 low-severity fires, with the likelihood of SLCF transport to AMAP assessment, we focused on longitudinal biomass the Arctic most likely in the spring months of March through burning emission models for the years 2005 through 2018 May (Hall and Loboda, 2018). Grassland fires produce less using the Global Fire Emissions Database with small fires energy, with smoke plumes more similar to crop residue (GFEDv4s; van der Werf et al., 2017), FINNv1.5 (Wiedin- burning, and are unlikely to breach the tropopause for con- myer et al., 2011), GFASv1.2 (Kaiser et al., 2012), the Quick sistent, year-round transport of smoke to the Arctic (Hall and Fire Emissions Dataset (QFEDv2.5r1; Koster et al., 2015), Loboda, 2017), unlike the current observed deposition from and the Fire Energetics and Emissions Research (FEER; boreal forest fires in the Arctic (Thomas et al., 2017). Further, Ichoku and Ellison, 2014). These versions of GFAS, GFED, Smirnov et al. (2015) found forest fires in European Russia FINN, FEER, and QFED analysed rely on Moderate Reso- during 2008–2012 occurred mainly in June and August, with lution Imaging Spectroradiometer (MODIS) thermal anoma- Siberia and the Russian Far East being the main sources of lies, with GFEDv4s integrating the MCD64A1 burned area BC emissions during a time when transport to the Arctic is product with the MODIS active fire product to account for unfavourable. In the Sakha Republic, Kirillina et al. (2020) small fires (Giglio et al., 2009). For each global fire emis- found that from 2011 onwards, fire seasons have been 13 d sions model, the area of interest was defined roughly as 45 longer than previously, on average, and starting from 2009 to 80◦ N (N) globally, split by latitude ranges of 45 to 50◦ N: onwards, fire seasons have started earlier in April, sooner temperate, 50 to 60◦ N: boreal, 60 to 70◦ N: low Arctic, and than previous years. A peak fire occurrence across a 3-month 70 to 80◦ N: high Arctic. Average annual emissions from period of May to July persists in Sakha. During the 2020 open biomass burning from all sources (agriculture, boreal extreme fire season in Siberia, high-resolution satellite data forest, tundra, peat, etc.) were calculated for 2005–2018 for from the European Space Agencies’ Sentinel-2 detected fires BC, methane (CH4 ), carbon monoxide (CO), and fine partic- around still-frozen thermokarst lakes above 70◦ N (McCarty ulate matter (PM2.5 ). et al., 2020). This indicates that more BC from future early Since the Visible Infrared Imaging Radiometer Suite (VI- season burning in and near Arctic Siberia could be available IRS) provides daily, global observations of low-intensity fires https://doi.org/10.5194/bg-18-5053-2021 Biogeosciences, 18, 5053–5083, 2021
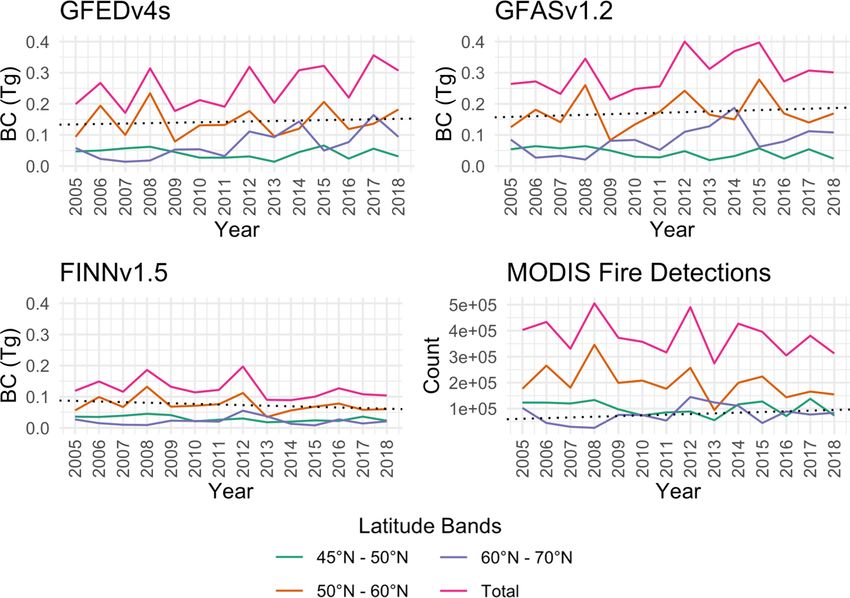
5060                                               J. L. McCarty et al.: Arctic fire regimes and emissions in the 21st century

Figure 2. Annual black carbon (BC) emissions in teragrams from three commonly used global fire emissions models and annual fire activity
from the MODIS Collection 6 active fire product (Terra and Aqua) split by latitude ranges for the Arctic Council region, 2005–2018; note
the y axis has been standardized for each model for ease of comparison; the dotted line is the positive trend for BC emissions from open
biomass burning and 1 km MODIS active fire detections (Terra and Aqua) for 60 to 70◦ N.

(Johnston et al., 2018), a custom AMAP open biomass burn-             area experiencing increasing fires due to climate change
ing emissions inventory was developed for the year 2018 to            (de Groot et al., 2013), and includes the largest wildfires
utilize VIIRS’s capabilities to detect smouldering fires which        in British Columbia’s history, burning 1200 km2 in summer
are common in peat landscapes. Suomi-NPP VIIRS active                 2017 (Kirchmeier-Young et al., 2019). Note, however, that
fire from day and night detections (Oliva and Schroeder,              fire activity detected by the 1 km MODIS MCD14 Collection
2015) were assumed to completely burn each 375 m2 pixel. A            6 active fire data (Giglio et al., 2016), with confidence values
“best-guess” land cover was created from three different land         >50 %, has a positive trend for fires occurring between 60
cover products, with a sample (n = 30 locations) validation           and 70◦ N but not for the latitude bands of 45 and 50◦ N or
of land cover type performed for each country. Ultimately,            50 and 60◦ N (Fig. 2).
the 750 m VIIRS Surface Type land cover product (Zhang et                In the 14-year emissions estimates from GFAS, GFED,
al., 2018) was used for North America, Greenland, and the             and FINN, a clear shift has occurred in the zonal distribu-
Russian Federation, augmented by the revised 1 km Circum-             tion of fire since the mid-2000s. Fire emissions are increas-
polar Arctic Vegetation Map (Raster CAVM; Raynolds et al.,            ing more north of 60◦ N compared to the temperate zone of
2019) for missing values in the high northern latitudes. For          45 to 50◦ N, where large amounts of human-caused burning
Norway, Sweden, and Finland, the 10 m Land Cover Map of               and wildfires throughout North America, Europe, and Eura-
Europe 2017 from the Sentinel-2 Global Land Cover Project             sia occur (Fig. 2). This trend is pronounced in GFED and
(Gromny et al., 2019) was used. All land cover maps were              GFAS, with these two models showing a positive trend (note
reclassified into the International Geosphere-Biosphere Pro-          the dotted line in Fig. 2) and FINN showing a slight decrease
gram (IGBP) classes for ease of emission calculations. Fuel           in later years even as total MODIS active fire detections in-
loadings and combustion completeness were taken from Van              creased (bottom panels of Fig. 2). The 2005 to 2018 multi-
Leeuwen et al. (2014), with tundra values used for Green-             model annual average BC emissions from all open biomass
land. Emission factors were taken from Akagi et al. (2011),           burning sources in the Arctic (60 to 80◦ N) and adjacent re-
with updates from Andreae (2019).                                     gions known to impact smoke transport into the Arctic (45 to
   Most fire activity and emissions occur between 50 and              60◦ N) are 0.34 Tg. The years with the highest multi-model
60◦ N, with very few open biomass burning emissions be-               average are 2012, 2008, and 2015 with BC emissions of 0.45,
tween 70 and 80◦ N and zero satellite observations of fire            0.44, and 0.41 Tg, respectively. The lowest annual average
above 80◦ N (Fig. 2). The latitude band of 50 to 60◦ N cor-           BC emission years from the five global fire emissions mod-
responds to the southern extents of the boreal region, an             els are 2007 and 2013, both with 0.27 Tg. The fire emissions

Biogeosciences, 18, 5053–5083, 2021                                                       https://doi.org/10.5194/bg-18-5053-2021
J. L. McCarty et al.: Arctic fire regimes and emissions in the 21st century                                                   5061

model with the consistently highest BC emissions is QFED,            in size and was eventually extinguished by rain (Cartier,
with an annual average of 0.68 Tg (Fig. 3). FEER, GFAS,              2017). The fires burned >20 km2 of high-carbon soils – po-
and GFED have more agreement, with annual BC emis-                   tentially peat due to smouldering and fire spread behaviour –
sion averages of 0.32 (± 0.07) Tg, 0.30 (± 0.07) Tg, and 0.25        that became vulnerable due to permafrost degradation (Daa-
(± 0.06) Tg, respectively. FINN has the lowest annual aver-          nen et al., 2011). Work by Evangeliou et al. (2019) esti-
age BC emissions of 0.130 Tg, with higher emissions in 2012          mated the 2017 wildfire consumed a fuel amount of about
(0.20 Tg) and 2008 (0.19 Tg). The AMAP model designed                0.12 Tg of carbon (C) and emitted about 0.00002 Tg (20 Mg)
specifically for the pan-Arctic, which was based on VIIRS            of BC and 0.0007 Tg (700 Mg) of organic carbon (OC), in-
active fire data and region-specific land cover types, pro-          cluding 0.00014 Tg (140 Mg) of brown carbon (BrC – the
duced slightly higher emission estimates than FINN (Fig. 3)          portion of OC that absorbs towards shorter wavelengths). Al-
for the year 2018. The AMAP model predicts BC emis-                  though these fires were small compared to fires burning at
sions of 0.13 Tg and CH4 emissions of 1.39 Tg, compared              the same time in North America and Eurasia, a large fraction
to FINN’s 0.11 Tg of BC and 1.19 Tg of CH4 . Compared                of the BC, OC, and BrC emissions (30 %) were deposited
for 2018 only, GFED has marginally higher BC emissions               on the Greenland ice sheet. Measurements of aerosol op-
than GFAS, while methane emission estimates from GFAS                tical depth in western Greenland showed that the air was
are substantially higher than those of GFED.                         strongly influenced by the Canadian forest fires. Even so,
   Ground-based official statistics vary greatly by country          the Greenland fires had an observable impact, doubling the
or sub-region (i.e. Alaska and Greenland) for circa 2019             column concentrations of BC. The spatiotemporal evolution
(Table 1). Table S3 provides the emission variables used             and, in particular, the top height of the plume were also con-
to calculate emissions for each country or sub-region of             firmed using the vertical cross section of total attenuated
the pan-Arctic, reporting official burned area statistics. The       backscatter (at 532 nm) from Cloud-Aerosol Lidar and In-
Russian Federation has the highest burned area, with over            frared Pathfinder Satellite Observations (CALIOP) lidar. The
100 000 km2 burned. In 2019, open biomass burning in Euro-           maximum albedo change due to BC and BrC deposition from
pean Russia – comprising the Northwestern, Central, South-           the Greenland fires was −0.007 at maximum, while the aver-
ern, North Caucasus, and Volga federal districts – accounted         age instantaneous BOA (bottom of the atmosphere) radiative
for only 190 km2 of burned area (Aviales, 2019). Approxi-            forcing over Greenland at noon on 31 August 2017 (post-
mately 98.2 % of burned area in Russia occurred in the Urals,        fire) was between 0.03 and 0.04 W m−2 , with locally occur-
Siberia, and Far East federal districts. In general, Green-          ring maxima up to 0.77 W m−2 . Here, the BOA included the
land, Fennoscandia, and European Russia are the regions              aerosol effects of both BC and BrC in the atmosphere and de-
with the lowest burned area and open biomass burning emis-           posited on the snow. The albedo effect (a decrease) was very
sions, with all regions experiencing the most burning in 50 to       low (0.007), practically unmeasurable. The summer 2017
60◦ N and the second most burning in the latitudinal band of         fires in Greenland had a small impact on the Greenland ice
60 to 70◦ N. Alaska and Canada account for approximately             sheet, causing almost negligible extra radiative forcing. This
29 000 km2 of total pan-Arctic biomass burning and 17 %              was due to the comparably small size of the fires in Green-
of the BC emissions, while the contiguous United States              land, in a global and pan-Arctic context. However, with 30 %
(CONUS) accounted for 24 % of BC emissions. It should                of the emissions deposited on the Greenland ice sheet, the
be noted that while Canada and the CONUS reported sim-               2017 Greenland wildfires were very efficient climate forcers
ilar official statistics for burned area, fires in temperate zones   on a per unit emission basis and adding to current BC de-
of the CONUS tend to emit double the emissions of boreal             position from North American boreal forest fires (Thomas et
ecosystems (Table 1) due to higher fuel loadings, emission           al., 2017). Thus, while the fires in 2017 were small in size
factors, and combustion completeness (Table S3). Greenland           on a global scale, if the expected future warming of the Arc-
is a novel fire regime in the Arctic, with two relatively sub-       tic (IPCC, 2013) produces more and larger fires in Green-
stantial wildfires in 2017 (Evangeliou et al., 2019) and 2019        land (Keegan et al., 2014), this could indeed cause substantial
(Table 1) that accounted for more burned area and emis-              albedo changes and, in turn, contribute to accelerated melting
sions than Norway or Finland. In 2019, the majority of open          of the Greenland ice sheet.
biomass burning and related emissions for the Arctic Coun-
cil member states originated in Siberia and the Russian Far
East, followed by the CONUS, Canada, and Alaska.                     5   Relevance of fire sources in global and Arctic
   Focusing on a potentially novel Arctic fire regime in                 emissions
Greenland allows us to localize the impact of fires on BC
deposition and ice and what that may hold for the future.            To place current Arctic fire emissions into context,
Unusual fires were observed in western Greenland by pi-              GFASv1.2 emissions (Kaiser et al., 2012) were compared
lots and also confirmed by satellites between 31 July and            to total anthropogenic emissions of BC, PM2.5 , and CH4
21 August 2017, after a period of warm, dry, and sunny               estimated with the integrated assessment model GAINS
weather. The largest wildfire grew to approximately 22 km2           (Greenhouse gas – Air pollution Interactions and Syner-

https://doi.org/10.5194/bg-18-5053-2021                                                     Biogeosciences, 18, 5053–5083, 2021
5062                                                J. L. McCarty et al.: Arctic fire regimes and emissions in the 21st century

Figure 3. Annual 2018 BC and CH4 emissions in teragrams from five global fire emissions models and a custom AMAP fire emissions
model for north of 45◦ N.

Table 1. Summary table of BC, PM2.5 , and CH4 emissions in teragrams (Tg) from reported statistics on burned area from the Arctic Council
members; sources for burned area include Norway (DSB, 2020), Greenland (Markuse, 2019), Finland (Ketola, 2020), Sweden (Betänkande
av 2018 års skogsbrandsutredning, 2019), Canada (CIFFC, 2020), Alaska (Alaska Division of Forestry, 2020), the contiguous United States
(NIFC, 2019), and the Russian Federation (Aviales, 2019). Fuel loadings and combustion completeness are from Van Leeuwen et al. (2014)
for boreal forests, with tundra values used for Greenland and temperate forests for the USA/CONUS; emission factors are taken from GFED4.

                            Country/                Year        Official        BC       PM2.5         CH4
                            region                          burned area        (Tg)       (Tg)         (Tg)
                                                                 (km2 )
                            Norway                 2019           0.03     7.61E-12    2.33E-10    9.08E-11
                            Denmark/Greenland      2019              8     1.27E-10    2.88E-08    6.59E-08
                            Finland                2019              6     2.00E-09    5.00E-08    2.00E-08
                            Sweden                 2018            250     6.30E-08    1.94E-06    7.60E-07
                            Canada                 2019         18 389     4.67E-06    1.43E-04    5.56E-05
                            USA/Alaska             2019         10 481     2.66E-06    8.14E-05    3.17E-05
                            USA/CONUS              2019         18 876     1.02E-05    3.43E-04    9.64E-05
                            Russia                 2019        100 785     2.56E-05    7.83E-04    3.05E-04
                            Total                              148 795     4.30E-05    1.35E-03    4.90E-04

gies) (Amann et al., 2011; Klimont et al., 2017). The                  is currently used as an operational product for global and
GAINS model explicitly considers environmental policies                regional forecasting (Inness et al., 2019) and thus likely to
and assesses their impact on current and future emis-                  be integrated into policy-making decisions on fire manage-
sions (Amann et al., 2011; Klimont et al., 2017; Amann                 ment. The GFAS wildfire and biomass burning emissions in-
et al., 2020) and projects emissions from various anthro-              clude all open biomass burning activity, with no differenti-
pogenic sectors until 2050; here we compare emissions                  ation between human-caused ignitions and natural sources
estimated for 2010, 2015, and 2020. Global GFAS data                   like lightning, but attempt to remove spurious fire emissions
were downloaded from the European Centre for Medium-                   from industrial, volcanic, and geothermal sources (Rémy et
Range Weather Forecasts (ECMWF, https://apps.ecmwf.int/                al., 2017). Data were clipped to pan-Arctic extents at 50, 60,
datasets/data/cams-gfas/, last access: 13 September 2021, lo-          and 65◦ N. The GFAS emissions data, referred to as wild-
gin required). GFAS was chosen for this comparison because             fire emissions in this review due to inability to differentiate
it was produced in near-real time on the global scale, un-             fire types in the emissions data, have a spatial resolution of
like GFED, which is a historical product and at the time               0.1◦ , so they were aggregated to 0.5◦ for comparison with
of this writing had not completed the 2020 emission esti-              GAINS. Since the 2020 wildland fire season in the Arctic
mates. GFAS also did not show consistently low emissions               was unprecedented (Witze, 2020), with approximately 27 %
for the pan-Arctic region, like FINN (Fig. 2). Further, GFAS           of fires in Siberia burning above 65◦ N (Conard and Pono-

Biogeosciences, 18, 5053–5083, 2021                                                       https://doi.org/10.5194/bg-18-5053-2021
J. L. McCarty et al.: Arctic fire regimes and emissions in the 21st century 5063 marev, 2020), the 2020 GFAS emissions can be used to rep- latitude breaks of 50, 60, and 65◦ N for the two leading sec- resent what potential future fire regimes by mid-century, i.e. tors – wildfires and residential combustion. As with global 2050, may be like, with climate-change-driven expansion of annual emissions (Fig. 4), residential combustion is the main fire seasons and likelihood for extreme fire weather and risk source sector in most months. However, in July and Septem- (see Sect. 3). ber the wildfire emissions are similar to residential combus- Figures 4, 5, and 6 present 2010, 2015, and 2020 tion, and in August they are higher at the global scale. These annual BC, PM2.5 , and CH4 emissions, respectively, two sectors show opposite temporal profiles during the year from four main source sectors of GAINS ECLIPSEv6b (Fig. S1 in the Supplement). Residential combustion is high- (https://iiasa.ac.at/web/home/research/researchPrograms/air/ est in the winter months, but wildfires grow during the spring Global_emissions.html, last access: 13 September 2021; and reach their maximum in the summer, generally falling off Höglund-Isaksson et al., 2020) and biomass burning from in September with the exception of 2020 fire emissions. In GFAS at the global scale (left) and above 50 and 60◦ N. the northern latitudes, strong spring emissions in April cor- Globally, residential combustion, i.e. oil, coal, wood, respond with the global signal (upper panels of Fig. 7), while used for heating, is the main anthropogenic source of BC the summer months comprise an even larger share of the an- emissions for these years and is the largest overall when nual emissions than in the global average. compared with GFAS wildfire emissions (Fig. 4a). Bond Consistently, wildfire emissions account for more than half et al. (2004) estimated BC emissions from open biomass of all black carbon emissions north of 60 and 65◦ N (Fig. 8), burning from wildlands and agricultural fires to be higher representing up to 74 % and 82 % of 2020 BC emissions, re- than other sources, but we did not find that when comparing spectively (Table S4). At these northern latitudes, wildfires GAINS emissions with GFAS fire emissions at the global and flaring are the main sources of black carbon, especially scale. However, in the northern latitudes, wildfires surpass north of 65◦ N, with these two sectors accounting for 93 % of the four anthropogenic sources: residential, transportation, black carbon emissions, compared to 88 % for 60◦ N. North gas flaring during oil and gas exploration and production, of 50◦ N, residential, transport, and flaring are proportion- and the sum of all other sources, i.e. “Others”. North ally larger than north of 60◦ N and 65◦ N, but still less than of 60◦ N, gas flaring is the main anthropogenic source, wildfire emissions (Fig. S2). North of 60◦ N, wildfire emis- with comparable but still smaller emissions than GFAS sions have increased from 2010 to 2020, particularly above wildfire emissions estimates. As Fig. 4 shows, 2020 was an 65◦ N. Of those wildfire emissions from GFAS that were extreme year for Arctic wildfires (York et al., 2020), with above 60◦ N, 21 % in 2010 and 27 % in 2015 occurred above BC emissions above 60◦ N twice as high as in 2010 and 65◦ N (Table S4). However, in 2020 the percentage was 56 % 2015. For PM2.5 , wildfires have higher emissions than the (Fig. 8), indicating how extreme the 2020 wildfire year was anthropogenic sectors globally, and the difference increases in the Arctic. in the northern latitudes (Fig. 5). Globally, the agriculture Given the large portion of black carbon emissions from sector is the main source of CH4 , with fossil fuel production, fires in comparison to anthropogenic sources as modelled distribution, and use (including flaring) and waste sectors all by GAINS, understanding the local climate and air pollu- emitting more than wildfires (Fig. 6). Above 50◦ N, the same tion impacts for the Arctic Council region is key. For ex- anthropogenic sectors are the main CH4 sources, though ample, the timing of fires in agricultural landscapes, boreal in 2020 wildfires emitted more methane than the others forest fires, and the Arctic tundra is during the early spring to sector. A similar phenomenon occurred above 60◦ N, where early summer months (i.e. March through May for 50◦ N and across all years, wildfire emissions are higher than the other May and June for 60 and 65◦ N as seen in Fig. S1) when BC anthropogenic sectors except for the energy sector. transport and deposition to the Arctic is possible and critical Arctic shipping is often brought up as a potentially impor- for the cryosphere (Hall and Loboda, 2018) and air pollu- tant source of BC within the Arctic in the future. According tion (Law and Stohl, 2007), from both long-range (Thomas to GAINS, in 2015 shipping comprised only 0.6 % of anthro- et al., 2017) and local sources of BC deposition (Evangeliou pogenic BC emissions north of 60◦ N. However, according to et al., 2019). For example, BC transport is possible as early a white paper by the International Council on Clean Trans- as March into mid-May for agricultural landscapes of eastern portation (ICCT; Comer et al., 2020), BC emissions from Europe (Hall and Loboda, 2017) and peatlands, grasslands, Arctic shipping increased by 85 % between 2015 and 2019. and forests in North America (Qi and Wang, 2019) and fires Their definition of Arctic is as described in the International in grasslands, forests, and agricultural lands most common in Maritime Organization (IMO) Polar Code; i.e. they assessed southern Siberia (Kukavskaya et al., 2016) and the Russian shipping in much of the high Arctic above the Barents and Far East (Hayasaka et al., 2020) during the spring months of Kara seas but inclusive of waters between Alaska and Russia March, April, and May. The boreal forest fire season starts in as far south as 60◦ N. In our comparison, shipping is included April and May in Canada (Tymstra et al., 2020) and Siberia in the transport sector of GAINS emissions. (Soja et al., 2004b; Conard and Ponomarev, 2020), moving Figure 7 shows the monthly BC emissions averaged from north into Alaska by early June (Partain et al., 2015). Fires 2010, 2015, and 2020 for the globe and the three northern and associated transport of black carbon to the Arctic in the https://doi.org/10.5194/bg-18-5053-2021 Biogeosciences, 18, 5053–5083, 2021
You can also read