RICYDE. Revista Internacional de Ciencias del Deporte
←
→
Page content transcription
If your browser does not render page correctly, please read the page content below
RICYDE. Revista Internacional de Ciencias del Deporte
doi:10.5232/ricyde

Rev. int. cienc. deporte

                                                                                  RICYDE. Revista Internacional de Ciencias del Deporte
                                                                                            VOLUME XIV - YEAR XIV
                                                                                            Pages:42-54      ISSN :1 8 8 5 - 3 1 3 7
 https://doi.org/10.5232/ricyde2018.05104                                                   Issue: 51 - January - 2018

          Basketball without borders? Similarities and differences among Continental
                                  Basketball Championships
          ¿Baloncesto sin fronteras? Similitudes y diferencias entre los Campeonatos
                                 Continentales de baloncesto

              Sergio José Ibáñez1, Sergio González-Espinosa1, Sebastián Feu2 & Javier García-Rubio3

   1.Facultad de Ciencias del Deporte. Universidad de Extremadura. Spain
   2.Facultad de Ciencias de la Educación. Universidad de Extremadura. Spain
   3.Facultad de Educación. Universidad Autónoma de Chile. Chile

                                                            Abstract
   The analysis of technical-tactical performance indicators is an excellent tool for coaches, because it provides objective informa-
   tion on the actions of players and teams. The aim of this investigation was to study the performance indicators for the last con-
   tinental basketball championships. Five continental championships played in 2015 were analysed for a total of 213 matches. The
   variables analysed were: ball possessions, point difference, points scored, one, two and three point throws attempted and sco-
   red, total and defensive and offensive rebounds, assists, steals, turnovers, blocks for and against, fouls committed and received,
   and evaluation. A descriptive analysis and performance profiles were carried out to characterise the sample. A one-way ANOVA
   and Bonferroni correction were used to identify the differences among championships. A discriminant analysis was performed to
   identify the performance indicators best characterising each analysed championship. The results show that there are differences
   among all the championships and all the performance indicators, except in three point throws scored and blocks. A specific play
   profile has been identified for each championship. The greatest performance profile differences were found between the
   Eurobasket and the Afrobasket championships, while the championships with the most similar performance indicator profiles
   were FIBA America and Asia Cup. These findings are useful for coaches when preparing the different possible scenarios depen-
   ding on the championship and their respective opponent.
   Key Words: performance analysis, competition analysis, technical-tactical performance indicators, continental
   championships, basketball.

                                                           Resumen

   El estudio de los indicadores de rendimiento técnico-tácticos son una gran herramienta para los entrenadores, pues pro-
   porciona información objetiva sobre las acciones del deportista y del equipo. El objetivo de esta investigación fue estu-
   diar los indicadores de rendimiento en los últimos Campeonatos Continentales de Baloncesto. Se analizaron los 5 cam-
   peonatos continentales del año 2015, un total de 231 partidos. Las variables analizadas fueron: posesiones de balón,
   diferencia de puntos, puntos anotados, lanzamientos de uno, dos y tres puntos anotados y lanzados, rebotes totales,
   defensivos y ofensivos, asistencias, robos, pérdidas, tapones a favor y en contra, faltas cometidas y recibidas, y valora-
   ción. Se llevaron a cabo un análisis descriptivo y de perfiles de rendimiento para caracterizar la muestra. La ANOVA de
   un factor con la corrección de Bonferroni se utilizó para identificar las diferencias entre campeonatos. El análisis discri-
   minante permitió identificar los indicadores de rendimiento que mejor caracterizan a cada uno de los campeonatos con-
   tinentales. Los resultados ponen de manifiesto que existen diferencias entre todos los campeonatos en todos los indica-
   dores de rendimiento, salvo en los tiros de 3 puntos anotados y en los tapones. Se identifica un perfil de juego específi-
   co para cada campeonato. Las mayores diferencias en los perfiles de rendimiento se encuentran entre el Eurobasket y
   Africabasket, mientras que los campeonatos con un perfil más parecido en los indicadores de rendimiento son el FIBA
   América y Asiabasket. Estos hallazgos son de utilidad para los entrenadores a la hora de preparar los diferentes escena-
   rios posibles en función del campeonato y rival al que se enfrenten.
   Palabras clave: análisis del rendimiento; análisis de la competición; indicadores de rendimiento técnico-táctico;
   campeonatos continentales; baloncesto.

   Correspondence/correspondencia: Sergio José Ibáñez
   Facultad de Ciencias del Deporte. Universidad de Extremadura
   Email: sibanez@unex.es

                                                                             Received: April 27, 2017; Accepted: September 4, 2017
Ibáñez, S.J.; González-Espinosa, S.; Feu, S., & García-Rubio, J. (2018). Basketball without borders?
Similarities and differences among Continental Basketball Championships. RICYDE. Revista internacional
de ciencias del deporte, 51(14), 42-54. https://doi.org/10.5232/ricyde2018.05104

                                         Introduction

M      odern sports practice has evolved from the preparation and analysis of competition
       by means of the subjective perceptions of the coaches towards an evaluation based
on technical-tactical performance indicators (TTPI). The study of TTPI is a useful tool
for coaches as it provides objective information about the actions of players and the team.
This information allows the identification of performance indicators and competition
characteristics (Hughes & Franks, 2007). TTPI can be studied using the outcome of the
game, i.e. the result. These studies analyse the competition in a static manner by means
of the data from the so-called game statistics. For this they use the individual or group
performance indicators analysed at the end of the competition. They permit the
characterisation of the competitions and the players. Other studies analyse performance
indicators during the match, directly studying play actions and interactions. These
investigations analyse the play process, studying the game in a dynamic manner (Ibáñez,
Feu, & Dorado, 2003).
Studies on performance indicators normally use samples from the most representative
championships in each sports discipline, due its transference to the sport context. In
basketball, studies are frequently performed on the best professional leagues, the NBA or
WNBA, at the top competitive level of professional leagues, as well as the World
Championships. The NBA has been widely studied (García, Cañadas, & Antúnez, 2015;
Ibáñez, García, Feu, Parejo, & Cañadas, 2009; Mikołajec, Maszczyk, & Zając, 2013;
Ribeiro, Mukherjee, & Zeng, 2016). The best professional leagues using the FIBA
regulations have also been studied, as the ACB (García, Saéz, Ibáñez, Parejo, & Cañadas,
2009; Gómez, Lorenzo, Sampaio, Ibáñez, & Ortega, 2008; Puente, Coso, Salinero, &
Abián-Vicén, 2015). World Basketball Championships have also been studied in different
categories. In World Junior Basketball Championship (Ibáñez, Sáenz-López, Giménez,
Sampaio, & Janeira, 2003) and comparision between junior and senior (García, Ibáñez,
Parejo, Cañadas, & Feu, 2010; Sampaio, Ibáñez, & Feu, 2004). The results of these
investigations perfectly describe each competition.
Performance profiles in sport can also be defined as the collection of reliable performance
indicators which show the performance of a player or team (Liu, Yi, Giménez, Gómez,
& Lago-Peñas, 2015). TTPI are not stable characteristics of sports teams, rather they vary
according to situational variables, like the venue for the match and the quality of the
opponent (Lago-Peñas & Lago-Ballesteros, 2011), and the efficiency of the team (Liu et
al., 2015). For this reason, performance profiles have been suggested as a stable method
for identifying the typical behaviour of sports teams (Hughes, Evans, & Wells, 2001;
O'Donoghue, 2005).
In every regional basketball championship, the winning teams can be identified by
specific TTPI, thus defining the performance profile in each competition according to its
situational variables (Liu et al, 2015). The best national basketball teams as well as
participating in their respective continental championships, have the possibility of taking
part in two worldwide competitions, the Olympic Games and the World Championships.
In the last few years, the teams that occupy the top positions in the medal tables come
from the same continental championships (FIBA America and Eurobasket). The best
ranked teams in the 2016 Olympic Games were: USA, Serbia, Spain, and Australia, with
Argentina, France, Lithuania and Croatia completing the top eight. These eight teams
come from three different continental championships.

                                                                                                   43
Ibáñez, S.J.; González-Espinosa, S.; Feu, S., & García-Rubio, J. (2018). Basketball without borders?
Similarities and differences among Continental Basketball Championships. RICYDE. Revista internacional
de ciencias del deporte, 51(14), 42-54. https://doi.org/10.5232/ricyde2018.05104
The majority of studies have focussed on identifying the TTPI which differentiate winners
from losers in different scenarios, like the final point difference (García et al., 2014) or
the fact of playing at home or away (García et al., 2009). There are also studies which
compare performance indicators according to different performance level of competition
and gender, but no studies which analyse the performance indicators among the different
continental championships. Thus the general aim of this investigation was to study the
TTPI in the last continental basketball championships. Specifically there was a dual
objective: i) to characterise the performance indicators in the five continental
championships, and ii) to identify the TTPI that differentiate and discriminate among the
championships.
Method
Participants
This is a retrospective study investigating the performance indicators differentiating
between five continental championships in 2015. The sample for this study was composed
of all the continental men’s basketball championships held during 2015: Eurobasket, Asia
Cup, FIBA Americas, Afrobasket and FIBA Oceania. A total of 231 matches were played
(n= 462) (Table 1). The FIBA Oceania championship was eliminated from the final
sample as the competition characteristics are different from those of the rest of the
championships (only two teams take part and they play a two game home-and-away
playoff). The FIBA competitions are characterised as having the World Championship
format that is with just one match. The championships analysed were organised as a first
phase round robin tournament in groups, and then a single elimination tournament among
the qualified teams. The data were obtained from the official web page of the International
Basketball Federation (FIBA) (http://www.fiba.com/es).
Table 1. Characteristics of the sample data
Cases Matches %
Eurobasket 158 79 34
Afrobasket 96 48 21
FIBA America 80 40 17
Asia Cup 124 62 27
FIBA Oceania 4 2 01
Total 462 231 100
Variables
The absolute game-related statistics gathered were: ball possessions, point difference,
points scored, 2-point and 3-point field-goals (both successful and unsuccessful), free-
throws (both successful and unsuccessful), offensive and defensive rebounds, steals,
turnovers, assists, blocks (both performed and received), personal fouls (both committed
and received) and evaluation. To avoid the contaminating effect of the game pace, the
variables were normalised for 100 ball possessions per match (García, Ibáñez, Martínez
De Santos, Leite, & Sampaio, 2013; Ibáñez et al., 2003). The ball possession equation
(BP) was calculated according to Oliver (2004):
BP = (field-goals attempted) – (offensive rebounds) + (turnovers) + 0.4 x (free-throws
attempted).
Procedure
The data were collected by the official technicians from each competition. It has been
shown that data obtained with this methodology in different contexts have very good
reliability (García, Ibáñez, Gómez, & Sampaio, 2014; Sampaio, et al., 2015). Even so, to
44Ibáñez, S.J.; González-Espinosa, S.; Feu, S., & García-Rubio, J. (2018). Basketball without borders?
Similarities and differences among Continental Basketball Championships. RICYDE. Revista internacional
de ciencias del deporte, 51(14), 42-54. https://doi.org/10.5232/ricyde2018.05104
guarantee their validity, a subsample of five matches was analysed by two expert
observers (basketball coaches with more than five years experience) using the multirater
κfree index (Randolph, 2005). The results show the high level of inter-rater reliability of
the data collected. The Kappa coefficients obtained was 1.0 for all the variables except
assists (.91).
Data analysis
Firstly a descriptive analysis of the sample was performed, using the mean and standard
deviation, to show the characteristics of each of the different competitions. Performance
profiles were also performed to complete the descriptive analysis (O'Donoghue, 2005).
Then a one-way ANOVA was carried out to identify the differences between
competitions in the analysed variables. Bonferroni’s post-hoc was used for the pairwise
comparisons (Field, 2013). The effects sizes were calculated using Cohen’s d for the F
statistic. Effect sizes between .20 and .50 were considered small, between .50 and .80
were considered medium and greater than .80 were considered large (Thalheimer & Cook,
2002). Finally, the discriminant analysis was carried out to identify the TTPI which best
characterise each one of the continental championships (Ntoumanis, 2001). The structural
coefficients (SCs) with values of over |.30| made it possible to identify the variables that
best contributed to differentiating among the continental championships (Tabachnick,
Fidell, & Osterlind, 2001). The greater the SC value, the greater the contribution of this
performance indicator to the discriminant function. The centroids indicate the
championship with the greatest contribution from each performance indicator. All the
analyses were carried out with the IBM SPSS 21.0 statistical package (IBM Corp.,
Armonk, NY, USA).
Results
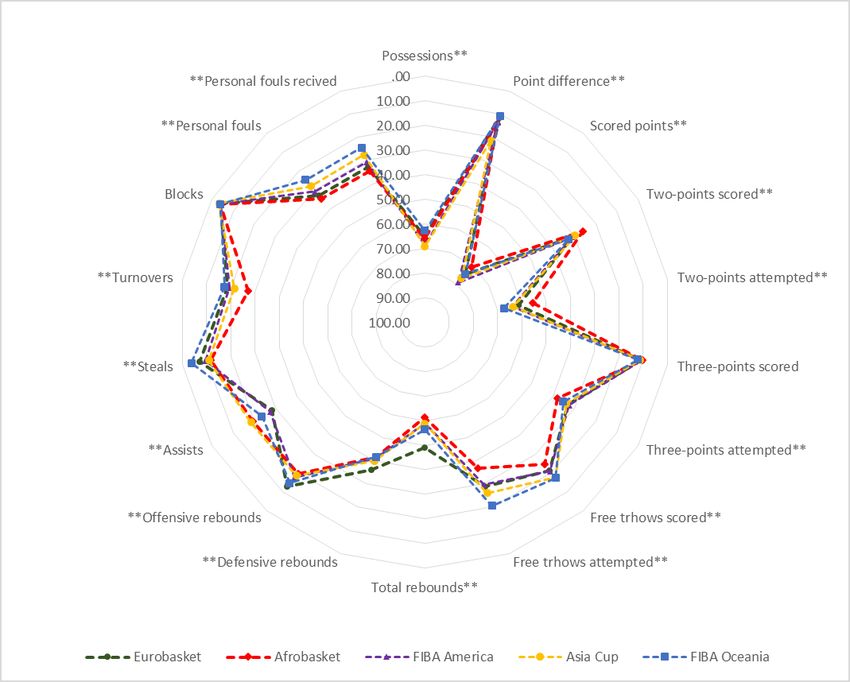
In the first place, Table 2 shows the descriptive statistics as a function of the competition,
and Figure 1 presents a visual image of the performance profiles. It can be seen that the
fastest basketball was played in the Asia Cup, with more possessions, but not more points
scored, which corresponded to the FIBA America. It was also the Asia Cup which showed
the greatest point differences between winners and losers, while in FIBA Oceania and
Eurobasket the teams were more equal. Eurobasket was the championship which
presented the most assists, and the second to last in number of turnovers, behind FIBA
Oceania.
Table 2. Means, standard deviations and differences among groups as a function of the competition
Eurobasket Afrobasket FIBA America Asia Cup FIBA Oceania
M SD M SD M SD M SD M SD
Possessions 65.01 5.83 66.18 7.81 68.66 7.11 69.12 8.35 62.85 7.17
Point difference 11.61 9.30 14.42 10.96 13.78 10.03 21.51 17.74 11.00 1.15
Points scored 74.82 11.82 70.81 12.23 78.96 13.70 76.83 16.10 74.50 12.69
Successful 2P field-goals 30.76 7.22 26.11 6.81 31.03 6.34 29.68 6.66 32.58 6.91
Unsuccessful 2P field-goals 61.46 9.52 55.48 8.96 63.81 9.39 63.69 9.18 67.44 5.40
Successful 3P field-goals 10.86 4.10 10.23 4.52 10.73 4.67 11.22 4.10 12.19 2.11
Unsuccessful 3P field-goals 33.00 9.00 37.98 8.95 32.39 8.21 33.68 7.64 35.25 8.53
Successful free-throws 21.18 8.51 24.50 9.96 20.89 8.07 17.63 7.42 17.41 12.31
Unsuccessful free-throws 28.78 10.05 36.95 13.60 29.77 10.50 26.02 10.46 20.52 13.48
Total Rebounds 49.06 9.16 61.46 12.11 58.75 11.06 58.82 10.38 56.32 16.76
Defensive Rebounds 36.05 7.73 41.74 8.97 41.20 8.26 40.10 7.48 41.71 15.71
45Ibáñez, S.J.; González-Espinosa, S.; Feu, S., & García-Rubio, J. (2018). Basketball without borders?
Similarities and differences among Continental Basketball Championships. RICYDE. Revista internacional
de ciencias del deporte, 51(14), 42-54. https://doi.org/10.5232/ricyde2018.05104
Offensive Rebounds 13.01 5.17 19.73 7.11 17.55 6.06 18.72 6.56 14.61 3.52
Assists 28.13 7.16 19.18 6.37 27.35 6.48 18.44 7.21 23.47 2.05
Steals 7.03 3.38 11.49 4.72 9.44 3.73 10.95 4.15 3.72 3.61
Turnovers 18.67 6.57 27.08 8.67 19.33 6.97 21.32 7.48 17.35 7.59
Blocks 3.86 2.95 3.98 2.65 4.11 2.77 3.59 2.66 4.01 3.96
Fouls Committed 33.05 6.45 34.64 8.59 30.64 6.24 27.88 7.76 24.50 5.14
Fouls Received 32.87 6.39 34.67 8.58 30.75 6.72 27.74 7.18 24.67 6.08
Efficiency Index 140.26 35.43 112.63 35.69 132.21 33.13 116.44 42.74 128.43 47.17
The performance profiles in each competition show that, although it is the same sport
played in different continental championships, there are differences in the performance
indicators which specifically define what each competition is like in each region of the
world. This was confirmed in the subsequent inferential analysis.
** p< .001
Figure 1 Performance profiles of each championship analysed.
46Ibáñez, S.J.; González-Espinosa, S.; Feu, S., & García-Rubio, J. (2018). Basketball without borders?
Similarities and differences among Continental Basketball Championships. RICYDE. Revista internacional
de ciencias del deporte, 51(14), 42-54. https://doi.org/10.5232/ricyde2018.05104
Table 3 shows the results of the ANOVA and post-hoc test with the effect sizes. It can be
seen that the most similar championships regarding performance indicators were those of
America and Asia. In contrast, the championships which differed most were those of
Europe and Africa. Similarly, the performance indicator which most differentiated among
the championships and presented the largest effect size was that of assists. The TTPI that
differentiated least among the different teams were 3 point shots scored and blocks, which
showed no statistically significant differences.
Table 3. Results of the differences among groups
ANOVA Post Hoc
Euro-Afro Euro-Amer Euro-Asia Afro-Amer Afro-Asia Amer-Asia
F P p d p d p d p d p d p d
Possessions 9.249 .00 1.000 0.16 .002 0.56 .000 0.57 .177 0.33 .024 0.36 1.000 0.05
Point difference 13.703 .00 .455 0.27 1.000 0.22 .000 0.69 .455 0.06 .001 0.48 .000 0.53
Points scored 5.850 .00 .155 0.33 .142 0.32 1.000 0.14 .000 0.62 .013 0.42 1.000 0.14
Successful 2P field-goals 10.980 .00 .000 0.66 1.000 0.03 1.000 0.15 .000 0.74 .001 0.53 1.000 0.20
Unsuccessful 2P field-goals 17.761 .00 .000 0.64 .394 0.24 .235 0.23 .000 0.9 .000 0.9 1.000 0.01
Successful 3P field-goals .591 .62 1.000 0.14 1.000 0.02 1.000 0.08 1.000 0.10 1.000 0.22 1.000 0.11
Unsuccessful 3P field-goals 8.569 .00 .000 0.55 1.000 0.07 1.000 0.08 .000 0.65 .001 0.51 1.000 0.16
Successful free-throws 11.009 .00 .023 0.35 1.000 0.03 .005 0.44 .042 0.39 .000 0.78 .061 0.42
Unsuccessful free-throws 17.506 .00 .000 0.68 1.000 0.09 .270 0.26 .000 0.59 .000 0.90 .132 0.35
Total Rebounds 35.518 .00 .000 1.15 .000 0.85 .000 0.94 .748 0.23 .493 0.23 1.000 0.06
Defensive Rebounds 13.891 .00 .000 0.58 .000 0.54 .000 0.44 1.000 0.06 1.000 0.19 1.000 0.13
Offensive Rebounds 30.200 .00 .000 1.08 .000 0.80 .000 0.96 .161 0.33 1.000 0.14 1.000 0.18
Assists 70.379 .00 .000 1.32 1.000 0.11 .000 1.34 .000 1.27 1.000 0.10 .000 1.29
Steals 33.312. .00 .000 1.08 .000 0.67 .000 1.03 .003 0.48 1.000 0.12 .073 0.38
Turnovers 26.941 .00 .000 1.09 1.000 0.09 .015 0.37 .000 0.98 .000 0.71 .336 0.27
Blocks .650 .58 1.000 0.04 1.000 0.08 1.000 0.09 1.000 0.04 1.000 0.14 1.000 0.19
Fouls Committed 18.167 .00 .930 0.20 .081 0.37 .000 0.72 .003 0.53 .000 0.82 .054 0.39
Fouls Received 19.163 .00 .411 0.23 .171 0.32 .000 0.75 .002 0.50 .000 0.87 .000 0.43
Efficiency Indee 15.178 .00 .000 0.77 .875 0.23 .000 0.60 .003 0.56 1.000 0.09 .011 0.41
p< .05 in bold
Table 4 shows the results of the discriminant analysis which identified three statistically
significant functions. Function 1 shows the importance of assists for the prediction of
belonging to Eurobasket (positive values of the centroids). Steals, total rebounds and
offensive rebounds make possible the prediction of belonging to the Asia Cup and
Afrobasket (negative values). The second function emphasises the 1 point throws scored
and attempted, turnovers and fouls committed and received predicting belonging to
Afrobasket. Finally, the third function highlights total and defensive and offensive
rebounds, assists and possessions to discriminate the teams from FIBA America from the
rest.
47Ibáñez, S.J.; González-Espinosa, S.; Feu, S., & García-Rubio, J. (2018). Basketball without borders?
Similarities and differences among Continental Basketball Championships. RICYDE. Revista internacional
de ciencias del deporte, 51(14), 42-54. https://doi.org/10.5232/ricyde2018.05104
Table 4. Structural Coefficients in FIBA continental championships
SCs
Function 1 Function 2 Function 3
Possessions -.12 -.22 .34
Successful 2P field-goals .14 -.27 .19
Unsuccessful 2P field-goals .07 -.48 .30
Successful 3P field-goals .01 -.09 -.01
Unsuccessful 3P field-goals -.11 .27 -.18
Successful free-throws .01 .41 .01
Unsuccessful free-throws -.07 .50 .04
Total Rebounds -.34 .09 .53
Defensive Rebounds -.19 .07 .43
Offensive Rebounds -.33 .06 .35
Assists .51 .09 .48
Steals -.26 .38 -.18
Turnovers -.36 .06 .19
Blocks -.00 .06 .14
Fouls Committed .09 .49 -.19
Fouls Received .08 .51 -.16
Canonical Correlation 0.793* 0.558* 0.345*
1.698 .452 .135
Eigenvalue
p: *Ibáñez, S.J.; González-Espinosa, S.; Feu, S., & García-Rubio, J. (2018). Basketball without borders?
Similarities and differences among Continental Basketball Championships. RICYDE. Revista internacional
de ciencias del deporte, 51(14), 42-54. https://doi.org/10.5232/ricyde2018.05104
Figure 2. Territorial map of all the matches in the continental championships.
Discussion
The objective of the present study was to analyse the different continental basketball
championships using TTPI, regarding differences and similarities among them. The
results show that although the performance profiles are very similar among all the
championships, some differences have been found. The main ones are between
Eurobasket and the Asia Cup and Afrobasket championships, with the FIBA America
championship revealing values somewhere in the middle.
Basketball is manifested in different ways according to the gender of the participants, the
competitive level and the type of competition (García et al., 2010). Differences have been
found in all the TTPI for the continental championships analysed, except in the three-
point throws scored and blocks. In fact, the scientific literature has identified different
performance indicators which characterise competitions, and found that some are
systematically of maximal importance in the competitions analysed to differentiate
between the winners and the losers, like for example two-point throws scored and
defensive rebounds (Ibáñez et al., 2003; Sampaio, et al., 2015). These performance
indicators change when compare bests and worsts teams, being assists, steals and blocks
are the most important (Ibáñez et al., 2008). Moreover, differences have been found as a
function of the situational variables of the competition, which is also evident in this study.
49Ibáñez, S.J.; González-Espinosa, S.; Feu, S., & García-Rubio, J. (2018). Basketball without borders?
Similarities and differences among Continental Basketball Championships. RICYDE. Revista internacional
de ciencias del deporte, 51(14), 42-54. https://doi.org/10.5232/ricyde2018.05104
The discriminant analysis maximises the importance of assists in the European
championship. Assists are important in European leagues for winning matches, and are
an indicator of team play as they are passes which permit immediate scoring. Thus the
teams that participate in Eurobasket play more as a team than those that participate in the
rest of the continental championships. This is corroborated in studies that analyse the
European leagues, like the ACB league (Spain) (García et al., 2013; Puente et al., 2015).
The importance of assists has also been shown over time in the Euroleague (Štrumbelj,
Vračar, Robnik-Šikonja, Dežman, & Erčulj, 2013) or Eurobasket (Sampaio & Leite,
2006). The main European competitions reveal the importance of assists reflecting the
playing style of the teams participating in the continental competition. Assists show team
work and also generate the opportunities to score and overcome the opponent’s defensive
strategies (García et al., 2014).
In the Asia Cup and Afrobasket championships, the most important techniques are total
and offensive rebounds and steals. The steals indicate the defensive level of the team,
with players who are very motivated in defence and expend a great deal of energy in this
action (Gómez, Lorenzo, & Sampaio, 2009). Steals also mark the difference in level
between the participating teams. Defensive rebounds show the defensive level of the
team, as they are achieved thanks to the mistakes made by the opponents caused by the
excellent play by the defenders. In this case total and offensive rebounds are the actions
which characterise the Asian and African championships. Offensive rebounds are a
second opportunity for the attacking team to score, mainly due to mistakes in completing
defensive rebounds showing a weakness in the defensive players. Similarly efforts to steal
the ball in defence can leave the players badly situated for the following action, making
it easier for the attackers to achieve an offensive rebound.
Following this same line of reasoning, another of the factors to be taken into account in
the Asian championship is the difference among competitors. It has been found that in
the European competition in 2011, 2013 and 2015, 76% of the matches were close
matches (a score difference of 15 or less points) and none of them very one-sided (a score
difference of more than 40 points) (Madarame, 2017). During these same years in the
Asian competition, only 45% of the matches were close and 15% were very one-sided
(Madarame, 2017). The championships of Asia, Africa and America present a faster game
pace than Eurobasket (according to the number of possessions), which imply that teams
make more mistakes than in matches with a slower pace (according to number of
turnovers) (Sampaio, Lago & Drinkwater, 2010). The top ranked teams play with fewer
possessions but with a higher offensive efficiency coefficient (Ibáñez et al., 2003). The
teams normally use the strategy of playing at a slower pace when they are facing close or
important matches (García et al., 2013; Sampaio & Janeira, 2003), which occurs more
frequently in Europe, with differences between winners and losers of 11.61 points,
whereas in the Asia Cup this difference rises to 21.51 points. The European championship
shows a mean of 1.4 field goals per assist, while the African value is 1.8 and the Asian
2.2. This demonstrates that the teams achieve more points after an individual action or an
offensive rebound, and in these championships team work is less important.
The American championship shows intermediate values compared with the above
mentioned championships. Studies on American basketball, to be precise on the most
important league in the world the NBA, have found that the winning teams are
characterised by better offensive efficiency, especially in the points scored in the third
quarter, as well as standing out regarding fouls and steals (Mikołajec et al., 2013). In other
leagues on the American continent, it has been shown that efficiency in throws, rebounds,
50Ibáñez, S.J.; González-Espinosa, S.; Feu, S., & García-Rubio, J. (2018). Basketball without borders?
Similarities and differences among Continental Basketball Championships. RICYDE. Revista internacional
de ciencias del deporte, 51(14), 42-54. https://doi.org/10.5232/ricyde2018.05104
steals and assists discriminate the winner from the losers in the Brazilian league (De Rose,
2004), or that in Chilean basketball many points are scored per possession (Fernández,
Ortega, Ubal, Gómez, & Ibáñez, 2010). In the Costa Rican league the importance of
throws and the better performance of the winning team in the second half of the match
were identified (Romero, Bonilla, Cabrera, & Ureña, 2011). Studies on the different
American leagues are scarce with the exception of the NBA, but those which have been
found highlight the importance of goals attempted, and the American championship is the
one that presents the highest percentage of field goals attempted, above that of
Eurobasket.
Conclusions and practical applications
The present study identifies the performance profiles of each continental championship,
and has discovered that each one has a specific performance profile, meaning that the
game is played differently in each region of the world. In short, basketball is a dynamic
sport which changes according to the part of the world in which it is played. Although it
is the same sport, played to the same rules, the determinants of success or failure and the
playing styles are different on each continent. The results indicate that in Europe
basketball teams are more similar in level and team work (assists) is of paramount
importance. In closer competitions, like Eurobasket, the games are played with a greater
control of the pace, and less possessions. In the rest of the continents basketball seems to
be less organised, with the individual player gaining greater importance than the team and
where more mistakes are made (total rebounds, steals, evaluation...).
The results of this study can help national team managers to better prepare for the home
competition, and have information on the most important performance indicators at any
one moment. When it comes to playing in world championships, against national teams
from all the continents, like the Olympic Games or the FIBA Basketball World Cup,
coaches can use these data to get to know their opponents better according to the continent
they come from and thus prepare the match in a specific and detailed manner.
Limitations.
As a limitation, it should be mentioned that this study has a purely quantitative approach,
which provides valid and objective information, but it should be complemented with
another type of qualitative analysis to contribute information about how and why.
Furthermore, a detailed study of the performance indicators, according to the final result
of the match or the final point difference on the scoreboard, would provide additional
information which would be of use to coaches.
Acknowledgements
This study has been partially subsidised by Aid for Research Groups [Ayuda a los
Grupos de Investigación] (GR15122) from the Junta de Extremadura (Consejería de
Economía e Infraestructuras); with a contribution from the European Union through
FEDER.
References
Ato, M.; López-García, J. J., & Benavente, A. (2013). Un sistema de clasificación de
los diseños de investigación en psicología. Anales de Psicología, 29(3), 1038-
1059.
https://doi.org/10.6018/analesps.29.3.178511
51Ibáñez, S.J.; González-Espinosa, S.; Feu, S., & García-Rubio, J. (2018). Basketball without borders?
Similarities and differences among Continental Basketball Championships. RICYDE. Revista internacional
de ciencias del deporte, 51(14), 42-54. https://doi.org/10.5232/ricyde2018.05104
De Rose, D. (2004). Statistical analysis of basketball performance indicators
according to home/away games and winning and losing teams. Journal of Human
Movement Studies, 47, 327-336.
Drust, B. (2010). Performance analysis research: meeting the challenge. Journal of
Sport Science, 28(9), 1-2.
https://doi.org/10.1080/02640411003740769
Fernández, R.; Ortega, E.; Ubal, M.; Gómez, M. A., & Ibáñez, S. J. (2010). Estudio
descriptivo de la utilización de factores defensivos en la división mayor del
básquetbol chileno (Dimayor). Kronos, 9(17), 68-75.
Field, A. (2013). Discovering statistics using IBM SPSS statistics. London: SAGE
Publications Ltd.
García, J.; Ibáñez, S. J.; Gómez, M. A., & Sampaio, J. (2014). Basketball Game-
related statistics discriminating ACB league teams according to game location,
game outcome and final score differences. International Journal of Performance
Analysis in Sport, 14(2), 443-452.
García, J.; Ibáñez, S. J.; Martinez De Santos, R.; Leite, N., & Sampaio, J. (2013).
Identifying basketball performance indicators in regular season and playoff
games. Journal of Human Kinetics, 36(1), 161-168.
https://doi.org/10.2478/hukin-2013-0016
García, J.; Ibáñez, S. J.; Parejo, I.; Cañadas, M., & Feu, S. (2010). Análisis de los
Campeonatos del Mundo de baloncesto masculino (2002 y 2006). Diferencias entre
expertos y noveles (sénior y junior). Motricidad. European Journal of Human
Movement (24), 133-145.
García, J.; Sáez, J.; Ibáñez, S. J.; Parejo, I., & Cañadas, M. (2009). Home advantage
analysis in ACB league in season 2007-2008. Revista de Psicología del Deporte,
18, 331-335.
García, J.; Cañadas, M., & Antúnez, A. (2015). Efectos de la asistencia, densidad de
la misma y la capacidad del pabellón en las victorias conseguidas en casa en
función de la conferencia en la NBA. [Effects of attendance, crowd density and
capacity of arena in home advantage according to NBA conference. Cuadernos de
Psicología del Deporte, 15(3), 175-180.
https://doi.org/10.4321/S1578-84232015000300018
Gómez, M.; Lorenzo, A., & Sampaio, J. (2009). Análisis del rendimiento en baloncesto
¿Es posible predecir los resultados. Sevilla: Wanceulen.
Gómez, M. A.; Lorenzo, A.; Ortega, E.; Sampaio, J., & Ibáñez, S. J. (2009). Game
related statistics discriminating between starters and nonstarters players in
Women’s National Basketball Association League (WNBA). Journal of Sports
Science and Medicine, 8, 278-283.
Gómez, M. A.; Lorenzo, A.; Sampaio, J.; Ibáñez, S. J., & Ortega, E. (2008). Game-
related statistics that discriminated winning and losing teams from the Spanish
men's professional basketball teams. Collegium Antropologicum, 32(2), 451-456.
Hughes, M.; Evans, S., & Wells, J. (2001). Establishing normative profiles in
performance analysis. International Journal of Performance Analysis in Sport, 1(1),
1-26.
Hughes, M., & Franks, I. (2007). The essentials of performance analysis: an
introduction. London: Routledge.
Ibáñez, S. J.; Feu, S., & Dorado, G. (2003). Análisis de las diferencias en el juego en
función del género y categoría. Iberian Congress on Basketball Research, 2, 73-
88.
52Ibáñez, S.J.; González-Espinosa, S.; Feu, S., & García-Rubio, J. (2018). Basketball without borders?
Similarities and differences among Continental Basketball Championships. RICYDE. Revista internacional
de ciencias del deporte, 51(14), 42-54. https://doi.org/10.5232/ricyde2018.05104
Ibáñez, S. J.; García, J.; Feu, S.; Parejo, I., & Cañadas, M. (2009). Shot efficacy in
the NBA: A multifactorial analysis. Cultura, Ciencia y Deporte, 10, 39-47.
Ibáñez, S. J.; Sáenz-López, P.; Giménez, J.; Sampaio, J., & Janeira, M. A. (2003).
Game statistics discriminating the final outcome of Junior World Basketball
Championship matches (Portugal’99). Journal Human Movement Studies, 45, 01-
19.
Ibáñez, S. J.; Sampaio, J.; Feu, S.; Lorenzo, A.; Gómez, M. A., & Ortega, E. (2008).
Basketball game-related statistics that discriminate between teams’ season long
success. European Journal of Sport Science, 8(6), 1-4.
Lago-Peñas, C., & Lago-Ballesteros, J. (2011). Game location and team quality
effects on performance profiles in professional soccer. Journal of Sports Science &
Medicine, 10(3), 465.
Liu, H.; Yi, Q.; Giménez, J.-V.; Gómez, M.-A., & Lago-Peñas, C. (2015). Performance
profiles of football teams in the UEFA Champions League considering situational
efficiency. International Journal of Performance Analysis in Sport, 15(1), 371-390.
Madarame, H. (2017). Game-Related Statistics Which Discriminate Between Winning
and Losing Teams in Asian and European Men’s Basketball Championships. Asian
Journal of Sports Medicine (In Press).
https://doi.org/10.5812/asjsm.42727
Mikołajec, K.; Maszczyk, A., & Zając, T. (2013). Game indicators determining sports
performance in the NBA. Journal of Human Kinetics, 37(1), 145-151.
https://doi.org/10.2478/hukin-2013-0035
Ntoumanis, N. (2001). A step-by-step guide to SPSS for sport and exercise studies.
London: Routledge
O'Donoghue, P. (2005). Normative profiles of sports performance. International
Journal of Performance Analysis in Sport, 5(1), 104-119.
Oliver, D. (2004). Basketball on paper: rules and tools for performance analysis:
Potomac Books, Inc.
Puente, C.; Coso, J. D.; Salinero, J. J., & Abián-Vicén, J. (2015). Basketball
performance indicators during the ACB regular season from 2003 to 2013.
International Journal of Performance Analysis in Sport, 15(3), 935-948.
https://doi.org/10.1080/24748668.2015.11868842
Randolph, J. J. (2005). Free-Marginal Multirater Kappa (multirater κfree): An
Alternative to Fleiss’ Fixed-Marginal Multirater Kappa. Paper presented at the
Joensuu Learning and Instruction Symposium 2005, Joensuu, Finland.
Ribeiro, H. V.; Mukherjee, S., & Zeng, X. H. T. (2016). The Advantage of Playing
Home in NBA: Microscopic, Team-Specific and Evolving Features. PloS One, 11(3).
https://doi.org/10.1371/journal.pone.0152440
Romero, L. B.; Bonilla, P. U.; Cabrera, J. S., & Ureña, B. S. (2011). Perfil de
rendimiento técnico del equipo tetracampeón de la liga superior de baloncesto de
Costa Rica. MHSALUD: Revista en Ciencias del Movimiento Humano y Salud, 8(2).
Sampaio, J.; Ibáñez, S. J., & Feu, S. (2004). Discriminative power of basketball
game-related statistics by level of competition and sex. Perceptual and Motor Skills,
99(3), 1231-1238.
https://doi.org/10.2466/pms.99.3f.1231-1238
53Ibáñez, S.J.; González-Espinosa, S.; Feu, S., & García-Rubio, J. (2018). Basketball without borders?
Similarities and differences among Continental Basketball Championships. RICYDE. Revista internacional
de ciencias del deporte, 51(14), 42-54. https://doi.org/10.5232/ricyde2018.05104
Sampaio, J., & Janeira, M. (2003). Statistical analyses of basketball team
performance: understanding teams' wins and losses according to a different index
of ball possessions. International Journal of Performance Analysis in Sport, 3(1),
40-49.
Sampaio, J.; Lago, C., & Drinkwater, E. J. (2010). Explanations for the United States
of America's dominance in basketball at the Beijing Olympic Games (2008). Journal
of Sports Sciences, 28(2), 147-152.
https://doi.org/10.1080/02640410903380486
Sampaio, J., & Leite, N. M. C. (2006). ¿Por qué ganaron o perdieron los partidos de
baloncesto los equipos que participaron en el Eurobasket 2005? Kronos, 5(9), 67-
73.
Sampaio, J.; McGarry, T.; Calleja-González, J.; Jiménez, S.; Schelling, X., &
Balciunas, M. (2015). Exploring game performance in the National Basketball
Association using player tracking data. PloS-One, 10(7).
https://doi.org/10.1371/journal.pone.0132894
Štrumbelj, E.; Vračar, P.; Robnik-Šikonja, M.; Dežman, B., & Erčulj, F. (2013). A
decade of euroleague basketball: An analysis of trends and recent rule change
effects. Journal of Human Kinetics, 38, 183-189.
https://doi.org/10.2478/hukin-2013-0058
Tabachnick, B. G.; Fidell, L. S., & Osterlind, S. J. (2001). Using multivariate statistics.
Boston: Pearson.
Thalheimer, W., & Cook, S. (2002). How to calculate effect sizes from published
research: A simplified methodology. Work-Learning Research, 1-9. Retrieved
December 1, 2016 from: http://work-learning.com/effect_sizes.htm
54You can also read