Rio State Fiscal Efficiency for Quality of Public Service Delivery Development Policy Loan - BRAZIL
←
→
Page content transcription
If your browser does not render page correctly, please read the page content below
BRAZIL

     Rio State Fiscal Efficiency for
     Quality of Public Service Delivery
     Development Policy Loan
     DPL III

Report No. 158234
MAY 10, 2021
© 2021 International Bank for Reconstruction and Development / The World Bank
1818 H Street NW
Washington DC 20433
Telephone: 202-473-1000
Internet: www.worldbank.org

Attribution—Please cite the work as follows:
World Bank. 2021. Brazil—Rio State Fiscal Efficiency for Quality of Public Service Delivery Development Policy Loan
DPL III. Independent Evaluation Group, Project Performance Assessment Report 158234. Washington, DC: World
Bank.

This work is a product of the staff of The World Bank with external contributions. The findings, interpretations, and
conclusions expressed in this work do not necessarily reflect the views of The World Bank, its Board of Executive
Directors, or the governments they represent.
The World Bank does not guarantee the accuracy of the data included in this work. The boundaries, colors,
denominations, and other information shown on any map in this work do not imply any judgment on the part of
The World Bank concerning the legal status of any territory or the endorsement or acceptance of such boundaries.

RIGHTS AND PERMISSIONS
The material in this work is subject to copyright. Because The World Bank encourages dissemination of its
knowledge, this work may be reproduced, in whole or in part, for noncommercial purposes as long as full
attribution to this work is given.

Any queries on rights and licenses, including subsidiary rights, should be addressed to
World Bank Publications, The World Bank Group, 1818 H Street NW, Washington, DC 20433, USA; fax: 202-522-
2625; e-mail: pubrights@worldbank.org.
Report No.: 158234

                PROJECT PERFORMANCE ASSESSMENT REPORT

                                 BRAZIL

 RIO STATE FISCAL EFFICIENCY FOR QUALITY OF PUBLIC SERVICE DELIVERY
                 DEVELOPMENT POLICY LOAN (DPL III)
                             (IBRD-81910)

                               May 10, 2021

Human Development and Economic Management

Independent Evaluation Group
Abbreviations
DPL               development policy loan
GDP               gross domestic product
ICMS              tax on the movement of goods, interstate and intermunicipal transport, and
                  communication services
IDEB              Index of Development of Basic Education
IEG               Independent Evaluation Group
ITD               inheritance, estate, and donations tax
PPAR              Project Performance Assessment Report
SEFAZ             Secretaria de Estado da Fazenda (state Secretariat of Finance)
TADAT             Tax Administration Diagnostic Assessment Tool

All dollar amounts are US dollars unless otherwise indicated.

IEG Management and PPAR Team

Director-General, Independent Evaluation                                               Ms. Alison Evans
Director, Human Development and Economic Management                               Mr. Oscar Calvo-Gonzalez
Manager, Country Programs and Economic Management                                  Mr. Jeffrey Allen Chelsky
Task Manager                                                                      Mr. Konstantin Atanesyan
This report was prepared by Konstantin Atanesyan (Senior Evaluation Officer), Jorge Garcia-Garcia and Sol Garson
Braule Pinto (consultants). The report was peer reviewed by Richard Stern and panel reviewed by Basil Kavalsky.
Oksana Gryshkevych provided technical support and Dung Thi Kim Chu provided administrative support.

                                                        ii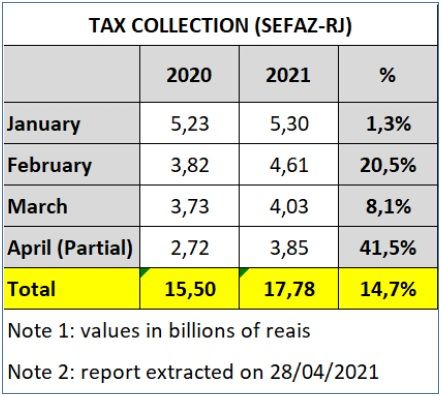
Contents
Abbreviations ..................................................................................................................................................... ii
Data........................................................................................................................................................................ v
Summary ............................................................................................................................................................vii
1. Background, Context, and Design .........................................................................................................1
     World Bank Group Lending to the State of Rio de Janeiro ........................................................... 1
     Background and Context........................................................................................................................... 1
     Objective, Design, and Financing ...........................................................................................................3
         Objective ....................................................................................................................................................................... 3
         Design ............................................................................................................................................................................4
         Financing .......................................................................................................................................................................4
2. What Worked, What Didn’t Work, and Why? ...................................................................................4
     Results..............................................................................................................................................................4
         Policy Area I: Tax Administration ..........................................................................................................................4
         Policy Area II: Public Financial Management .................................................................................................... 8
         Policy Area III: Education and Health ................................................................................................................. 11
     Design and Preparation ........................................................................................................................... 15
     Implementation and Supervision.......................................................................................................... 17
3. Lessons.......................................................................................................................................................... 17
References ........................................................................................................................................................ 21

Tables
Table 1.1. World Bank DPL and Technical Assistance Loans to the State and Municipality of
Rio de Janeiro, 2010–18.................................................................................................................................... 1
Table 1.2. Fiscal Balance for the Federal Government, 2010–17 .........................................................2
Table 2.1. Results Indicators for Strengthening Tax Administration ..................................................6
Table 2.2. Tax Arrears, 2015–17 .....................................................................................................................8
Table 2.3. Results Indicators for Public Financial Management ....................................................... 10
Table 2.4. State of Rio de Janeiro Investment Budget Execution, 2010–17................................... 10
Table 2.5. Results Indicators for Education ............................................................................................. 13
Table 2.6. Results Indicators for Health .................................................................................................... 14

                                                                                            iii
Appendixes
Appendix A. Ratings ..................................................................................................................................... 22
Appendix B. Methods and Evidence....................................................................................................... 39
Appendix C. Policy and Results Matrices .............................................................................................. 40
Appendix D. Fiscal Performance of the State of Rio de Janeiro, 2007–19 ............................... 44
Appendix E. Borrower Comments ........................................................................................................... 51
ivData
This is a Project Performance Assessment Report by the Independent Evaluation Group
of the World Bank Group for the Fiscal Efficiency for Quality of Public Service Delivery
Development Policy Loan III (P126465) to the state of Rio de Janeiro for $300 million.
Following standard Independent Evaluation Group procedure, copies of the draft
Project Performance Assessment Report were shared with relevant government officials
for their review and comment. Comments are included in appendix E.
Basic Data
International Bank for
Reconstruction and
Country Brazil Financing source Development
Global Practice Governance World Bank financing $300 million
commitment
Project name Fiscal Efficiency for Quality Actual amount disbursed $300 million
of Public Service Delivery
Development Policy Loan
Project ID P126465 Programmatic series No
Financing instrument Development policy lending
Dates
Event Original Date Actual Date
Approval 08/30/2012 08/30/2012
Effectiveness 11/30/2012 11/16/2012
Closing 01/31/2014 01/31/2014
Key Staff Responsible
Management Appraisal Completion
Project Team Leader Roland N. Clarke Roland N. Clarke
Practice Manager Arturo Herrera Gutiérrez Arturo Herrera Gutiérrez
Sector Director or Senior Global Practice Rodrigo A. Chaves Mario Marcel Cullel
Director
Country Director Deborah L. Wetzel Deborah L. Wetzel
vSummary
Background and Description
This is a Project Performance Assessment Report by the Independent Evaluation Group
(IEG) of the World Bank Group for the Fiscal Efficiency for Quality of Public Service
Delivery Development Policy Loan (DPL) III (P126465) to the state of Rio de Janeiro for
$300 million, approved in August 2012 and closed in January 2014.
Results
The program covered three policy areas: (i) tax administration, (ii) public financial
management, and (iii) education and health. It achieved some of its objectives and
targets in the short term (in fiscal years 2013–14), but these achievements were not
sustained.
On tax administration, the Rio state government (the state) established the tax ledger
(single account) and introduced performance indicators for tax collection. The state
collected more revenue from the goods and services tax (ICMS; Imposto sobre
Circulação de Mercadorias e Serviços de Transporte Interestadual e Intermunicipal e de
Comunicação) and the inheritance and donations tax than targeted. However, it is not
evident that the increase can be attributed directly to these initiatives, as the nominal
gross domestic product grew at a faster pace than the nominal increase in tax revenues.
On public financial management, the state adopted a methodology to assess
investment projects, used it to assess three projects out of a targeted five, costed four
large public programs, and took some steps to improve internal audit and control. On
education, the state introduced incentive pay for teachers and selected school authorities
based on merit. Student performance improved, according to the Index of Development
of Basic Education (IDEB; Índice de Desenvolvimento da Educação Básica), following
the trend observed before the reforms were introduced. It is not evident that the changes
in student performance can be attributed to the incentive pay for teachers and merit
selection of school principals as the performance level had been increasing consistently
since 2005, seven years before loan approval. On health, the indicator targets were
achieved—more social organizations managed emergency room operations, and more
hospitals had ombudsman services and infection evaluation committees than before the
loan approval.
The medium- and long-term view presents a different picture. On tax administration,
some aspects of the infrastructure for tax administration improved (such as filing and
paying taxes online), but the ledger was not fully operational as a single account, and
the quality of tax administration has not improved. On public financial management,
viithe state does not use the methodology developed to evaluate projects, the experiment
on costing did not become an effective budget tool, and there is limited evidence of
improvement in the auditing function in the state over the past six years. The related
technical assistance loan (Rio de Janeiro Renovating and Strengthening Public
Management Project, fiscal years 2011–17) that was supposed to help improve public
financial management did not achieve its intended results, and IEG rated its overall
outcome as highly unsatisfactory. On education, overall student performance in the
state improved (consistent with a longer-term trend that started in 2005), but
performance deteriorated relative to other states. The system of incentive pay was
abandoned in 2016 after protests by teachers and students. On health, after seven years
of operation, a 2019 report from the state’s comptroller general found that the coverage
and efficiency of the services provided by social organizations was lower than when the
state managed the services.
Design and Preparation
DPL III was one of several in the state of Rio de Janeiro supporting common reforms.
However, the loans did not have a clear theory of change and did not constitute a
coherent and consistent effort to tackle the targeted problems effectively. The operation
did not make a permanent and significant change in the four areas covered because it
was a short-term operation without adequate complementary support that sought to
solve problems that required deep and sustained change over several years. On tax
administration, the operation did not frame the issues around a coherent framework,
such as the one offered by the Tax Administration Diagnostic Assessment Tool,
developed by a group of donors to assess the tax administration systems of countries
and subnational units. On public financial management, the operation overlooked the
potential short- and medium-term feasibility of selecting public investments based on
costs and benefits and of costing public expenditure programs. On education, the
operation did not pay sufficient attention to the political and administrative barriers to
establishing a payment system for teachers based on incentives and performance. On
health, the operation did not examine the risks to the efficiency of expenditure and
quality of service when subcontracting service delivery to social organizations.
Implementation and Supervision
This review concurs with the Implementation Completion and Results Report, which
stressed that “implementation did not match the ambition of the design” (World Bank
2014, paragraph 48). The operation’s files contain little information about the program’s
performance, and key information, such as performance indicators for revenue
collection, is missing.
Appendix A describes IEG performance ratings.
viiiLessons
This assessment offers the following lessons:
• Subnational programs supporting institutional reform in areas such as tax
administration, public financial management, education, and health require a
long-term strategic vision and sufficient time for implementation. Single-DPL
operations at the state level, like the one reviewed in Rio, are unlikely to achieve
such objectives without significant and sustained complementary support for
capacity building. An investment loan anchored on a longer-term institutional
partnership with state implementing agencies could have been a better tool for
supporting the underlying reforms.
• It was difficult to achieve fiscal sustainability in Rio state by reforming only a
few technical aspects of tax administration without accounting for important
issues such as pensions, dependence on unstable oil revenues, weak institutions,
and chronic corruption.
• An assessment of the Rio state’s fiscal situation, its implementation capacity, and
medium-term perspectives could have improved the program’s design, since the
state was in a dire financial situation and lacked the bandwidth to properly
prepare and execute the 12 loans it was simultaneously negotiating with multiple
lenders.
Oscar Calvo-Gonzalez
Director, Human Development and Economic Management
Independent Evaluation Group
ix1. Background, Context, and Design
World Bank Group Lending to the State of Rio de Janeiro
1.1 The World Bank approved five development policy loans (DPLs) and three
technical assistance loans totaling $2.9 billion to the state of Rio de Janeiro and the
municipality of Rio de Janeiro during 2009–14. Two loans (one DPL and one technical
assistance loan) for $1.1 billion went to the municipality (see table 1.1). Some of the DPLs
covered fiscal issues, and the technical assistance loans supported improvements in
public sector management or public service delivery through territorial development
and management information systems. The loans did not have continuity in their
objectives, instruments, and areas covered, though there was a common implicit goal of
improving fiscal management.
Table 1.1. World Bank DPL and Technical Assistance Loans to the State and
Municipality of Rio de Janeiro, 2010–18
($, millions)
State Municipality
DPL I DPL II DPL III DPL IV TAL I TAL II DPL TAL
P117244 P122391 P126465 P147695 P106768 P126735 P111665 P127245
Fiscal Metropolitan Fiscal Enhancing Public Sector Strengthenin Fiscal Strengthenin
Sustainability Urban and Efficiency Public Modernizatio g Public Consolidatio g Public
, Human Housing for Quality Management n Management n for Sector
Developmen of Public for Service and Efficiency Management
t and Service Delivery Integrated and Growth
Competitiven Delivery Territorial
ess Developmen
t
485 485 300 500 18.6 48 1,045 16.2
FY10 FY11–12 FY12–14 FY13–16 FY10–17 FY14–17 FY10–13 FY13–18
Source: data.worldbank.org.
Note: The bottom row reflects the approval and closing dates. DPL = development policy loan; FY = fiscal year; TAL =
technical assistance loan. Text in bold reflects the DPL discussed in this PPAR.
1.2 DPL I supported measures to improve the efficiency of tax administration by
strengthening capacity in the Revenue Service of SEFAZ (Secretaria de Estado da
Fazenda, State Secretariat of Finance). DPL III aimed to improve tax administration by
establishing a synchronized taxpayer registration system and a results-based
management system.
Background and Context
1.3 Overall country context. The Brazilian economy grew at an uneven pace
between 2007 and 2017. By 2013, economic growth was faltering after a decade of rapid
1growth and social progress, and the economy fell into a deep recession during 2014–16,
when total and real gross domestic product (GDP) per capita fell 6 and 9 percent,
respectively. The country had had large fiscal imbalances since 2013 and primary
deficits since 2014 (see table 1.2). Large interest payments increased the fiscal deficit and
led to high public debt of 93 percent of GDP in 2019 (IMF 2019).
Table 1.2. Fiscal Balance for the Federal Government, 2010–17
(percent of gross domestic product)
Indicator 2010 2011 2012 2013 2014 2015 2016 2017
I. Net operating −1.6 −1.4 −0.8 −2.1 −4.9 −8.5 −7.5 −8.0
balance
II. Primary balance 2.1 3.4 3.0 2.0 −0.5 −0.2 −1.3 −1.2
Sources: National Treasury Secretariat; Federal Bureau of Geography and Statistics; Institute of Applied Economic Research;
and Central Bank of Brazil.
Note: Revenue recorded on cash basis; expenditures recorded on accrual basis.
1.4 State-level context. The state of Rio de Janeiro had Brazil’s second-largest
economy in 2012, with 12 percent of national GDP. Its population of about 16 million
was Brazil’s third largest. Extractive industries accounted for 15 percent of the state’s
gross value added in 2014; that share fell to 5 percent in 2015–17, and the state’s real
output fell 2.9 percent per year.1 In 2015 and 2016, GDP fell in all states, and in 2017, it
fell in Rio de Janeiro, Paraíba, and Sergipe. By 2017, the state of Rio de Janeiro’s GDP
was 8.5 percent lower than in 2014, and its share in Brazil’s GDP fell to 10 percent. The
unemployment rate reached 14.6 percent in the third quarter of 2018 (Fecomercio 2019,
16).
1.5 The economic crisis of 2014–16 worsened the state’s already-poor fiscal situation
(see appendix D). In 2013, current expenses exceeded net current revenue. As the crisis
deepened, the state used extraordinary measures (selling assets, taking judicial deposits)
to mitigate its cash shortfall and pay for growing personnel expenses,2 while a bountiful
supply of credit financed its investments. These arrangements stopped in September
2017 when the state entered the Fiscal Recovery Regime (Regime de Recuperação Fiscal,
Law 159/2017), which offered financial support to states meeting conditions set by the
federal government. The state had an overall positive fiscal balance in 2018–19, but the
amount was insufficient to pay its debt with the National Treasury. Its consolidated debt
reached 2.85 times its net revenue at the end of 2019. In September 2020, the state
governor asked to remain in the Fiscal Recovery Regime until 2023.
1.6 Besides economic and fiscal problems, the state experienced institutional crises
dating back to the mid-1980s. In 2018, federal police initiated an investigation of former
governor Sergio Cabral (2007–14), state secretaries, members of the state parliament, and
some public servants accused of buying political support from parliamentarians in 2007–
218. Governor Cabral was imprisoned, as were all previous governors since 1985. In
August 2020, the Supreme Tribunal of Justice (a federal court) suspended the state
governor and a former federal judge from office on charges of corruption.
1.7 The state’s education system performed poorly between 1990 and 2010. The
politicized process for selecting district supervisors and school principals resulted in a
decline in accountability and the quality of teaching, administration, and school
infrastructure. By 2010, 48 percent of students in upper primary school and 52 percent of
students in secondary school were at least two years behind the appropriate grade for
their age.
1.8 The coverage of health services is subpar, and services are not provided
efficiently. Although the state ranks high in per capita income among the 27 states, its
health indicators place it among the lowest in the country (24–25 of 27), according to the
federal Family Health Program.3
Objective, Design, and Financing
Objective
1.9 The objective of the operation was “to assist the government of Rio de Janeiro in
strengthening its tax administration, improving the efficiency of public financial
management, increasing the quality of public service provision in education and health,
and ensuring that policies adopted are both consistent with priorities of the state
government and with resources likely to be available in the medium term” (World Bank
2012, paragraph 92). The objectives of the stand-alone operation, though wide ranging,
were relevant at the time of the operation and remain so today. They were consistent
with the state governor’s 2007–10 Government Strategic Plan of reforms aimed at
regaining control of the state’s fiscal position, improving public sector management, and
increasing efficiency in the provision of public services.
1.10 The objectives were also consistent with two pillars of the Brazil Country
Partnership Strategy for fiscal years 2012–15: increasing the efficiency of public and
private investment, and improving the provision of public services for low-income
households. The operation was one of several subnational DPLs aimed at promoting
fiscal discipline and better public financial management and service delivery.
1.11 At the same time, the objectives of the program were too ambitious given the
depth and extent of the problems in the areas supported, and it was unlikely that the
targeted progress could have been achieved within the operation’s time frame.
However, there was optimism within the World Bank team that reform was possible
and could last because the state governor at the time had expressed what the team
3considered to be a genuine desire to improve the state’s performance and had appointed
highly qualified professionals to lead key agencies, such as education and tax
administration.
Design
1.12 The program supported three policy areas: tax administration (policy area I),
public financial management (policy area II), and education and health (policy area III).
Policy area I included three prior actions: (i) taking steps required to implement the
Integrated Recording System for Taxes (Sistema de Registro Integrado), (ii) adopting
standards to improve tax collection, and (iii) establishing a process to implement a
results-based management system. Policy area II prior actions included (i) adopting a
methodology and procedures for evaluating, selecting, and approving public investment
projects; (ii) piloting a methodology for costing four public policy programs; and
(iii) restructuring institutional arrangements for internal audits and having an action
plan to carry out the restructuring. Policy area III had four prior actions that consisted of
adopting (i) a merit-based selection process for regional and school directors, and
implementing it; (ii) annual school-level targets for student learning and graduation
rates and a bonus pay system for schools that achieved their targets; (iii) a legal and
administrative framework to assess social organizations to manage public hospitals and
health units; and (iv) regulations defining evaluation mechanisms to transfer bonuses
and monetary incentives to municipalities, municipal hospitals, and regional state
hospitals.
Financing
1.13 The operation was a single-tranche, stand-alone development policy loan for
$300 million financed entirely by the International Bank for Reconstruction and
Development. The operation was approved on August 30, 2012, and closed on January
31, 2014.
2. What Worked, What Didn’t Work, and Why?
Results
2.1 This section reviews the program’s achievements and shortcomings by policy
area.
Policy Area I: Tax Administration
2.2 Overall, the quality of tax administration in the state of Rio de Janeiro did not
improve, despite progress on some aspects of its infrastructure (filing and paying taxes
4online). The objective of policy area I was to “increase state revenue performance”
(World Bank 2012, table 6). To achieve this, the program included three prior actions
requiring the state of Rio de Janeiro to (i) strengthen the implementation of the
synchronized taxpayer registration system (REGIN, Sistema de Registro Integrado,
Integrated Recording System for Taxes); (ii) adopt standards to improve collection of
state taxes, including ICMS; and (iii) establish a process to implement a results-based
management system for tax administration within SEFAZ. The outcome indicators
consisted of (i) revenues from the value-added tax (ICMS); (ii) establishment of a unified
general taxpayer ledger that allowed individual taxpayers to access their accounts; and
(iii) implementation of performance indicators for tax administration—10 indicators in
2012 and 20 in 2013. Of these three indicators, one was partially achieved (ledger), and
two were achieved (tax revenues and performance indicators). (table 2.1).
The program did not support specific actions on audit, reporting and matching, and
withholding, which are important components for efforts to increase tax revenue and
improve tax administration and enforcement (Burman and Slemrod 2013, 173). This
evaluation goes beyond assessing the achievement of program indicators (which were
not sufficient for assessing improvements in tax administration) and examines the
program’s impact on the operation of the ledger, SEFAZ audit practices, and paying
taxes. To complement its analysis, this report uses the findings of the Tax
Administration Diagnostic Assessment Tool (TADAT; prepared for the state of Rio in
2018), an in-depth diagnostic developed by a group of donors (including the World
Bank and the International Monetary Fund) to assess the tax administration systems of
countries and subnational units.4
• Prior action 1: The taxes on value-added (ICMS) and inheritances, estates, and
donations (ITD; Imposto de Transmissão Causa Mortis e Doação) exceeded their
targets by 7 and 36 percent, respectively. Although the results were achieved, it
is unclear how much improvement can be attributed to the measures supported
by the program. This is because total nominal revenues from ICMS increased
between 2011 and 2017 at the rate of 5.7 percent per year, while nominal GDP
increased at 6.1 percent, indicating that nominal GDP growth alone could
account for all growth in revenues. Additionally, between 2005 and 2012 and
2013 and 2017, the annual ratio of ICMS revenue to GDP remained essentially
unchanged at 4.8 percent.
• Prior action 2: Ledger adoption remained incomplete,5 and by 2018, the single
account was not yet in place.
• Prior action 3: The performance indicators for tax collection were adopted, but
they have not improved the quality of tax administration to date. The indicators
5were not used to improve management, analyze employee performance, and
guide their compensation. Despite initial improvements, tax administration
regressed to earlier practices after 2014. It is difficult to improve fiscal
performance without effective incentives: according to Independent Evaluation
Group (IEG) interviews, most state auditors either already earn the maximum
possible or earn little from the additional effort they would need to exert to
increase tax revenues.
Table 2.1. Results Indicators for Strengthening Tax Administration
Indicator Baseline Target Value Actual Value
1. Establish ledger No Establishment of unified Unified General Taxpayer Ledger was created. It
unified general taxpayer ledger, with was working on an experimental phase when the
ledger access for individual taxpayers Implementation Completion and Results Report
to their unified accounts was written. Currently, taxpayers have access to
their accounts, but the accounts are not fully
unified.
Assessment Partially achieved
2. ICMS tax revenue 24.8 28.7 30.74
(billions of reais)
Assessment Achieved
3. ITD tax revenue 418 470 639
(millions of reais)
Assessment Achieved
4. Performance 0 20 15 by the end of 2013
indicators adopted 20 by March 2014 (World Bank 2014, para 54);
more recent data unavailable
Assessment Achieveda
Sources: World Bank 2012, annex 2, 66–69 for baseline and target values; World Bank 2014 for actual values of indicators 1
and 4 in July 2014.
Note: The baseline and target values are for December 31, 2011 and 2013, respectively. The baseline and target values for
ICMS tax revenue were modified in the ICR from R$32.6 billion and R$37.7 billion because they corresponded to total tax
receipts in 2011, not receipts from ICMS. The prior actions and indicators are associated as follows: ledger with prior action
1; tax revenues (indicators 2 and 3) possibly with prior actions 1, 2, and 3 (the program document does not separate
possible impact); and performance indicators with prior action 3. ICMS = tax on the movement of goods, interstate and
intermunicipal transport, and communication services; ICR = Implementation Completion and Results Report; ITD =
inheritance, estate, and donations tax.
a. The ICR states, “The sequenced introduction of performance indicators was carried out as envisaged. The final batch of
indicators was done in March of 2014” (World Bank 2014, paragraph 54). The ICR does not present evidence to support
the statement.
2.3 Overall, the prior actions for this policy area were broadly relevant for the
achievement of the objective of increasing state revenue performance. At the same time,
they could have benefited from including additional measures aimed at ensuring their
long-term sustainability, such as specific actions on audit and incentives for staff
performance and for sustaining the initiated reforms. The following sections of the
evaluation provide detailed information on specific prior actions and their impact.
6Ledger and Audit
2.4 Establishing the ledger was intended to facilitate tax administration by, among
other things, creating a single taxpayer account, which would make it easier to file and
pay taxes and to audit taxpayers. Creating the single account required first introducing a
unified taxpayer ledger, which would provide a view of taxpayers’ debits and credits.
The ledger was supposed to help register and number taxpayers, which is essential for
filing, paying, assessing, and collecting taxes. The adequacy and accuracy (that is,
integrity) of the information in the database is essential for effective tax administration.
The ledger was to be integrated into a single account to which taxpayers would have
access and through which they could file and pay taxes automatically.
2.5 Some of these actions were carried out, but a report on tax administration in Rio
de Janeiro state concludes that as of 2018, the taxpayer ledger was incomplete and did
not follow good international practices (TADAT 2018). The TADAT report found that
the information was adequate because registration was robust and businesses could
register and modify information online, but was not accurate because SEFAZ cross-
checks of information with other agencies and with reports on the accuracy of the
registration database were not available (TADAT 2018, 18–20).6 The ledger did not work
as expected, and the net result was that the authorities continued to lack accurate and
reliable information about taxpayers. However, the ledger has provided some benefits in
that it facilitated the electronic filing and paying of taxes.
2.6 The development policy operation was expected to help reduce errors and losses
(discrepancies) through the unified ledger.7 However, SEFAZ does not currently
evaluate tax revenue losses based on the results of the audit programs and cross-
checking of data. Moreover, SEFAZ does not evaluate the ICMS tax compliance gap, use
external studies, or monitor revenue losses from inaccurate information in tax returns
(TADAT 2018, 31–33).
2.7 A recent report from SEFAZ (2018) points out problems that support this
evaluation’s findings and conclusions. On registration and tax information, the SEFAZ
report notes that (i) the procedures for opening, writing, and changing tax registration
data are time consuming and excessively bureaucratic; (ii) the procedures in the old tax
registration system, known as SICAD, cannot be updated, and the reports (relatorios
gerenciais) are unavailable in the system; and (iii) SEFAZ data were integrated with the
synchronized taxpayer registration system only in 2017, though some operations were
not automated immediately. On audit and inspection, the report notes that tax auditors
emphasize administrative over audit activities. Most of them inspect the smallest
portion of tax collection, and the distribution and coverage of audits and fiscal
inspections is inadequate. Other shortcomings noted by the report are that SEFAZ has a
7highly unstable web portal, does not have requirements for digital certification of the
declarations, and does not have a system in place to monitor the extent of inconsistency
and inaccuracy of the information in taxpayers’ statements.
Paying Taxes
2.8 The DPL envisioned that a unified system would help promote high rates of
voluntary tax payments, reduce the accumulation of tax arrears, and address major
source of errors and losses in tax administration. That goal was not achieved.
2.9 The experience with the administration of the ICMS tax shows that about
35 percent of all taxpayers and 97 percent of large taxpayers file their taxes on time. For
the ICMS tax, about 84 and 74 percent of the number and value of all payments,
respectively, were on time in 2017. TADAT assessed the number of on-time payments as
fairly good and the value of payments as below good practice (TADAT 2018, 27, 29).
However, the lack of baseline data for these indicators makes it impossible to assess
improvement over time.
2.10 SEFAZ performance in tax collection was uneven. The agency does not monitor
the evolution of the stock and flow of tax arrears systematically. Three indicators of
arrears for the years 2015–17 show that the agency performed poorly (see table 2.2). The
problem was already present in 2010–12. In 2013, SEFAZ calculated that between the
first quarter of 2010 and the third quarter of 2012, the share of unpaid infraction notices
issued increased from 98 to 100 percent in value terms.
Table 2.2. Tax Arrears, 2015–17
(percent)
Indicator 2015 2016 2017
1. Total core tax arrears at year end/total 120 118 120
core tax revenue collected
2. Collectible tax arrears/total core tax 40 23 22
revenue collected
3. More than 12 months old collectible/total 16 13 10
core tax arrears at year end
Source: TADAT 2018, annex III, table 10, p. 55.
Note: Numbers are rounded.
Policy Area II: Public Financial Management
2.11 Policy area II covered three areas (see appendix D). On public investment
management, the objectives were to (i) improve the quality of investment spending and
the investment selection process, and (ii) ensure that investment decisions are consistent
with fiscal sustainability. The related prior action 4 consisted of the state adopting a
methodology and procedures for evaluating, selecting, and approving proposals for
8public investment projects estimated to cost more than 50 million Brazilian reais (R$).
On costing of public investment programs, the objective was to ensure that policy
commitments are consistent with long-term fiscal sustainability. It was supported by
prior action 5 that consisted of the state piloting a methodology for costing its public
policy programs on social and economic development and using this methodology to
cost four public policy programs. On internal control, the objective was to increase the
efficiency of public expenditures, supported by prior action 6 that consisted of the state
restructuring its internal audit institutional arrangements and, through SEFAZ,
approving the action plan of the Internal Audit Department (Auditoria Geral do Estado)
for calendar year 2012. These are high-level and ambitious objectives, and meaningful
progress toward them would be challenging for a stand-alone operation.
2.12 The expected results for financial management were partially achieved—one
indicator target was achieved (for internal control), one was partially achieved (for
costing), and one was not achieved (for public investment management), as shown in
table 2.3. The review did not find evidence that the state routinely screened public
investment projects using evaluation criteria or costed policy programs beyond the
pilots.8 The state of Rio has a multiannual plan that monitors only the outputs of state
actions (for example, hospitals built, teachers trained) and rarely assesses the outcomes
of public policies. Frequent adjustments to budget allocations throughout the year make
predictability and transparency of public investment programs difficult (see table 2.3).
2.13 Public investment management has been a challenge in the state of Rio de
Janeiro. Available data show the fragility of investment planning and implementation
(see table 2.4). Budgets increased after the start of the fiscal year, sometimes
significantly; by the end of the year, most of the resources had not been used or had
been used for projects that were not in the initial plan.
2.14 On costing, the state did not collect information on program costs and benefits
(beyond the pilots). Therefore, costing and a cost-benefit analysis were not available as
tools for budget preparation. As of 2021, the state of Rio de Janeiro does not have a
costing methodology, and the authorities (Secretaria de Estado de Planejamento, State
Secretariat of Planning) do not link program costs with the number of beneficiaries.
9Table 2.3. Results Indicators for Public Financial Management
Target Actual Value
Indicator and Associated Prior Action Baseline Value December 31, 2013
Public investment management (prior action 4) 0 5 3 ex post evaluations
1. Number of screened projects complying
with the evaluation criteria established in
technical manual
2. Publish the consolidated information on the No published information
portfolio mapping of the five investment
projects, showing annual investment
commitments of the investments
Assessment Not achieved
Costing (prior action 5) n.a. n.a. Costing for three major policy programs
3. State publishes results of costing at least prepared but not published
four major policy programs with their key
results defined
Assessment Partially achieved
Internal control (prior action 6) n.a. n.a. State published the action plan and an annual
4. Develop action plan to improve internal report on human resource reforms and
control system performance of internal control systems
Assessment Achieved
Sources: World Bank 2012, 2014.
Note: n.a. = not applicable.
2.15 Public investment management has been a challenge in the state of Rio de
Janeiro. Available data show the fragility of investment planning and implementation
(see table 2.4). Budgets increased after the start of the fiscal year, sometimes
significantly; by the end of the year, most of the resources had not been used or had
been used for projects that were not in the initial plan.
2.16 On costing, the state did not collect information on program costs and benefits
(beyond the pilots). Therefore, costing and a cost-benefit analysis were not available as
tools for budget preparation. As of 2021, the state of Rio de Janeiro does not have a
costing methodology, and the authorities (Secretaria de Estado de Planejamento, State
Secretariat of Planning) do not link program costs with the number of beneficiaries.
Table 2.4. State of Rio de Janeiro Investment Budget Execution, 2010–17
Budget Allocation Budget Allocation
Initial Budget Final Budget Committed Verified a
(current R$, Increase or Decrease (current R$, (R$, (R$,
Year millions) (current R$, millions) millions) millions) (percent) millions) (percent)
2010 4,946 2,702 7,649 5,166 67.5 5,022 65.7
2011 6,028 2,254 8,283 4,715 56.9 4,676 56.5
2012 6,735 2,632 9,366 5,314 56.7 5,261 56.2
2013 9,413 4,014 13,427 6,928 51.6 6,678 49.7
10Budget Allocation Budget Allocation
Initial Budget Final Budget Committed Verified a
(current R$, Increase or Decrease (current R$, (R$, (R$,
Year millions) (current R$, millions) millions) millions) (percent) millions) (percent)
2014 12,295 −883 11,411 7,666 67.2 7,615 66.7
2015 11,090 1,604 12,695 6,661 52.5 6,603 52.0
2016 7,627 2,437 10,064 2,674 26.6 2,508 24.9
2017 4,717 −120 4,597 1,011 22.0 987 21.5
Source: Portal de Transparência Estado do Rio de Janeiro. http://www.transparencia.rj.gov.br
Note: a Amount related to goods and services received, but not necessarily paid.
2.17 Better internal controls and more effective rules led to improved financial and
cash management. In this area, change was possible because of more openness to
accepting and adopting new technologies and processes, which facilitated training new
and younger officers. Change was also possible because fewer employees were
entrenched in their jobs compared with tax administration, which was staffed mainly
with employees with few or no skills in information technology.
2.18 Two technical assistance loans (P106768, fiscal year 2011, for the state; P127245,
fiscal year 2013, for the municipality of Rio de Janeiro) were expected to help improve
the efficiency of expenditures. The loan for the state did not have a lasting impact on its
processes to cost and assess programs and allocate budget. The loan for the municipality
did not achieve its objectives, and IEG rated its outcome as highly unsatisfactory. 9, 10 F 31F,,
2.19 Overall, the prior actions for this policy area were broadly relevant for the
achievement of the objectives of improving the quality of public investment decisions.
They were consistent with fiscal sustainability but limited and insufficient. The
proposed methodology for costing the public investment projects never passed the pilot
stage and was never adopted as expected, showing (in hindsight) that the prior action
could have been strengthened in this regard.
2.20 The problems of public investment management went beyond costing and lack
of project evaluation methodology. It is unlikely that the program’s prior actions could
have introduced some order in the administration of investment expenditures while
more pressing fiscal issues (for example, paying for the Olympic Games infrastructure
and the FIFA World Cup) demanded the attention of the authorities.
Policy Area III: Education and Health
2.21 The objective was to increase the quality of education through stronger
performance incentives and accountability mechanisms and to improve efficiency in the
delivery of public health services (World Bank 2012, 36).
11Education
2.22 The goal of the reforms supported by DPL III was to improve student learning
and reduce repetition and dropout rates by reforming human resources practices and
incentive systems in schools. The prior actions supporting the program’s objectives
consisted of (i) adopting and implementing a merit-based selection process for regional
and school directors within a specific territory, and (ii) adopting annual school-level
targets for improving student learning and graduation rates and a bonus pay system for
schools that achieved their respective targets. The Secretariat of Education set
performance targets for schools, and about 30 percent of schools received bonuses for
meeting their targets; the bonuses represented 25 percent of the teachers’ annual salaries.
2.23 Overall, the prior actions for education, though broadly relevant for the sector in
general, did not directly address the objective of improved student learning and
attendance and affected only certain aspects of human resources management in the
sector. Moreover, the potential longer-term impact of these measures is not clear—they
were abandoned shortly after being adopted because of pressure from interest groups.
2.24 The program’s results indicators captured processes, not results. Although the
indicators were achieved (see table 2.5), it cannot be concluded that the quality of
education improved. According to some measurements, student performance improved,
but it does not appear to have been a result of the supported reforms. The improvement
can be explained instead by a general trend toward improvements in the education
system in Brazil and by changes in the number of students enrolled in the state’s schools
(see box 2.1 for more detail). Indeed, the system of incentives was terminated in 2016,
partly because of students’ and teachers’ opposition to it.
Box 2.1. The Index of Development of Basic Education
An index of the quality of education in Brazil, the Index of Development of Basic Education
(Índice de Desenvolvimento da Educação Básica) measures quality based on the approval rate
and the average performance of students in evaluation tests. The index has information about
actual results and goals for education quality. The information shows that the quality of
education in the state improved between 2011 and 2017, but in most years and for most
categories of schools, the results achieved fell short of goals. The results for 2011–17 continued
a trend of improvement that started in 2005. Of the schools in the system, students in high
schools have the worst performance. Between 2010 and 2014, the state government reduced
enrollment in all schooling levels. Enrollment also fell because of a decrease in the school-age
population and the elimination of "ghost students," a result of better recording of enrollments.
Source: National Institute for Studies and Research on Education (Instituto Nacional de Estudos e Pesquisas Educacionais
Anísio Teixeira), http://portal.inep.gov.br/ideb).
12Table 2.5. Results Indicators for Education
Actual
Indicator Baseline Target 12/31/2013
Result 1. Number of regional directors selected January 2011 = 0 January 2012 and 2013 = 35
using new merit-based process 28 (100 percent of total)
Result 2. Number of school directors selected January 2011 = 0 January 2012 = 82 164
using new merit-based process January 2013 = 164
Result 3. Annual bonuses paid to school personnel n.a. n.a. Yes
for achieving 80 percent of improvement
targets—bonuses for 2012 paid by June 2013
Result 4. School targets for 2013 communicated to n.a. Communicated before Yes
schools (intermediate result indicator) the end of March 2012
Result 5. School targets for 2014 communicated to n.a. Communicated before Yes
schools (intermediate result indicator) the end of March 2013
Assessment Achieved
Sources: World Bank 2012, 2014.
Note: n.a. = not applicable.
Health
2.25 The reforms supported by DPL III aimed to improve quality and efficiency in the
delivery of public health services by subcontracting the management of public hospitals
and health units to social organizations, with the assumption that social organizations
would be able to provide better and cheaper services (World Bank 2012, paragraph 134).
The prior action consisted of the state of Rio de Janeiro (i) adopting a legal and
administrative framework to assess social organizations to manage public hospitals and
health units and to establish the terms and conditions for the contracts with such
organizations; and (ii) through its Secretariat of Health, adopting regulations defining
the evaluation mechanisms to transfer bonuses and monetary incentives to
municipalities and municipal hospitals within the state’s territory under the Programa
de Apoio as Municipalidades I (Program to Support Municipalities I), and to regional
state hospitals within the state's territory under the Programa de Apoio aos Hospitais do
Interior II (Program to Support Hospitals).
2.26 The reforms permitted the state of Rio de Janeiro to contract social organizations
to manage emergency services for 30 emergency care units (Unidade de Pronto
Atendimento), exceeding the 22 units planned. The reform changed the way the
Secretariat of Health operated from overseeing health services provision to managing
contracts with these organizations. The state also achieved the goal of using regional
hospitals for complex treatments when patients were outside their immediate
jurisdiction. After DPL III closed, regional hospitals handled more than 25 percent of the
complex treatments.
132.27 Overall, the prior action for health was partially relevant for the objective of
improving quality and efficiency in the delivery of public health services because it
assumed that the social organizations would be able to provide better services more
efficiently, which turned out not to be the case.
2.28 The program’s targets were achieved (see table 2.6), but because they measured
processes rather than results, they are inadequate to measure the quality and value for
money of the health services provided by the social health organizations.
Table 2.6. Results Indicators for Health
Baseline (No. of Actual
Area, Indicator, and Prior Action UPAs) Target 12/31/2013
Result 1. The state government has signed contract 2011 = 0 22 UPAs 30
with social organizations to manage 15 health units 2012 = 15
and strategic services (lab services, imagery services,
and so on)
Result 2. Number of hospitals under the PAHI program 2011 = 44 63 Met (ICR,
with ombudsman services 2012 = 53 paragraph 64)
Result 3. Number of hospitals with hospital infection 2011 = 46 66 Met (ICR,
evaluation committees 2012 = 55 paragraph 64)
Result 4. Supply of complex treatment to patients from 2011 = 16.78 24 Met (ICR,
other municipalities (percentage of the total) 2012 = 20 paragraph 64) but
does not present
numbers
Assessment Achieved
Sources: World Bank 2012, 2014.
Note: ICR = Implementation Completion and Results Report; PAHI = Program to Support Hospitals (Programa de Apoio
aos Hospitais do Interior); UPA = 24-hour emergency care unit.
2.29 The reforms and the results achieved did not translate into better value for
money or a larger supply of health services, as argued in a report on the health sector by
the state comptroller general (CGERJ [Contraloria Geral do Estado de Rio de Janeiro]
2019). The report analyzed the management of state health units during 2012–19,
especially the aspects related to their transfer to social organizations. The comptroller
general’s report concluded the following:
• Transferring the service to social organizations resulted in higher operational
costs for health units and a reduction in the volume of health services supplied
compared with before the transfer;
• Irregularities in the management of the social health organizations (Organizações
Sociais de Saúde) may have caused losses for the state’s treasury of
approximately R$1,016 billion ($254 million) during 2012–19; and
14• The state comptroller general found serious problems concerning the supervision
of services provided by social organizations, despite the large amounts of
payments to the social organizations from January to July 2019 (the expenses of
social health organizations represent 56 percent of the total budget of the state’s
health secretariat [Secretaria de Estado de Saúde]). These problems included the
absence of inspection criteria, deficiencies in monitoring contracts, and the lack
of information systems to help control spending and present accounts.
Design and Preparation
2.30 The loan was part of several independent operations in the state of Rio de Janeiro
that supported reforms with common elements and an implicit goal of improving fiscal
management. Taken together, these loans did not constitute a coherent and consistent
effort to effectively tackle the problems in tax administration, public financial
management, health, and education. For example, on tax administration, the operation
under review was the only one that made a serious effort to influence the quality of tax
administration; two other operations (Rio state DPL I and Rio Municipality DPL) also
touched on tax administration, but the issues they addressed were weakly connected.
Moreover, the operations had different objectives for the pillars that touched on fiscal
aspects (for example, fiscal consolidation in DPL I, creating fiscal space in Rio
Municipality DPL, and fiscal efficiency in DPL III). The Municipality DPL (2010)
essentially went to restructure debt with the federal government, since the DPL had
better financial conditions but higher risk because it was a foreign currency operation.
The risk materialized when the real depreciated 45 percent providing the motivation for
the operation. In sum, there was no sustained effort to improve tax administration and
public financial management in the state.
2.31 The DPL addressed relevant problems and selected interventions that could
credibly advance reforms in areas managed by competent professionals within an
administration interested in improving the state government’s performance. The
presence of knowledgeable and well-intentioned administrators supported an optimistic
outlook within the World Bank for the program’s success, but in hindsight, such
optimism was misplaced. The favorable conditions at the time of preparing DPL III seem
to have overshadowed the state’s institutional weaknesses, a risk that materialized and
eventually erased some of the gains achieved (tax administration), prevented the
advance of some reforms (investment management), reversed other reforms (education),
and reduced the efficiency of social expenditures (health).
2.32 Although the World Bank had good knowledge of the areas covered by the loan,
the operation did not have a clear theory of change or a realistic plan for how to advance
and preserve the reforms, given the political and institutional environment in place at
15You can also read