Rising bond rates shines a spotlight on rents Yields tighten but at a slower pace Rents show first signs of growth - 2ND HALF 2018
←
→
Page content transcription
If your browser does not render page correctly, please read the page content below
2ND HALF 2018

>	Rising bond rates shines
   a spotlight on rents
> 	Yields tighten but at a
   slower pace
> 	Rents show first signs
   of growth

    1   LJ Hooker Commercial Industrial Market Monitor 1st Half 2018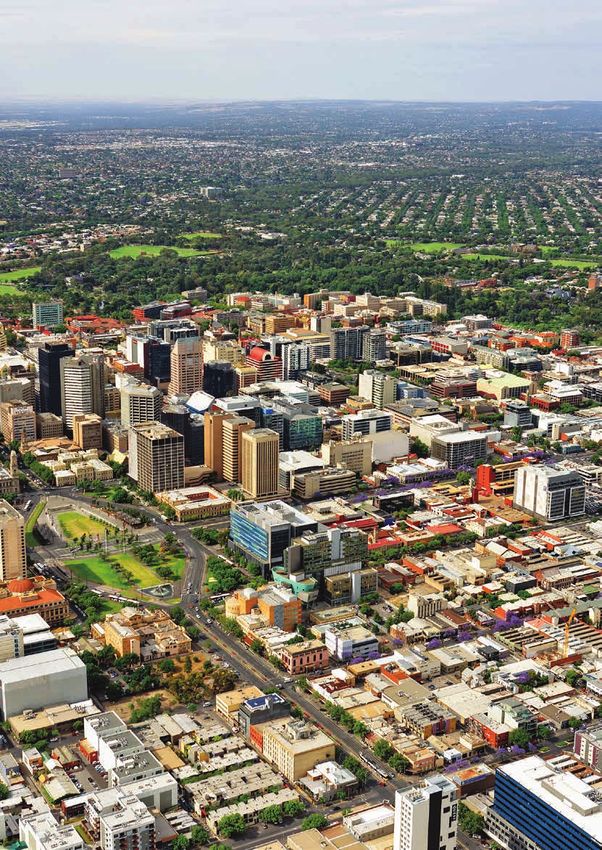
Commercial property.
The services you need,
just the way you need them.

ljhcommercial.com.au

COVER IMAGE: Sold – 3 Morton Close, Tuggerah. LJ Hooker Commercial Central Coast

2   LJ Hooker Commercial Industrial Market Monitor 1st Half 2018
Contents
National Overview    5

Sydney               6
Leasing market        8
Investment market    10
Supply               11

Melbourne           12
Leasing market       14
Investment market    16
Supply               17

Brisbane            18
Leasing market       20
Investment market    22
Supply               23

Perth               24
Leasing market       26
Investment market    28
Supply               29

Adelaide            30
Leasing market       32
Investment market    33
Supply               33

Canberra            34
Leasing market       36
Investment market    37
Supply               37

Hobart              38
Leasing market       40
Investment market    41
Supply               41

Darwin              42
Leasing market       44
Investment market    45
Supply               45

                    33
4 LJ Hooker Commercial Industrial Market Monitor 1st Half 2018
Rising bond rates set to influence rents
The investment market has played a central role in industrial property since the
GFC. Underpinned by falling, then persistently low bond rates, it directed funds into
property, with the ensuing competition for assets delivering strong capital gain.
It also kept a lid on rental growth:                purchased at a significantly higher           few years. When yields start to respond
firming yields through the construction             price. Competition amongst developers         to rising bond rates, we expect rents
process meant that development                      across the markets has been causing           to rise and largely offset the impact of
remained financially viable even if rents           substantial rises in land values. Indeed,     softening yields on capital values. In
stayed the same. There was even a                   for many of the players the cost of land      the longer term, development costs
modest surplus that could be used                   is now so high that construction is not       put a floor under both rents and prices,
to pay for leasing incentives and/or                feasible at currently prevailing rents        meaning there is little downside risk.
offset increases in construction costs.             and yields. While firming yields helped
In some markets, pre-lease rents have               disguise the issue in the past, further       The logic for owner-occupiers is similar.
undercut rents in existing buildings by a           firming cannot be relied on. Developers       On the investment front, industrial
substantial margin.                                 will have no choice but to pass on the        property still promises attractive returns
                                                    increases in land costs in the form of        compared with other asset classes.
However, the prospect of rising bond                higher rents.                                 Interest rates are still low and owning
rates puts the spotlight squarely on                                                              property avoids locking in long leases
rents. Higher bond rates will flow                  Depending on how the market reacts,           with fixed annual increases, as well
through to property markets in the form             there are two possible scenarios. If          as cyclical movements in the cost of
of softening yields. Between one third              the market accepts higher pre-lease           accommodation.
and two thirds of bond rate movements               rents without delay, the transition will
are passed through to yields depending              be relatively quick and the higher rents      From a pure tenants’ perspective,
on the market, typically with a lag of six          will gradually filter down to the market      the case is clear: lock in new leases
to 12-months.                                       for existing space. On the other hand,        as soon and for as long as possible.
                                                    if tenants are not prepared to pay extra      Leasing conditions still favour tenants,
Softening yields compress margins                   for new space, developers will be             with effective rents at historical lows
in industrial property development.                 forced to stop building for a while. Once     in most markets. Once yields start to
Developers will have to pass this on in             vacancy rates start to tighten rental         soften, developers will no longer be
the form of higher rents.                           growth will ensue, but this will take time.   able to offer such generous deals and
                                                                                                  that will flow through to the market for
The issue is further compounded by                  What does this mean for                       existing space.
rising construction and land costs. In
the eastern seaboard cities, developers             property players?
have exhausted the land banks they                  For investors, the outlook remains
accumulated prior to the GFC and                    positive. Expected returns are still good,
are now having to use land that was                 though not as strong as over the past

Australian industrial sales
Billions

 $7

 $6

 $5

 $4

 $3

 $2

 $1

 $0
           FY07      FY08      FY09       FY10          FY11          FY12        FY13     FY14    FY15       FY16         FY17         FY18
              Other/Unknown   Syndicate   Private      Occupier/Developer    Institution                  Source: RCA / LJ Hooker Commercial

                                                                                                                                               5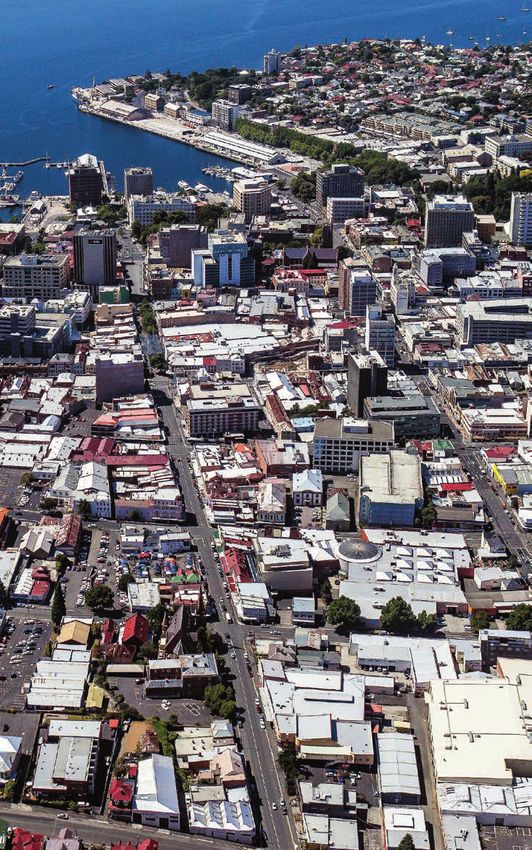
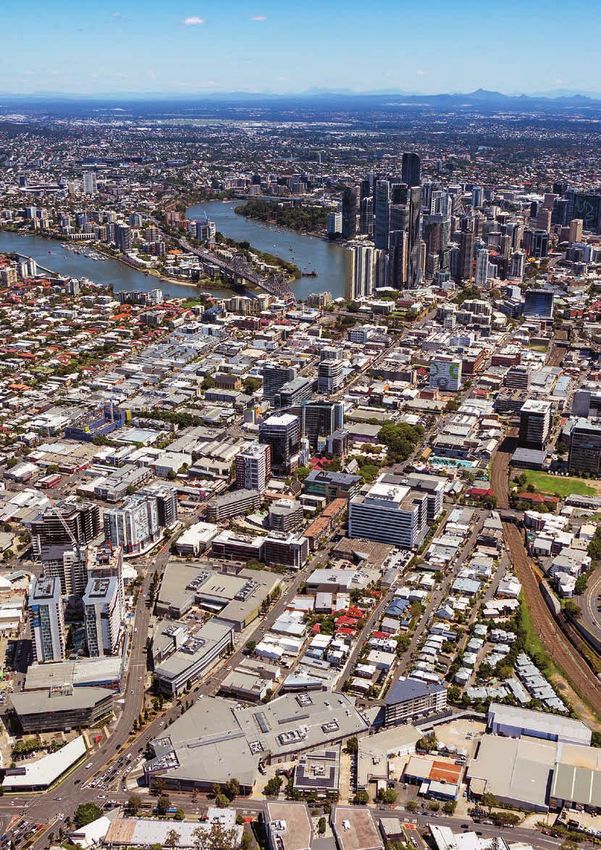
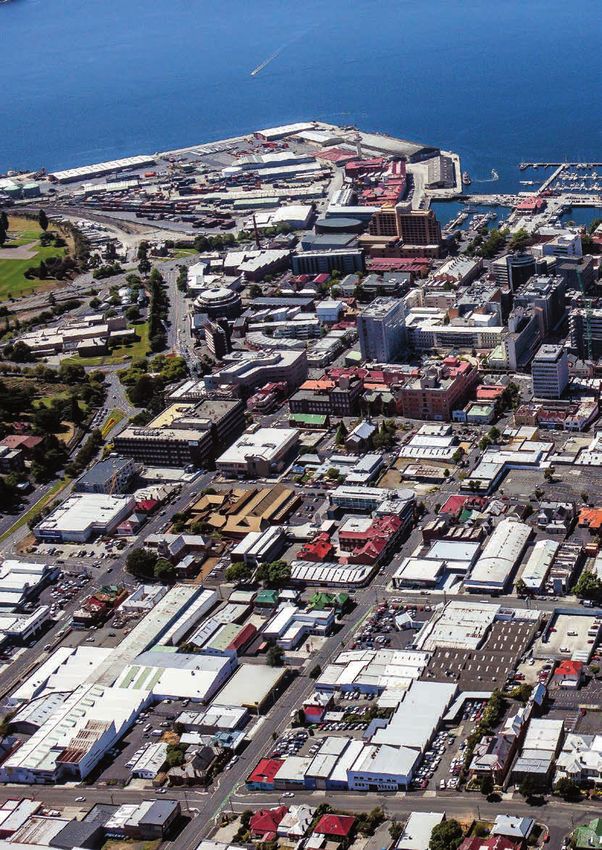
Aerial
6 LJimages
       Hookersupplied courtesy
              Commercial       of Airview
                           Industrial     Online
                                      Market     – www.airviewonline.com
                                             Monitor 1st Half 2018
Sydney
Sydney industrial market

In New South Wales, State Final
Demand (SFD) is estimated to have
increased by 3.4% in FY2018, still
higher than the estimated 3.2% for
Australian domestic demand, but
down from the SFD growth of 3.9%
over FY2017 and FY2016.

Spending in the state is being driven
by very strong business and public
investment, while growth in dwelling
investment has slowed sharply over
the past year from its double-digit
increases of the previous three years.

Sydney outer west industrial market

       Average prime      Average
       net face rent      prime
       $117 psm pa        incentive 11%

      Average prime       Average
      capital value       prime
      $1,870 psm          yield 6.25%

                                          77
Sydney

Sold – 28 - 30 Blaxland Road Campbelltown. LJ Hooker Commercial Macarthur.

Leasing market
As has been the case in recent years, tenant demand continues to be underpinned by
a combination of strong underlying demand and continuing changes in the retail and
logistics industries.

Underlying demand was                                 At the smaller end of the market,         incentives averaging around 11.5%.
complemented by on-going changes                      strong population growth in the south     Stronger growth was prevented by a
in the retail and logistics industries.               west and north west growth areas is       highly competitive pre-lease market, an
Supply chain outsourcing and the rise                 underpinning demand for industrial/       increase in speculative stock entering
of e-commerce/online retailing led to                 business units in nearby estates.         the market and a further firming in
strong demand for new, more efficient                 In more centrally located areas,          investment yields.
distribution facilities.                              redevelopment of older premises is
                                                      required to satisfy local demand, which   The exception was the traditional
The distribution of developable land                  is further complicated by competition     South, where a large portion of
means that the outer industrial region                from residential development.             secondary industrial space has been
accounts for almost all of Sydney’s                                                             lost to residential development. Prime
net absorption. The region remains                    After reaching a post-GFC low in 2017,    rents rose by around 4.7% to $181
the most attractive location for large                Sydney’s industrial vacancy rate has      per square metre over the 12 months
warehousing and distribution activities               ticked up a little due in part to the     to June. Rental growth amongst
due to its access to the interstate and               release of new speculative stock. At      secondary grade stock across Sydney
orbital road network. The most popular                June 2018, average prime rents in the     out-performed better quality space,
estates lie within a corridor stretching              outer region stood at around $117 per     surging by around 7% through FY2018.
from Marsden Park in the north to                     square metre, $136 in the inner west
Smeaton Grange in the south.                          and $176 in the north, with leasing

8   LJ Hooker Commercial Industrial Market Monitor 2nd Half 2018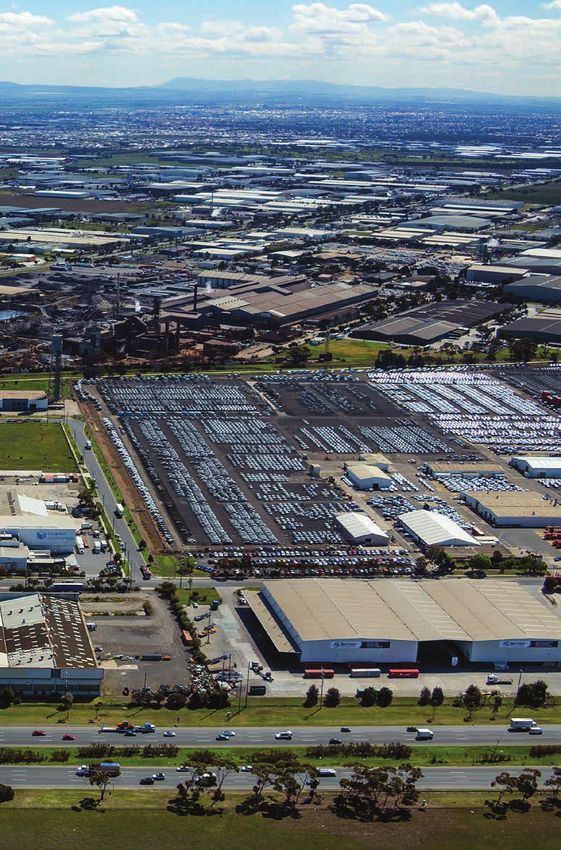
Leasing outlook
The outlook for net absorption over the next 12 to 18 months is solid. Demand for
warehouse space will continue to be strong in the short term, underpinned by the
transport/logistics and retail/wholesale sectors.
The growing market share of online                    major alternatives, while the south                  continue. Accordingly, our forecasts are
retailing and accompanying changes                    west is also experiencing a revival                  for modest growth in rents to continue.
to supply chains require larger, more                 in fortunes.
modern premises that will displace                                                                         Average prime net face rents in
smaller storage spaces, whether in-                   Demand for smaller premises and                      the north, inner and outer west are
store, retailer-operated warehouses,                  industrial units will be underpinned                 expected to grow by around 8.0%
wholesalers or importers/distributers.                by an expanding NSW economy and                      over the three years to June 2021,
This structural change is independent                 population growth. Estates servicing                 representing a compound annual
of economic growth and is expected                    the south west and north west growth                 growth rate of 2.7% – close to the
to prop up net absorption while                       areas will remain hotspots, as will older            expected rate of CPI inflation. In
‘underlying’ demand weakens.                          estates with infill/redevelopment sites.             contrast, prime rents in the south
                                                                                                           are likely to grow at 10%, or 3.4%
Users of large premises will continue                 Industrial vacancies are forecast to                 per annum.
to favour the estates along the M7.                   remain contained, with new supply
Eastern Creek remains the most                        closely matching changes in demand.                  The outlook for secondary rents in the
sought-after location, followed by                    While the supply of ready-to-build land              southern and northern regions is even
estates in the vicinity of the M4/                    is tight, developers have been able to               more positive, with stock withdrawals
M7 interchange. Marsden Park and                      service sufficient quantities of zoned               expected to see tight conditions prevail.
Prestons are currently developing into                land to prevent any more significant
                                                      shortages, a situation we expect to

Sydney outer western region industrial rents and capital values
Rents $/psm                                                                                                                                   Value $/psm
                                                                                                                Forecast
130                                                                                                                                                         2,000

                                                                                         Capital values (RHS)
120                                                                                                                                                         1,750
                                                Net stated rents (LHS)

110                                                                                                                                                         1,500

100                                                                                                                                                         1,250

 90                                                                                                                                                         1,000
   2006       2007      2008   2009     2010      2011     2012      2013     2014       2015   2016     2017     2018       2019      2020      2021
      Year ended June                                                                                                      Source: BIS Oxford Economics

                  Sold – 3 Morton Close, Tuggerah. LJ Hooker Commercial Central Coast.

                                                                                                                                                                    9
Sydney

Sold – 13 Lucca Road, Wyong. LJ Hooker Commercial Central Coast.

Investment market
Industrial property remains highly sought after. Weight of money continues to cause
prices to rise and yields to firm, helped by bond rates remaining relatively stable since
lifting off the bottom of the cycle in the second half of 2016.

The value of stock traded continues to                to five years. Average prime property     Across Sydney’s four major industrial
be limited by the availability of property            prices increased by around 9% in          regions, we expect prime yields to
for sale rather than investor demand.                 FY2018, with growth ranging from 5%       contract by another 5 to 10 basis points
However, anecdotal evidence suggests                  in the outer region to over 14% in the    to an average of 6.0% over the next
that at the smaller end of the market                 traditional south.                        six to 12 months. The exception is the
an increasing number of investors are                                                           northern region, where the firming of
deciding to sell to realise the capital               WALE remains the key determinant          yields is likely to extend beyond the
gain made over the past few years.                    of price and yield. Large, (near-) new    rest of the market due to the positive
                                                      properties with 10+ year lease tails –    influence of the office market.
Prime investment yields continued                     sometimes referred to as ‘super-prime’
to firm through the first half of 2018,               – average around 5%. Older and/           The secondary market is forecast to
taking them to 130 basis points                       or smaller prime assets with shorter      mirror their prime counterparts with
below their pre-GFC peaks. By June,                   WALEs showing yields of around 7%.        a firming in average yields of 5 to 10
average prime yields ranged from                                                                basis points in the central western and
5.2% in the south to 6.2% in the inner                Looking forward, the outlook for yields   southern regions underwriting total
west. Meanwhile, the combination of                   remains somewhat dependent on what        price growth of around 4% over the
rental growth and yield compression                   happens to long interest rates. Yields    coming two years.
extended the run of solid capital gain                tend to follow bond rates part of the
                                                      way, up and down, and with a delay.
10   LJ Hooker Commercial Industrial Market Monitor 2nd Half 2018
Supply
The 2018 financial year marked the third successive year in which completions of new
stock eclipsed the previous year’s total. Overall, around 680,000 square metres of new
supply was added to stock, an increase of nearly 10% compared with FY2017.
At the same time, stock withdrawals located in the south-western precincts precinct in Homebush/Olympic Park,
amounted to around 65,000 square of Smeaton Grange, Gregory Hills, in the traditional southern and parts
metres, primarily for conversion to Campbelltown and Prestons, while of the northern regions, as well as
residential and infrastructure uses in the small freestanding buildings entered the Moorebank. However, the weakening
south and central west regions. market in smaller estates near the north of the residential cycle is likely to
west growth area. temporarily ease pressure a little.
As in previous years, the outer industrial
region dominated new supply in Supply outlook Stocks of zoned and ready-to-build
FY2018, accounting for more than land are limited across the entire
90% of total stock additions. Reflecting 2018 is likely to set another new (post- metropolitan market, but developers
its popularity, Eastern Creek alone GFC) record for the most construction continue to service new estates in
has been making up around 30% of in a year, with over 200,000 square time for anticipated demand, thus
the total over the past six years, while metres of space already completed in avoiding bottlenecks. Importantly,
Prestons and Marsden Park have the first quarter. Overall, the total for the land values have increased to
become the most popular alternatives year is expected to exceed 700,000 levels at which private landowners
over the past two years. square metres. are prepared to sell holdings to
developers, a move that until recently
Construction of industrial units Stock withdrawals in the south and
looked unlikely. As long as such sales
continued to slow in FY2018. New central west will continue to moderate
continue, the Sydney market is not
multi-unit developments were primarily new supply. Further withdrawals
likely to run into supply constraints.
are expected at the Carter Street
Sydney warehouse demand and new supply
Annual % change $ Million
Forecast
10 1,200
NSW domestic demand for goods (LHS)
5 800
0 400
Warehouse work done (RHS)
-5 0
2006 2007 2008 2009 2010 2011 2012 2013 2014 2015 2016 2017 2018 2019 2020 2021
Year ended June Source: ABS, BIS Oxford Economics
Leased – B/50 Williamson Road, Ingleburn. LJ Hooker Commercial Macarthur.
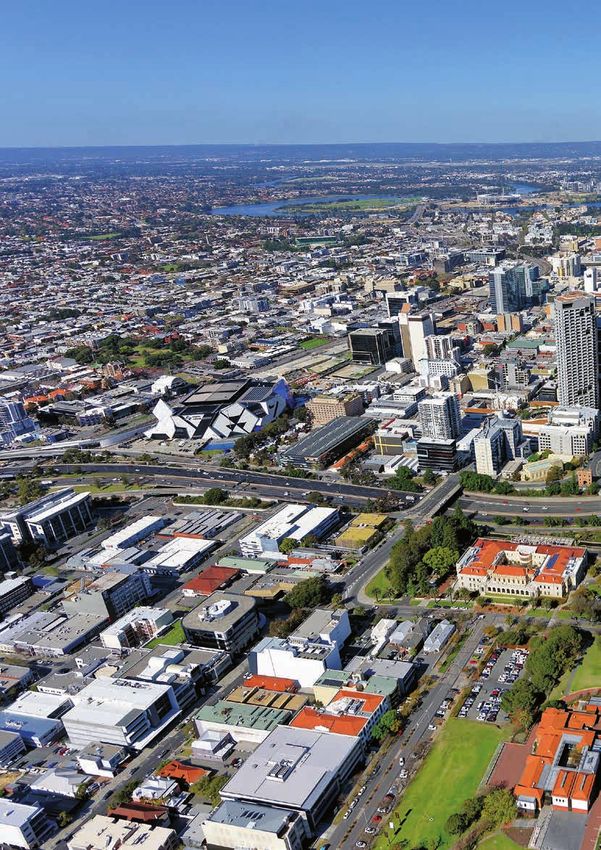
11Aerial
12 LJ images supplied
Hooker courtesy
Commercial of Airview
Industrial Online
Market – www.airviewonline.com
Monitor 1st Half 2018Melbourne
Melbourne
industrial market
The Victorian economy has been the
stand out performer over the past
four years, with State Final Demand
(SFD), Gross State Product (GSP)
and employment growth significantly
outpacing the national average.
Growth is still strong, with SFD up
4.9% through the year to the March
quarter, 2018; GSP estimated at
3.2% in FY2018 and jobs growth
rebounded strongly over the three
months to May 2018.
Melbourne south east industrial market
Average prime Average
net face rent prime
$84 psm pa incentive 17%
Average prime Average
capital value prime yield
$1,400 psm 6.0%
1313Melbourne
Leasing market
In line with economic growth, gross leasing activity in Melbourne remained solid
through 2017–18. Most of the take-up was concentrated amongst warehouses and was
located in Melbourne’s west and the south-east.
A significant proportion of take-up, Nevertheless, there remains a falling vacancies have allowed building
last financial year, was underpinned by substantial amount of choice for owners to reduce leasing incentives
demand from transport and logistics occupants amongst existing (prime across the board, boosting effective
operators servicing retailers and and secondary) properties, with rents in the process.
wholesalers facilitated by favourable vacancies focused in the west as well
deals offered to upgrade to new or as the south-east. Vacancies are much Average rents ranged between $73
better-quality space. lower in the northern region, with little and $84 per square metre in the
available to lease (greater than 5,000 north, west and south-east, with the
The strength of demand in the leasing square metres) within the city fringe. city fringe at $142 per square metre.
market continues to make inroads into Secondary rents in the benchmark
the stock of vacant industrial space Prime net stated industrial rents south-east remained stable at $63 per
across Melbourne. Vacancies in the increased moderately in some regions square metre. Prime leasing incentives
March quarter fell back towards the but not in others over the year to June average between 17% to 21% in the
long run average and well below the 2018, influenced by falling vacancies, south-east, north and west and 10%
peak vacancies reached in 2016. competition from the pre-lease market in the city fringe.
and rising land values. However,
14 LJ Hooker Commercial Industrial Market Monitor 2nd Half 2018Leasing outlook
Demand for industrial property in Melbourne will remain heavily influenced by the
strength of the Victorian economy. Our indicator of underlying demand, is set to
weaken over FY2019 and FY2020 as growth in the Victorian economy slows, before
picking up in FY2021.
Economic headwinds will come efficient warehouses or ‘upgrader Amazon will continue the development
from weakening residential building demand’. This demand is more difficult of networks of warehouses that fulfil
and public investment and slowing to quantify but is only likely to maintain different functions as businesses seek
household consumption expenditure. its momentum whilst the strong to deliver packages efficiently to the
The biggest positives for ‘underlying investment market allows for attractive end customer.
demand’ will come from private pre-lease deals.
non-residential building and private After 2020, we expect demand for
engineering construction and The rise of e-commerce is a key driver industrial property to start to recover,
equipment spending. of ‘upgrader demand’ as operators as national and state economic growth
increasingly require distribution improves due to rising investment and
Furthermore, the lower Australian centres which can accommodate consumer spending.
dollar will continue to provide support automated systems in locations close
to the state’s key trade-exposed to consumers. E-commerce has The outlook for average net stated rents
services industries. However, lower plenty of potential to expand in Victoria across Melbourne will be influenced by
economic growth will lead to weaker and will likely do so over the short continued strong competition in the pre-
demand for goods and less demand to medium term. There is no way of lease market and weakening demand.
for warehouse space. knowing exactly how much demand Over the three years to June 2021, we
for industrial space will be required forecast rent growth across the regions
On top of ‘underlying demand’ is the as a result. However, the arrival of of 7 to 10% with less than 5% growth
continued demand for larger and more expected in secondary rents.
Melbourne south east industrial rents and capital values
Rents $/psm Value $/psm
Forecast
100 1,400
Capital values (RHS)
90 1,200
Net stated rents (LHS)
80 1,000
70 800
60 600
2006 2007 2008 2009 2010 2011 2012 2013 2014 2015 2016 2017 2018 2019 2020 2021
Year ended June Source: BIS Oxford Economics
15Melbourne
Investment market
The investment market in Melbourne was solid during FY2018, with the value of sales
lower than FY2017 but higher than the long run average. Investor appetite is being
restrained by the lack of quality properties on offer in the market.
Foreign investors were the dominant prime yields across the regions firmed tightening in the US. Over the next few
purchasers of industrial property over by about 40 basis points to average of years, we expect Australian bond rates
the last 12 months, followed by listed around 6.0%, accompanied by solid to rise at a slow and steady pace, as
and unlisted funds. The most active price gains. Secondary yields in the the US continues to push up interest
foreign investors included Ascendas, south-east also firmed by 70 basis rates.
Investec, ESR and Cache Logistics. points during FY2018 to an average of
7.2%, reflecting strong investor appetite The impact on the flow of funds into
The largest sales concluded recently for assets. industrial property will take time to
include Cache Logistics acquiring six adjust. There could be a little more
properties in Victoria as part of a larger The outlook for industrial property firming in yields in the near term before
portfolio deal for $178 million. GPT yields in Melbourne is heavily yields plateau and then start to rise. Our
bought a site containing four individual dependent on changes in 10-year best estimate is that yields will start to
warehouses at Sunshine for $74 million, Australian government bonds, which in rise during FY2020. Rising yields will
reflecting a 6.1% yield. turn are impacted by US interest rates. have a dampening impact on property
Indeed, long term bond rates have prices. As a result, the solid price gains
Competition for assets continues to already risen from their lows reached experienced in recent times are not
drive up prices, resulting in lower yields. in 2017, responding to monetary expected to last much longer.
Over the last 12 months, we estimate
16 LJ Hooker Commercial Industrial Market Monitor 2nd Half 2018Supply
The value of industrial construction in Melbourne remains at high levels. The latest
quarterly ABS data shows the value of approvals for warehouses and factories at
around $1.3 billion in MAT terms, around $1.1 billion of which is warehouses.
Most of the construction activity over such as Frasers Property Australia of buildings underway and the
the past year was focused in the are developing a limited number of latest approvals data, the value of
west and south-east for warehouses speculative projects ahead of demand construction work done is expected
(accounting for 85% of approvals) with in an effort to secure tenants who need to fall over the next two years, settling
the limited factory activity dominated by space with limited notice. back to levels which will satisfy
the south-east. weakening incremental demand.
A shortage of serviced retail lots in the
A significant proportion of completions north, west and parts of the south-east There are only a handful of major
due this year are underpinned by has flowed through to substantial rises pre-commitments underway,
pre-commitment to tenants or owner in land values in the last 12 months. including warehouses for Woolworths
occupiers. However, speculative Furthermore, the combination of falling (32,600 square metres) and Hickory
construction remains a feature of the vacancies and rising land values have Group (21,700 square metres) and
Melbourne industrial market. contributed to rental rises in some D’Orsogna’s 11,000 square metre
areas. A number of major developers factory. The adjustment to lower levels
Around 70,000 square metres of such as Frasers, Charter Hall and of new supply will continue as the
recent completions were commenced Logos have been active in the englobo strength of the investment market starts
without a tenant pre-commitment, land market, restocking land banks to to wane, favourable pre-lease deals
however, the strength of demand satisfy future demand. evaporate, and vacancies rise. Even so,
ensured these projects did not add to we do not expect a collapse in supply.
overall vacancies. Major developers Looking forward, the number
Melbourne warehouse demand and new supply
Annual % change Forecast $ Million
10 1,400
Warehouse work done (RHS)
8 1,200
6 1,000
4 800
2 600
0 400
VIC domestic demand for goods (LHS)
-2 200
-4 0
2006 2007 2008 2009 2010 2011 2012 2013 2014 2015 2016 2017 2018 2019 2020 2021
Year ended June Source: ABS, BIS Oxford Economics
17Aerial
18 LJ images supplied
Hooker courtesy
Commercial of Airview
Industrial Online
Market – www.airviewonline.com
Monitor 1st Half 2018Brisbane
Brisbane
industrial market
Although Queensland’s State Final
Demand has returned to positive
growth of around 3% over the past
two years, Gross State Product (GSP)
remains weak, with a 1.8% increase in
FY2017 and a similar result likely
in FY2018.
Weak exports and surprisingly strong
growth in imports detracted from
growth in output (GSP) over the past
financial year. On the other hand,
employment growth was remarkably
strong over the year to February 2018,
rising 5.5%, before falling back over
the three months to May 2018.
Brisbane TradeCoast industrial market
Average prime Average
net face rent prime
$124 psm pa incentive 12%
Average prime Average
capital value prime yield
$1,910 psm 6.5%
1919Brisbane
For Sale – 21 Middle Road, Hillcrest. LJ Hooker Commercial Brisbane.
Leasing market
In 2017, the Brisbane industrial market recorded its strongest annual net absorption
figure since 2007/2008, the peak of the 2000s boom. Around 580,000 square metres of
stock was absorbed, buoyed by around a dozen tenants moving into new, mostly pre-
committed premises of 10,000 square metres or more in size.
The first half of 2018 has been a little household formation and the boom precincts. At the smaller end of the
more subdued, although this is more in apartment construction in inner market, there is steady demand for
a reflection of fewer projects being Brisbane and on the Gold Coast. industrial units, both in established
delivered rather than a weakening The latter contributed strongly to estates and near new housing estates.
of demand. Demand has been demand for building products, which
underpinned by a combination of a led to construction of new factories, Despite the strength of demand, there
recovering economy and structural as well as distribution space for has been little to no growth in rents
changes in the retailing and logistics whitegoods imports. over the past six to 12 months. While
industries. It has also been aided by the building vacancies have declined, the
competitive nature of the development Leasing activity continues to be spread plentiful supply of land and competitive
industry, which has resulted in very across most of Brisbane’s industrial nature of the pre-lease market is
attractive rents coupled with relatively regions, with only the north registering preventing them from translating into
high incentives, particularly for tenants weaker activity than usual. Sites along stronger rental growth, with speculative
willing to pre-commit to new projects. the major interstate transport corridors construction preventing short term
to the south-west and south, as well bottlenecks that could boost growth.
Business confidence has been strong, as the TradeCoast remain highly
supported by demand for goods from a sought after, supplemented by the re-
strongly growing population, associated development of infill sites in established
20 LJ Hooker Commercial Industrial Market Monitor 2nd Half 2018Leasing outlook
The short to medium term outlook for the Queensland economy is positive, feeding
through to underlying demand for industrial space. However, growth is unlikely to be
sustained at last year’s levels.
Growth in both private and public Meanwhile, the underlying drivers at Bundamba. To this list should also
investment is expected to slow of demand for industrial space will be added Rheinmetall’s Military Vehicle
temporarily in FY2019, before picking remain the same. With no end in Centre of Excellence, an 11 hectare
up again the following year. The main sight for growth in online retailing, the manufacturing and testing facility
short-term drag on growth in Brisbane logistics sector will continue to require at Redbank for the construction of
is the downturn in inner city apartment expansion space. Businesses not armoured vehicles for the Australian
construction, which will affect demand growing as fast will focus on efficiency Defence Force.
for space associated with building improvements to boost profits, which
materials and whitegoods supplies. means upgrading to or consolidating With speculative construction expected
into more modern premises in locations to continue, it is unlikely that vacancy
However, industry in general will offering improved access to the major rates will fall to levels that would
continue to benefit from solid road network. stimulate significantly stronger rental
population growth, while the lower growth – at least in the short term.
Australian dollar is boosting the At the larger end of the market, active Meanwhile, owners and developers will
tradeables sector. Moreover, there pre-commitments include Hilton Foods continue to use incentives to meet the
is a long line of large construction (39,500 square metres), Woolworths market, particularly amongst secondary
projects which will start to ramp up (chilled food distribution centre, 59,000 grade stock.
over the next three years, headlined square metres) – both at Heathwood
by Queens Wharf, the Brisbane Live – Comfort Group (39,000 square
entertainment precinct, Cross River metres) at Murarrie, with smaller deals
Rail and Brisbane Metro. for Steel Force at Lytton and Costco
Brisbane TradeCoast industrial rents and capital values
Rents $/psm Value $/psm
Forecast
150 2,250
140 2,000
Capital values (RHS)
130 1,750
120 1,500
Net stated rents (LHS)
110 1,250
100 1,000
2006 2007 2008 2009 2010 2011 2012 2013 2014 2015 2016 2017 2018 2019 2020 2021
Year ended June Source: BIS Oxford Economics
Sold – 7 Rocla Court, Glenvale. LJ Hooker Commercial Toowoomba.
21Brisbane
Sold – 361 Taylor Street, Wilsonton. LJ Hooker Commercial Toowoomba.
Investment market
Average prime investment yields firmed by 20 basis points through the first half
of 2018, taking the total for FY2018 to 25 basis points and setting new post-GFC
benchmarks in the process.
At June 2018, prime yields stood at short WALEs remains soft. Meanwhile, Looking forward, we still expect to see
6.25% on the TradeCoast, 6.4% in the there is steady demand for strata units a further contraction in prime market
south and 6.5% in the north, between from owner occupiers, who are taking yields over the coming six months,
50 and 75 basis points below their advantage of the ongoing low interest though by no more than 5 to 10 basis
2007 levels. Yields on secondary assets rate environment. points. Interest from buyers switching
followed the same pattern. from residential to industrial is expected
With the contraction in yields slowing to continue for a while, at least until the
The averages hide a divergence over the past 12 months, growth in Brisbane apartment market starts to
in performance between prime, capital values has also eased. Average recover. However, potential buyers will
institutional-grade assets and smaller prime capital values rose at a rate of remain cautious. Owner-occupiers will
properties, especially those with shorter 3.7% between June 2017 and June remain active in the unit market until
WALEs. Large, top of the range assets 2018, down from 5.1% six months borrowing rates rise to levels where
with very long WALE can trade in the earlier. Growth in the secondary market renting becomes the cheaper option.
low 5% range, while sub-10,000 square was around 2% for FY2017 compared
metre properties with WALEs of around with 4% through calendar year 2018.
10 years traded between 6.0 and 6.5%. In the prime market, average capital
values now exceed their previous peak
In contrast, investor interest in smaller, levels set in 2007.
particularly lower grade, properties with
22 LJ Hooker Commercial Industrial Market Monitor 2nd Half 2018Supply
New stock completions in 2017 jumped to over 320,000 square metres, an increase of
over 10% compared with 2016, the second highest since the GFC after 2015.
Whilst strong, particularly in terms nearing completion at June, including a and Sealy at Wacol, an 18,000 square
of land take-up, it represents just 30,000 square metre bottling plant for metre part-speculative warehouse
over half of what was added to stock Coca Cola Amatil (CCA) at Richlands. at Kellar Street and new premises
in a single year at the peak of last for QLS Logistics, both at Berrinba.
decade’s boom market. Activity was At the smaller end of the market, Meanwhile, work continues on
focused on estates located along construction activity was spread servicing new or extending existing
major arterial roads and/or around the across a larger number of estates, estates at Frasers Property’s Yatala
port and airport, particularly Berrinba, ranging from Brendale in the north; Central, at Metroplex Westgate in
Rochedale and Yatala in the south, Darra, Wacol and Richlands in the Wacol, the Empire Industrial Estate on
and Eagle Farm and Pinkenba on the west; Parkinson, Larapinta and Peachey Road, Yatala, and New Base
TradeCoast. While there was also Berrinba in the Logan Motorway estate in Brendale.
plenty of activity in the north and west, Corridor; and Yatala in the far
their combined total made up just south. New stock included smaller
12% of market-wide completions. freestanding and strata-titled units
built on a speculative basis.
Stock additions over the first half
of 2018 have been more subdued. Mirroring demand, stock additions are
The largest project was an 18,000 expected to be more subdued over the
square metre bottling plant for Asahi coming two years. Apart from CCA,
Schweppes at Heathwood, although large projects scheduled for completion
there were several larger premises in 2018 include new premises for Volvo
Brisbane warehouse demand and new supply
Annual % change $ Million
Forecast
20 600
Warehouse work done (RHS)
15 500
10 400
5 300
0 200
-5 100
QLD domestic demand for goods (LHS)
-10 0
2006 2007 2008 2009 2010 2011 2012 2013 2014 2015 2016 2017 2018 2019 2020 2021
Year ended June Source: ABS, BIS Oxford Economics
For Sale – 15 Nealdon Drive, Meadowbrook. LJ Hooker Commercial Brisbane.
23Aerial
24 LJ images supplied
Hooker courtesy
Commercial of Airview
Industrial Online
Market – www.airviewonline.com
Monitor 1st Half 2018Perth
Perth industrial market
Western Australian State Final Demand
(SFD) appears to have finally troughed
in FY2018, after declining a cumulative
14% over the previous four years,
including a -7.2% decline in FY2017.
SFD has increased in four of the six
quarters to the March quarter, 2018,
although the latest March quarter data
revealed a sharp -1.1% decline.
Perth eastern industrial market
Average prime Average
net face rent prime
$81 psm pa incentive 13%
Average prime Average
capital value prime yield
$1,125 psm 7.2%
2525Perth
For Sale or Lease – 4 Carson Road, Malaga. LJ Hooker Commercial Perth.
Leasing market
Leasing demand for industrial property across the Perth metropolitan area is mixed, with
enquiry levels showing positive signs in some regions, but actual deals done below the
long-term average.
The most active group in the leasing demand, prime vacancies are much by around 6% to an average $81 per
market are transport and logistics lower than for secondary stock, with square metre, with similar falls in the
companies, most – but not all – driven limited choice at the larger end of secondary market reducing rents to an
by the attractiveness of deals being the market (more than 5,000 square average $70 per square metre.
offered to consolidate and upgrade metres). However, agents report
their premises. significantly higher vacancies for Leasing incentives of 10 to 15%
secondary buildings (less than 5,000 are most common amongst both
The patchiness in the leasing market is square metres) in the east, north and prime and secondary property, with
reflected in our measure of ‘underlying southern regions. little change reported over the last
demand’. Our demand index shows six months. Incentives in the Perth
growth state domestic demand for Despite some tentative signs of industrial property market remain below
goods (as a proxy for warehouse improvement, the leasing market in those of some of the eastern states,
demand) stabilised during 2017–18 after Perth still favours tenants, with building reflecting ownership dominated by
falling for over four years. This is in line owners competing strongly to fill vacant private investors rather than institutions
with SFD appearing to reach its trough. space. This is reflected in rents. Over (whom have a greater capacity to fund
the year to June 2018, prime rents higher incentives).
Reflecting the phase of upgrader in the benchmark eastern region fell
26 LJ Hooker Commercial Industrial Market Monitor 2nd Half 2018Leasing outlook
The outlook for the industrial leasing market in Perth is one of short term weakness before
a recovery emerges early next decade.
The outlook for industrial property The substantial investment in resources the next upswing is expected to be
demand will continue to be influenced in recent years (particularly LNG) will more moderate than the last.
by the WA economy. Further declines drive growth in WA’s exports over
in LNG-related construction over the the short to medium term, however, The economic pattern described above
second half of 2018 will detract from exports will not underpin new demand means it will take 12 to 18 months
growth in FY2019 and will impact SFD, for industrial space as these are before there is an increase in new net
but that essentially will be the end of the transported directly to the ports. demand for industrial property in Perth.
mining investment bust. Investment has a much stronger Ongoing weakness in ‘underlying
multiplier effect than production, and it demand’ means there is unlikely to
On the positive side, we are forecasting is investment activity that filters down to be a broad based recovery in rents
another year of growth in new public industrial property demand. or improvement in leasing incentives
investment driven by increases in required to finalise deals. However, with
roads, rail and electricity infrastructure From early next decade, we are the downturn in resources investment
construction. However, with the NBN forecasting a solid recovery in mining now largely complete, it is unlikely that
rollout and some major roads projects and oil and gas investment, as the next rents will fall much further, if at all.
finishing, public investment is expected round of iron ore, base metals, oil and
to plateau thereafter. LNG projects kick off, underpinning a
recovery in the WA economy. However,
Perth warehouse demand and new supply
Annual % change $ Million
Forecast
30 700
Total approvals (RHS)
600
20
500
10 400
0 300
200
-10
100
WA domestic demand for goods (LHS)
-20 0
2006 2007 2008 2009 2010 2011 2012 2013 2014 2015 2016 2017 2018 2019 2020 2021
Year ended June Source: ABS, BIS Oxford Economics
For Lease – 180-182 Daly Street, Belmont. LJ Hooker Commercial Perth.
27Perth
For Lease – 180-182 Daly Street, Belmont. LJ Hooker Commercial Perth.
Investment market
Investment activity in the Perth industrial market was moderate during FY2018,
with deals struck across the value ranges. At least three major sales (greater than $10
million) were concluded in the last six months.
There was no dominant investor Properties which are vacant or have above prime property most common.
category buying industrial properties short WALEs are proving more difficult
in Perth during this period. The largest to sell. Investment activity in Perth is In the short term, the flow of funds
recent sales report included Lester being driven by the attractive yield seeking exposure to industrial property
Group purchasing a 9,000 square differential compared to the eastern is likely to continue to support yields
metre warehouse in Forrestfield for seaboard markets as well as the at current levels, particularly for prime
around $20 million and the city of perception that Perth is near the stock with long WALEs. Many investors
Subiaco acquiring an 8,000 square bottom of the investment cycle. are attracted to the higher yields
metre warehouse for almost $15 million, on offer in Perth compared to the
reflecting a yield of 7%. Prime industrial yields range between eastern seaboard markets. However,
6.0 and 8.3%, or an average 7.2% we question how much further yields
Solid interest from institutional at June 2018, 25 to 80 basis points will firm in Perth, particularly with our
investors remains for well-leased prime firmer than a year earlier. There is forecast of bond rates rises over the
properties, with two sale and leaseback little difference in prime yields across next three years
opportunities currently offered by Coca industrial regions. Yields for secondary
Cola and Bidfoods likely to provide properties have also firmed 10 to 20
a good indication of where yields sit, basis points over the last 12 months,
should they sell. with a margin of 80 to 130 basis points
28 LJ Hooker Commercial Industrial Market Monitor 2nd Half 2018Supply
The volume of industrial property completions across the Perth industrial market
during 2017 was well below the long run average, with less than 100,000 square
metres completed.
This year, an even lower volume of of significant projects committed to new commencement activity is unlikely
around 50,000 square metres is due proceed. The largest projects due to in the next few years unless driven
for completion, with the largest project commence in the near-term include: by pre-commitments as large-scale
approaching completion, a 21,000 businesses consolidate.
square metre warehouse at Brewer • A 20,000 square metre warehouse
Road, Canningvale, pre-committed to on Talbot Road Hazelmere, which There are few new funded major road
Sigma Pharmaceuticals. is pre-committed to Toll. or rail infrastructure projects proposed
or underway in Perth that will impact
A handful of 3,000 to 5,000 square • A 20,000 square metre distribution upon future freight movement. The
metre warehouses were also recently facility for NorthLine Transport at largest is the circa $1 billion NorthLink
completed in Canningvale. In the the Roe Highway Industrial Park at WA, which is due in 2019. This road
current weak leasing market, major Kenswick. link will connect Morley and Muchea
projects require pre-commitment to in the North with Gateway WA at the
The latest approvals data to May
proceed, with few developers prepared Perth Airport. However, any significant
2018 confirm the subdued outlook
to build on a speculative basis. influence on the distribution of industrial
for construction, with activity close to
supply from this project will only
The outlook for new industrial supply historical lows at $300 million (in MAT
become evident once it is completed
is subdued. There are only a handful terms). Given the outlook for demand
and demand starts to recover.
and the leasing markets, a rebound in
Sold – 267 Great Eastern Highway, Belmont. LJ Hooker Commercial Perth.
29Aerial
30 LJ images supplied
Hooker courtesy
Commercial of Airview
Industrial Online
Market – www.airviewonline.com
Monitor 1st Half 2018Adelaide
Adelaide
industrial market
The South Australian economy has
finally gained traction over the past
two years after six years of anaemic
growth. State Final Demand rose
3.2% in FY2017 and an estimated
3.4% in FY2018, albeit the March
2018 quarter registered a contraction.
Business investment rebounded
almost 5% in FY2018 and another
6% rise is forecast for FY2019. The
recovery has been led by non-
residential building and a turnaround
in private engineering construction.
Adelaide inner north industrial market
Average prime Average
net face rent prime
$113 psm pa incentive 12.5%
Average prime Average
capital value prime
$1,450 psm yield 7.8%
3131Adelaide
Sold – 376-378 South Road, Richmond. LJ Hooker Commercial Adelaide.
Leasing market
Reflecting the recent burst of economic growth, gross leasing activity appears to have
strengthened in the latter part of 2017 and into the first half of 2018.
The transport and warehousing metres at Gillman) and Agribits (3,728 Leasing outlook
sector continues to be a key driver square metres at Wingfield).
of demand, supported by advanced There are numerous government
manufacturing and defence-related In the pre-commitment market, initiatives that could lift employment
occupiers. Vacancy rates are generally Tyremax is taking 6,500 square growth, household income and with it
contained for prime and better metres in Gillman and Australian demand for industrial space. The most
quality secondary property, although Clinical Labs will take a 2,500 square talked about are the various defence
there has been some increase in metre laboratory at the Airport contracts. There is also considerable
the outer north due to the closure of Business District. investment in road projects, which have
automotive-related tenants. indirect benefits through changes in the
Both prime and secondary rents have accessibility of different industrial areas.
Recent larger leases include: Smith been broadly flat in most precincts
Brothers and Specialised Solutions for the last 12 months, although there Though demand is modest, low
at the Western Plant building in the have been some gains in the inner west levels of supply mean vacancies are
Tonsley Innovation Hub (taking a total and inner north regions. We estimate contained and there’s little risk of
of around 12,000 square metres; both the June 2018 average prime face rent speculative development to upset this
have an option to subsequently buy in the inner north at $113 per square situation. The best chance of rental
their premises); Fletchers Insulation metre, up 3% since June 2017. Leasing growth is in fully built-out estates in
(4,657 square metres at Salisbury incentives are stable, at around 10 to the prime inner north region. Tenant
South); WA Freight Group (4,110 square 15% in the prime market. relocation and upgrading will also
impact demand.
32 LJ Hooker Commercial Industrial Market Monitor 2nd Half 2018Investment market
The dollar value of investment transactions was moderately strong over the 2018
financial year, at over $200 million. The largest transaction came at the end of 2017
with the sale of the GM Holden site at Elizabeth in northern Adelaide Pelligra Group.
The only notable sale in first quarter investors remain the most active, correlated, but the relationship is not
2018 was of 33–49 London Road, Mile focussing on smaller properties. 1:1. Yields tend to follow bond rates
End South for $7.8 million. This is one of part of the way, both up and down,
10 flour milling and bakery operations Prime yields have firmed marginally and with a delay. In recent years, falling
sold by Allied Pinnacle to Qualitas for a since mid to late 2017, causing a bond rates were instrumental in driving
new food infrastructure fund. slight uplift in average capital values. down property investment yields.
We estimate the average prime yield
There were two larger sales in in the key inner north region to be The investor profile in Adelaide is
second quarter 2018: the 2,500 7.8% at June 2018. Secondary yields unlikely to change in the near term.
square metre laboratory at the are stable. Overall, yields in Adelaide AREITs are likely candidates if a large,
Airport Business District referred to remain considerably higher (that is, newly developed asset with a long
earlier, which was pre-sold by local weaker) than in eastern seaboard lease in place comes onto the market,
developer Leyton Property to Barwon industrial markets. while the smaller end of the market will
Investment Partners for some $15 remain dominated by private investors
million; and 681–687 Mersey Road The outlook for yields is highly and owner-occupiers.
North, Osborne, which transacted for dependent on what happens to long
over $14 million. In general, private interest rates. The two are highly
Supply
New supply was very low in 2017, consistent with low levels of prior building approvals.
2018 has already started more strongly, with a 13,600 square metre distribution centre
for Incitec Pivot being completed at Port Adelaide.
In addition, a 3,950 square metre facility approvals languished at very low levels. Long term, there is no shortage of
for Zeiss at the Tonsley Innovation industrial land available for future
District (located on the former Stronger approvals will feed through development to cater to demand.
Mitsubishi plant) was also completed. to a pick up in completions over the However, Adelaide is also losing
These two projects, like those in 2017, next couple of years. Most projects industrial land to other uses. For
were pre-committed. are pre-committed or purpose-built for example, Caroma’s site in Norwood has
an owner-occupier. Little speculative been rezoned to mixed use following
Supply outlook space is under way, an example being acquisition by a developer, as has
Fraser Property’s 2,444 square metre Coca-Cola Amatil’s Thebarton site (to
There has been a marked pick-up in unit at Gillman as part of a larger be redeveloped after the plant closes
the dollar value of building approvals building that is pre-committed in 2019).
for industrial property over the last year. to Tyremax.
This follows a two-year period in which
Adelaide demand and industrial building approvals
Annual % change $ Million
Forecast
8 300
Total approvals (RHS) 250
6
200
4
150
2
100
0
50
SA domestic demand for goods (LHS)
-2 0
2006 2007 2008 2009 2010 2011 2012 2013 2014 2015 2016 2017 2018 2019 2020 2021
Year ended June Source: ABS, BIS Oxford Economics 33Aerial
34 LJ images supplied
Hooker courtesy
Commercial of Airview
Industrial Online
Market – www.airviewonline.com
Monitor 1st Half 2018Canberra
Canberra
industrial market
Government expenditure dominates
the economy of the ACT. In FY2017,
government recurrent spending and
public investment constituted around
two-thirds of State Final Demand
(SFD). The ongoing weakness of
government consumption expenditure
has constrained SFD over the past 3
years, with SFD recording 1.6% and
3.1% in FY2016 and FY2017 and an
estimated 2.5% in FY2018.
On a positive note, household
spending remains strong, underpinned
by the acceleration in employment
growth, picking up from 1.5% in
FY2016 to 2.7% in FY2017 and then
averaging 3.3% over the past year.
Canberra industrial market
Average prime Average
net face rent prime
$98 psm pa incentive 9%
Average prime Average
capital value prime
$1,400 psm yield 7.0%
35Canberra
Leased – Unit 1 & 2, 23 Mildura Street, Fyshwick. LJ Hooker Commercial Canberra.
Leasing market
Demand for industrial space is closely tied to the Canberra economy, which in turn
is dependent on the federal government and population growth. Underlying demand
showed considerable strength through FY2017 but softened
in FY2018.
The main drivers that underpinned the vacancy and land at Stage 1 of New which it is set to improve in line with a
demand in FY2017 were the Canberra West Industry Park has all but sold out. strengthening economy. On the other
light rail project, solid consumer However, Stage 2 has sufficient land hand, upgrader demand for new space
spending, a revival in government- to accommodate new development will continue to underwrite (limited)
funded construction projects and for some time, even though it requires construction of new premises.
booming apartment construction. servicing ahead of construction.
These have now either levelled off or Tightening vacancies and less land
started to soften. Rents have been largely flat since the available for immediate construction
start of 2016, although some upward could exert upward pressure on
All three industrial precincts continue pressure is appearing. Large prime rents, but with the land continuing
to attract non-traditional space users. warehouse rents currently average to be released at New West Industry
As a result, Mitchell has virtually no $98 per square metre, while top rents Park ahead of demand this situation
vacant land left, and some existing for smaller office/warehouse premises is unlikely to occur in the short term.
space is coming under pressure from sit at $130 to $140 per square metre. Accordingly, we expect only moderate
office development. Secondary properties typically improvements in rents over the coming
achieve between $80 and $100 per three years. Low interest rates and
Building vacancies remain tightest square metre. the associated attractiveness of
in Mitchell, while the older Fyshwick owner-occupation will limit demand
precinct has a higher vacancy rate. Leasing outlook for tenanted space – at least until
Both depend on the recycling of long interest rates start to exceed
existing premises for new stock. Underlying demand for warehousing
accommodation budgets.
Hume also has relatively low building space is expected to show declining
soften over the coming two years, after
36 LJ Hooker Commercial Industrial Market Monitor 2nd Half 2018Investment market
Yields have been steady over the past 12 months, with average prime properties selling
at 7.3% to 7.5%, while secondary assets showing any kind of risk or short-term lease
tails are typically traded in the high 9%s and upwards.
Generally, prospective buyers are still Park in Hume, asking rates dropped blocks between 5,000 and 10,000
taking some time to make decisions. significantly since its inception several square metres.
As elsewhere, WALE and strength of years ago.
covenant are the prime determinants of Investment outlook
yield and price. Pure industrial premises The latest IZ1-zoned serviced blocks,
sized between 8,300 to 9,600 square The investment market is expected to
sold within a price range of $760 to
metres each, were advertised at $118 continue to operate in a similar manner
$1,500 per square metre of NLA, while
to $144 per square metre earlier in to FY2018 over the coming two to
properties accommodating retail or
2018, but after lacklustre interest the three years. Securely leased properties
large format retail functions achieved
government commenced auctioning will command a significant premium
between $3,000 and $6,000 per
off the remaining blocks in June. The over those featuring short WALEs,
square metre.
achieved prices are yet to be made (almost) regardless of grade. However,
Industrial land sales have been relatively public. Furthermore, the Government Canberra will not be isolated from the
slow over the past 12 months. At the in early July published a tender for third risk of softening yields as a result of
ACT Government’s New West Industry stage of the precinct, containing four rising bond rates.
Supply
Construction activity has been quiet since the start of 2018, following a temporary
increase in 2017.
One of the few completions so far this activity remains modest, with approvals speculative warehouse project.
year is a 2,600 square metre building for new industrial projects falling back
at 14 Couranga Crescent in Hume’s from a sharp uptick that commenced in There is no shortage of developable
New West Industrial Estate, which September quarter of 2016 and peaked land in the ACT, although the vast
followed a 4,000 square metre factory 12 months later. majority is located in Hume. The ACT
for Viridian Glass, at 2 Paspaley Government continues to service new
Street, Access Canberra’s new vehicle Only one major project, CDC’s areas of raw land in the 56 hectare New
inspection station and three smaller Fyshwick 2 data centre, is currently West Industry Park, which at current
projects on Sawmill Circuit, within the underway and due for completion late levels of take-up should last for well
Hume precinct. this year. Meanwhile, construction over five years.
finally commenced at 48 Vicars Street,
The short-term outlook for supply Mitchell, a two-part 6,500 square metre
Canberra demand and industrial building approvals
Annual % change $ Million
Forecast
15 75
Total approvals (RHS)
10 60
5 45
0 30
-5 ACT domestic demand for goods (LHS)
15
-10 0
2006 2007 2008 2009 2010 2011 2012 2013 2014 2015 2016 2017 2018 2019 2020 2021
Year ended June Source: ABS, BIS Oxford Economics
37Aerial
38 LJ images supplied
Hooker courtesy
Commercial of Airview
Industrial Online
Market – www.airviewonline.com
Monitor 1st Half 2018Hobart
Hobart industrial market
Tasmanian State Final Demand
accelerated from 2.8% in September
2017 to 4.0% in March 2018, equal
second amongst the states and well
above the national average. While flat
government and easing non-dwelling
construction were limiting factors,
total private investment grew strongly,
underpinned by surges in engineering
construction and machinery and
equipment purchases and augmented
by solid household expenditure.
Hobart industrial market
Average prime Average
net face rent prime
$112 psm pa incentive 5%
Average prime Average
capital value prime
$1,400 psm yield 8.0%
3939You can also read