River Murray Channel Monitoring Plan
2021-22 to 2025-26
←
→
Page content transcription
If your browser does not render page correctly, please read the page content below
River Murray Channel Monitoring Plan 2021-22 to 2025-26
Acknowledgements
This plan was developed by the monitoring sub-group of the Southern Connected Basin
Environmental Watering Committee (SCBEWC): Paul Childs, Paula D’Santos, Sean Kelly,
Anthony Moore, Andrew Sharpe, Tracey Steggles, Tom Stewart, Gill Whiting, Alana Wilkes,
Jan Whittle.
Citation: Southern Connected Basin Environmental Watering Committee (2021) River Murray
Channel Five-Year Monitoring Plan 2021-22 to 2025-26, SCBEWC Monitoring sub-group,
Canberra.
The authors would like to thank the following people who contributed to the work:
• Darren Baldwin, Nick Bond, Iwona Conlan, Iain Ellis, Jarod Lyon, Paul McInerney,
Gavin Rees, Rod Oliver, Ivor Stuart, Jason Thiem, Todd Wallace, Robyn Watts,
Ben Wolfenden, Qifeng Ye, Brenton Zampatti.
• Peer reviewers, Lee Baumgartner and Ban Gawne
The SCBEWC monitoring sub-group was guided through the development of the plan by
Jennifer Hale, Michelle Dickson, Shane Brooks and Enzo Guarino.
DISCLAIMER
The contents of this publication do not purport to represent the position of the agencies that form the
monitoring sub-committee of the Southern Connected Basin Environmental Watering
Committee in any way and, as appropriate, are presented for the purpose of informing and stimulating
discussion for improved management of the Basin's natural resources. To the extent permitted by law,
the copyright holders (including its employees and consultants) exclude all liability to any person for any
consequences, including but not limited to all losses, damages, costs, expenses and any other
compensation, arising directly or indirectly from using this report (in part or in whole) and any
information or material contained in it. The authors warrant that they have taken all reasonable care in
producing this report. The SCBEWC monitoring sub-group does not warrant that the information in this
report is free from errors or omissions and does not warrant or make any representation regarding the
use, or results of the use, of the information contained herein as regards to its correctness, accuracy,
reliability and currency or otherwise. Use of the information and data contained in this report is at the
user’s sole risk. If users rely on the information, they are responsible for ensuring by independent
verification its accuracy, currency or completeness.
© Copyright Commonwealth of Australia, 2021
This work is copyright. Apart from any use as permitted under the Copyright Act 1968 (Cth), no part may
be reproduced by any process, electronic or otherwise, without the specific written permission of the
copyright owner. Neither may information be stored electronically in any form whatsoever without such
permission. With the exception of the Commonwealth Coat of Arms, the Murray-Darling Basin Authority,
VEWH, NSW DPIE EES and SA DEW logos, all material presented in this document is provided under a
Creative Commons Attribution 4.0 Australia licence (https://creativecommons.org/licences/by/4.0/). For
the avoidance of any doubt, this licence only applies to the material set out in this document.
The details of the licence are available on the Creative Commons website
(accessible using the links provided) as is the full legal code for the CC BY 4.0
AU licence ((https://creativecommons.org/licences/by/4.0/legalcode ).
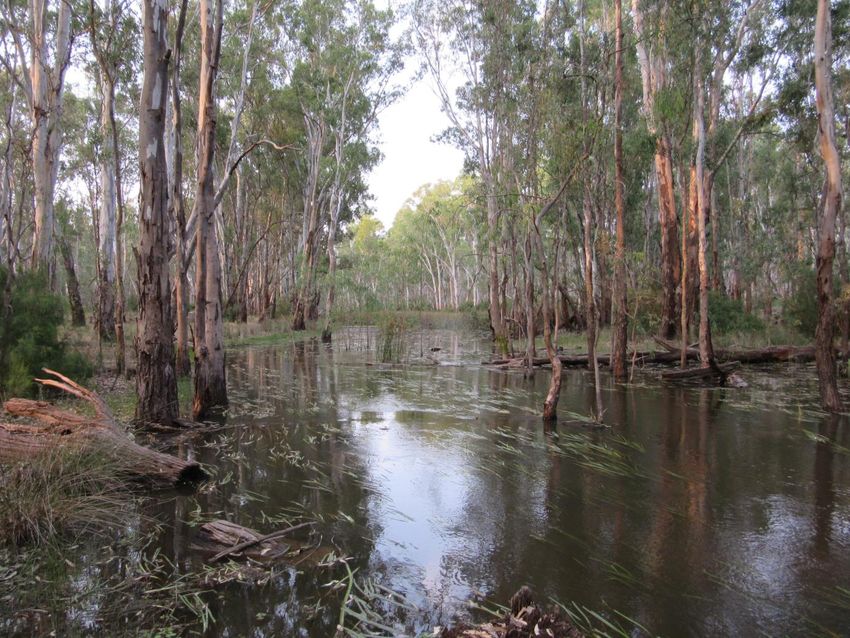
Cover photo: Water for the environment, Millewa Forest NSW (photo credit: CEWO)
Table of contents
Acknowledgements .................................................................................................................... i
Abbreviations ............................................................................................................................. iii
Summary ................................................................................................................................... iv
1     Introduction ......................................................................................................................... 1
    1.1      Context ........................................................................................................................ 1
    1.2      How the monitoring plan was developed .................................................................... 1
    1.3      Principles of the Program ............................................................................................ 2
2     River Murray Channel ........................................................................................................ 4
    2.1      Overview ..................................................................................................................... 4
    2.2      Ecological values ........................................................................................................ 4
    2.3      Water for the Environment in the River Murray Channel ............................................ 6
      2.3.1         Objectives and expected outcomes of environmental water ............................... 6
3     Key evaluation questions ................................................................................................... 9
    3.1      Themes ....................................................................................................................... 9
    3.2      KEQ hierarchy ........................................................................................................... 11
    3.3      Indicators to answer evaluation questions ................................................................ 13
      3.3.1         Productivity ........................................................................................................ 13
      3.3.2         Large-bodied native fish .................................................................................... 17
4     Monitoring design ............................................................................................................. 20
    4.1      Monitoring locations .................................................................................................. 20
    4.2      Sample design .......................................................................................................... 20
    4.3      Monitoring requirements ........................................................................................... 22
    4.4      Preferred package of monitoring ............................................................................... 23
      4.4.1         Productivity ........................................................................................................ 23
      4.4.2         Large-bodied native fish .................................................................................... 24
5     Evaluation, review and reporting ...................................................................................... 26
    5.1      Evaluation of outcomes ............................................................................................. 27
      5.1.1         Foundational information ................................................................................... 27
      5.1.2         Productivity ........................................................................................................ 28
      5.1.3         Large-bodied native fish .................................................................................... 28
      5.1.4         Integrated evaluation ......................................................................................... 31
    5.2      Monitoring program review........................................................................................ 32
    5.3      Environmental water management review ................................................................ 32
    5.4      Reporting and communication .................................................................................. 32
6     How to implement this monitoring plan ............................................................................ 34
    6.1      Governance ............................................................................................................... 34
    6.2      Co-design .................................................................................................................. 34
    6.3      Risk assessment ....................................................................................................... 36
    6.4      Data management ..................................................................................................... 37

                                                                                                                                              i
7      References ....................................................................................................................... 39
Appendix A: LTWP Objectives and targets and KEQs ............................................................ 44
Appendix B: Review of indicators and existing monitoring ...................................................... 48
    Foundational information: gap analysis ............................................................................... 48
    Productivity: indicators and gap analysis ............................................................................. 50
       Evaluation questions ........................................................................................................ 50
       Conceptual understanding ............................................................................................... 50
       Dissolved organic carbon and nutrients ........................................................................... 53
       Stream metabolism .......................................................................................................... 56
       Biofilms ............................................................................................................................. 59
       Phytoplankton ................................................................................................................... 60
       Zooplankton / microinvertebrates ..................................................................................... 63
       Higher tropic levels (e.g., decapods, Murray cod)............................................................ 65
    Fish: indicators and gap analysis ......................................................................................... 66
       Evaluation questions ........................................................................................................ 66
       Conceptual understanding ............................................................................................... 66
       Expected responses ......................................................................................................... 69
       Existing monitoring ........................................................................................................... 69
       Gaps ................................................................................................................................. 69

                                                                                                                                              ii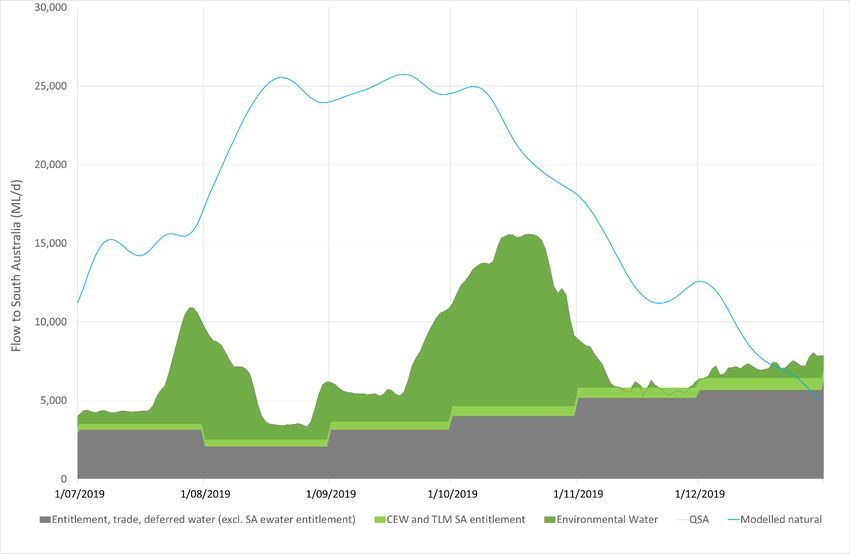
Abbreviations
ANAE            Australian National Aquatic Ecosystem
ARI             Arthur Rylah Institute
BWS             Basin-Wide Environmental Watering Strategy
CEWH            Commonwealth Environmental Water Holder
CEWO            Commonwealth Environmental Water Office
DELWP           Department of Environment, Land, Water and Planning
EPBC Act        Environment Protection and Biodiversity Conservation Act 1999
ER              Ecosystem Respiration
Flow-MER        Flow-Monitoring, Evaluation and Reporting program
GPP             Gross Primary Production
KEQ             Key Evaluation Question
LTIM            Long Term Intervention Monitoring program (now Flow-MER)
MDBA            Murray-Darling Basin Authority
MERI            Monitoring, Evaluation, Reporting and Improvement
NSW DPI         New South Wales Department of Primary Industries
NSW DPIE EES    New South Wales Department of Planning, Industry and
                Environment: Environment Energy and Science
MERI            Monitoring, Evaluation, Reporting and Improvement
OEH             Office of Environment and Heritage
SA DEW          South Australian Department of Environment and Water
SCBEWC          Southern Connected Basin Environmental Watering Committee
TLM             The Living Murray
VEFMAP          Victorian Environmental Flows Monitoring and Assessment
                Program
VEWH            Victorian Environmental Water Holder

                                                                                iii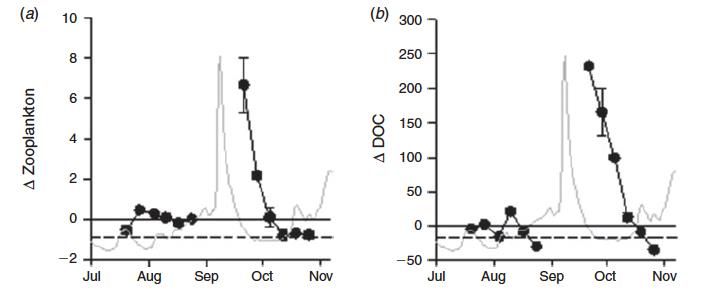
Summary
This River Murray Channel Five Year Monitoring Plan (2021–22 to 2025–26) was developed
by a multijurisdictional group of water managers to monitor system-scale responses to water
regimes in the River Murray. The monitoring plan covers approximately 2000 kilometres of
river channel from Hume Dam in NSW to Wellington in South Australia. The primary objective
of the Plan is to better understand ecological responses to flow to inform adaptive
management of environmental water. The Plan will also seeks to demonstrate outcomes
environmental water management, understand the potential benefits of relaxing constraints
and to learn from and contribute to other environmental monitoring and research programs in
the Basin.
The monitoring plan is underpinned by current science and an understanding of flow-ecology
relationships in the River Murray Channel. The monitoring plan is focussed on two themes:
productivity and large-bodied native fish; selected based on the types of coordinated flow
events in the River Murray Channel and the expected outcomes from those flow events. The
major features of the monitoring plan are:
    •   Key Evaluation Questions (KEQs) – developed by water managers to address
        fundamental knowledge gaps in the body of information needed to optimise
        environmental water use and thus maximise ecological outcomes.
    •   Indicators – of productivity and large-bodied native fish, specifically selected to
        answer KEQs.
    •   Monitoring design – a multiple before, during and after intervention approach has
        been adopted, with potential monitoring site locations chosen to include tributary
        inflows and floodplain return waters that influence river flows.
    •   Sampling – efficient use of existing monitoring that is directly relevant to answering
        KEQs with new data collection to fill gaps.
    •   Evaluation – that uses data collected from other programs in conjunction with the
        information collected under implementation of this monitoring plan to answer KEQs
        and management questions annually and integrating the results from multiple years
        over time.
    •   Review – annually to ensure monitoring is fit for purpose with respect to planned
        water delivery; independent review of the program after five years.
    •   Governance – how this program will be implemented; co-design principles; roles and
        responsibilities, data management and sharing arrangements.
The monitoring plan identifies priorities for monitoring in the first year of the program that
were chosen to help answer KEQs and inform adaptive management of environmental water
in the River Murray. Indicators selected for productivity include dissolved organic carbon,
nutrients, chlorophyll-a, phytoplankton species and abundance, zooplankton
abundance/biomass and nutritional value (stream metabolism optional if budget allows).
Indicators for large-bodied native fish include larval sampling (eggs and larvae) and if
spawning is detected, a population census (length, weight and potentially natal origin via
otoliths) is suggested.

                                                                                                 iv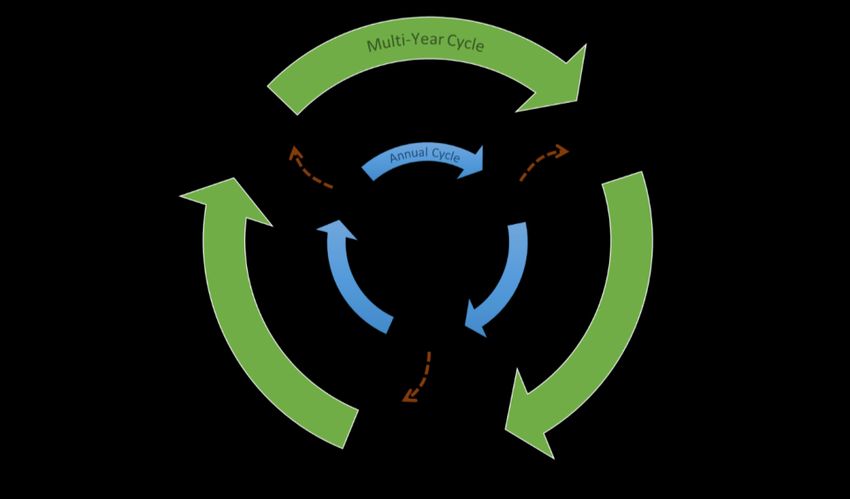
1 Introduction
1.1   Context
Environmental water management has become a significant tool for the protection and restoration
of aquatic ecosystems in the Murray-Darling Basin (the Basin). For more than a decade, adaptive
management, underpinned by intervention monitoring and numerous research projects, has
improved the efficiency and effectiveness of managed flow events for ecological outcomes.
Through improved understanding and a need to make the most of limited water in a drying climate,
there is an increasing use of coordinated flow management for multiple outcomes along connected
river and floodplain ecosystems. This includes large-scale watering events in both the Northern and
Southern Basin, where water is reused through a series of rivers, floodplains and wetlands
providing multiple benefits as it moves downstream.
In the past, many monitoring programs have focussed on evaluation of the outcomes of water for
the environment at specific sites or for discrete watering events. While information gathered in
these programs is undoubtedly useful for informing the management of larger-scale events, there is
both an opportunity and a recognised need to augment these programs with intervention
monitoring that addresses and integrates larger scale outcomes.
In recent years, environmental flows in the River Murray Channel have been coordinated with flows
in key tributaries to create flow pulses along the length of the river. Coordinated flow management
includes consideration of dam releases, channel flows, floodplain inundation and use of return
flows (water draining off the floodplains back to the channel) to improve ecological outcomes
across multiple ecosystems.
To date these large-scale coordinated watering events have been monitored through short-term
intervention monitoring projects. This River Murray Channel Five-Year Monitoring Plan (the
monitoring plan) provides the framework for monitoring responses to flows in the channel from the
Hume Dam to Wellington in South Australia for the five-year period 2021 to 2026. The Plan aims to
inform improved management of environmental water at the system-scale (the entire River Murray
Channel), providing environmental water managers with the information they need to make
evidence-based decisions.
The primary objective of the monitoring plan is:
        To better understand how key ecological indicators respond to flow to inform improved
        decision making and adaptive management of environmental water in the River Murray
        Channel.
It is expected that implementation of the monitoring plan will also contribute to secondary
objectives, including:
        To demonstrate system-scale outcomes of environmental water in the River Murray
        Channel.
        To understand the potential ecological benefit to be gained from relaxing current
        constraints to environmental water flow delivery in the River Murray.
        To inform and enhance the value of other monitoring, research and modelling programs.
1.2 How the monitoring plan was developed
Monitoring, Evaluation, Reporting and Improvement (MERI) is a process by which information
collected through monitoring is used to evaluate the impact and effectiveness of management
activities to support continuous improvement and evidence-based decision making. The MERI
process established in this document was developed, and will be implemented, through a co-
design process. The monitoring plan was developed by environmental water managers to provide
evidence to directly inform water planning and delivery decisions. The monitoring design team
comprised a multi-jurisdictional Steering Committee with representatives of the Commonwealth
Environmental Water Office (CEWO), Murray Darling Basin Authority (MDBA), NSW Department of
Primary Industry and Environment: Environment Energy and Science (NSW DPIE EES), SA
Department for Environment and Water (SA DEW), and the Victorian Environmental Water Holder
(VEWH). The Steering Committee was a sub-group of the Southern Connected Basin
Environmental Watering Committee (SCBEWC).
The co-design process began with the identification of objectives and key evaluation questions
(KEQs) based on information needs of water managers, the management of water in the River

                                                                                                  1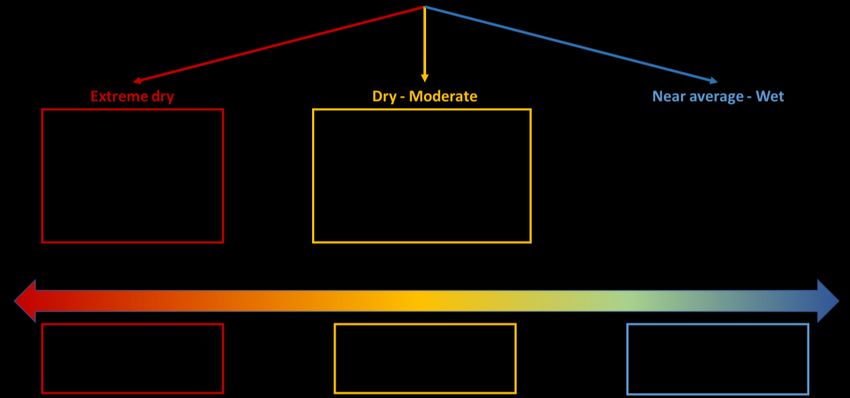
Murray Channel and the current conceptual understanding of flow-ecology relationships. Indicators
and evidence required to fill knowledge gaps and answer KEQs were identified and explored using
the scientific literature and the outcomes of previous short-term monitoring projects in the Murray
and comparable rivers.
Existing monitoring in the River Murray Channel was reviewed to identify complementary data sets
that could contribute to answering KEQs. Opportunities to leverage off existing programs and share
data and findings, including with teams developing productivity and fish population models, were
identified to ensure new monitoring is pragmatic and efficient. A program that integrated new
monitoring with existing monitoring networks was developed and documented.
Technical expertise was gathered from a range of scientists in a virtual workshop, individual
collaborations and through peer review of the monitoring plan.
The co-design process will continue through implementation with the service providers working
closely with the Steering Committee to derive annual expected outcomes and hypotheses to be
tested, complete the monitoring and evaluate the data, develop adaptive management messages
and the review of the monitoring program (see sections 5, 6 and 7).
1.3 Principles of the Program
The Basin-Wide Environmental Watering Strategy (BWS, MDBA 2019) establishes an adaptive
management process that operates at multiple spatial and temporal scales (Figure 1). This is
relevant also to the River Murray Channel where system-scale responses are to be evaluated from
multi-site monitoring and evaluated at both annual and five-year timeframes.
Consistent with the adaptive management focus of the BWS, the monitoring plan is underpinned by
the following principles:
    •   The purpose of the monitoring plan is to confirm responses and directly inform future
        adaptive management of coordinated environmental water delivery, as represented by the
        KEQs, and this drives the monitoring design and evaluation (noting that a non-response is
        a monitoring outcome that is useful for understanding eco-hydrological relationships at a
        system-scale).
    •   Monitoring and evaluation need to be suited to detecting system-scale changes as a result
        of coordinated channel environmental water delivery. The monitoring needs to be suited to
        reaches with differing hydraulic conditions as a result of river regulation (i.e., lotic and lentic
        reaches).
    •   The monitoring plan seeks to build on existing monitoring within the system to answer the
        KEQ’s (noting that the continuation of existing programs is not guaranteed, and
        contingencies will need to be considered).
    •   Where possible, monitoring of different indicators will be undertaken at the same locations
        to allow for integration of data and analysis across metrics.
    •   Depending on the indicator, the timing of sampling must capture not only the watering
        event (or natural flow), but the baseline before and after.
    •   The monitoring plan will be flexible to allow for the introduction of new indicators as
        research progresses and the efficacy and suitability of new indicators is tested.
    •   The Steering Committee is responsible for the development and oversight of
        implementation of the monitoring plan including annual review and improvement.
    •   Information collected will be shared with modelling projects being conducted by other
        organisations (e.g., CSIRO productivity models and CEWO Flow-MER project fish
        modelling; see Text Box 1).
    •   Regular data analysis and evaluation (annual and after five years) will underpin learning
        and improvement.
    •   There is a collective commitment to data sharing and making data from the monitoring plan
        available through creative commons licence.

                                                                                                         2
Figure 1: Multi-scale adaptive management (MDBA 2019).
Improving predictive models with data
Predicted responses to flow regimes underpin the planning and management of environmental
water. To deliver flow regimes to meet objectives and outcomes, the links between key
watering parameters, or levers and desired ecological outcomes need to be well understood.
This requires strong conceptual and empirical knowledge of the processes that maintain
aquatic values, the key drivers of these and their interaction with flow and non-flow related
factors. While there is now a large amount of data from monitoring and research programs
about the effects of environmental watering events on the two themes of this monitoring plan:
productivity and native fish, environmental water planning and allocations are still largely
informed by expert opinion (Webb et al. 2015).
Ecological models are being developed to improve predictive capacity for the management of
environmental water for productivity and native fish outcomes. Examples include the
development of fish population models for golden perch and Murray cod to evaluate Murray
and Murrumbidgee River constraints in NSW; Flow-MER fish population models for Murray
cod, golden perch and bony herring; Flow-MER foodweb models exploring trophic interactions
and basal food quality linkages to flow and non-flow factors; and ecosystem response models
related to productivity being developed by CSIRO.
Modelling outputs are strengthened by quality data collected from sites across the Basin.
Experts have identified data this monitoring plan could potentially contribute:
• Fish:
o fish larval sampling in the River Murray Channel between Torrumbarry and the
South Australian border
o population structure
o population size/abundance (using capture-mark to enable capture-mark-
recapture techniques)
o estimations of sampling efficiency
• Productivity
o biomass at multiple trophic levels
o productivity hotspots in the River Murray Channel
Text box 1: Improving ecological models.
32 River Murray Channel
2.1 Overview
The River Murray rises in the Great Dividing Range and flows west then south to discharge to the
sea in South Australia. Despite being Australia’s longest river, natural flows are, on a world-scale,
low and highly variable as a result of high interannual variability in rainfall (Maheshwari et al. 1995).
The river is highly regulated with the large Hume Dam upstream of Albury, a high-level weir at
Yarrawonga, 13 low-level weirs extending from Euston in NSW into South Australia and barrages
across the estuary near the river mouth. Diversions have resulted in a reduction in end of system
discharge by over 50% (Maheshwari et al. 1995) and generally slower, less variable flows. There
has also been a change to the seasonality of flow in the mid-Murray, with the majority of river flows
in this section of the river occurring in summer and autumn during peak irrigation demands
(Overton et al. 2009). In contrast, annual flows in the lower Murray are much reduced in volume.
The seasonality of flows is retained, with flows peaking in spring/summer, but their magnitude is
less, reducing the extent and frequency of floodplain inundation.
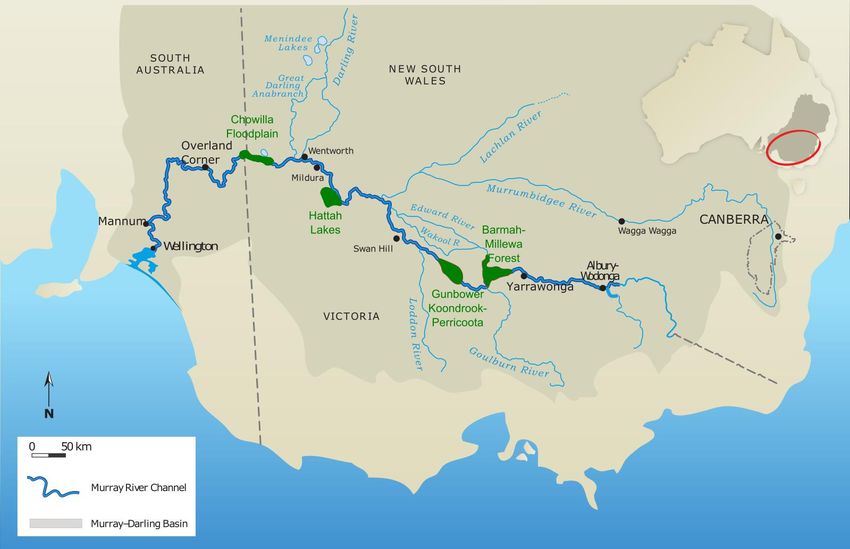
This monitoring plan covers 2152 kilometres of the River Murray Channel from Hume Dam to
Wellington (the River Murray Channel Icon Site; Figure 2). Thoms et al. (2000) described the zones
of the River Murray with respect to geomorphology and hydrology. The zones relevant to the River
Murray Channel Icon Site are:
• Hume Dam to Yarrawonga – where the river is characterised by a complex system of
anabranches with multiple channels carrying a portion of the flow. Includes the Victorian
tributaries of the Kiewa and Ovens Rivers.
• Yarrawonga to the confluence of the Edward/Kolety-Wakool – where the river has a wide
floodplain, including the large floodplain forests of Barmah-Millewa and Gunbower,
Koondrook-Perricoota. Includes the Victorian tributaries of the Broken, Goulburn and
Campaspe Rivers and the NSW Edward/Kolety-Wakool anabranch system.
• Edward/Kolety-Wakool to the Darling Confluence – where the river has a single wide
channel and includes the Hattah-Kulkyne Lakes floodplain site and the tributaries of the
Loddon River (Victorian) and the Murrumbidgee River (NSW). This section contains locks
11 and 15.
• The Darling/Baaka River confluence to Overland Corner – where the river flows in a wide
valley and passes the Chowilla floodplain. There are seven locks (4 to 10) in this section
of the river
• Overland Corner to Mannum – where the river is confined to a limestone gorge, with a
narrow (two to three kilometre wide) floodplain. This section contains locks 1 to 3.
• Mannum to Wellington – where the river remains confined to a narrow floodplain, a large
part of which has been developed for agriculture and is disconnected from the river by
levee banks.
2.2 Ecological values
The River Murray Channel supports significant ecological values including riparian vegetation,
native fish, macroinvertebrates and important ecosystem functions. Large areas of floodplain, in
particular, influence the ecosystem functions and processes of the River Murray Channel (Baldwin
and Mitchell 2000, Gawne et al. 2007, Baldwin et al. 2016, Nielsen et al. 2016). Inundation of
floodplain ecosystems can mobilise large amounts of carbon and nutrients which enter riverine
food webs with return waters. Return flows can also mobilise secondary production on the
floodplain flushing phytoplankton and zooplankton into the river that supplements river food webs
(Furst et al. 2014, Nielsen et al. 2016). River regulation has decreased floodplain river connectivity
altering the flow of energy through food webs. Restoring some of these energy pathways is a key
objective for environmental watering.
Aquatic vegetation is not a common feature of most of the central Murray (Hume Dam to the
Darling/Baaka River) due to high turbidity and unstable sediments (Thoms et al. 2000). The weir
pools in both NSW and South Australia, however, provide stable water conditions that encourage
the growth of emergent macrophytes such as common reed (Phragmites australis) and Typha, as
well as submerged species including eel grass (Vallisneria spiralis), water milfoil (Myriophyllum
spp.) and pondweed (Potamogeton spp.) (Gehrig and Nicol 2010, Ecological Associates 2015 p.
15). The riparian zone along the length of the River Murray Channel is dominated by river red gum
(Eucalyptus camaldulensis), with some invasion by willows particularly where water levels are
stable.
4Figure 2: Location of the River Murray Channel Icon Site (MDBA 2019).
At least 25 species of freshwater native fish (excluding estuarine species) are expected to occur in
the River Murray Channel Icon Site (Ellis et al. 2016) including several threatened species. Murray
cod (Maccullochella peelii), trout cod (M. macquariensis) and silver perch (Bidyanus bidyanus) are
all listed as threatened nationally under the Environmental Protection and Biodiversity
Conservation Act 1999 (EPBC Act). Several other species such as freshwater catfish (Tandanus
tandanus) and olive perchlet (Ambassis agassizii) are protected under state legislation.
The Sustainable Rivers Audit rated fish populations in the Murray between Hume Dam and the
Darling River/Baaka as poor, and downstream of the Darling River as very poor (MDBA 2012). The
poor condition reflected that less than half of the expected number of native species were recorded
in each region and that there was a high number (and biomass) of introduced species. More recent
assessments indicate that the fish communities in the Lower Murray are typical of low flow
conditions, with a higher abundance and diversity of small-bodied native fish species and low
recruitment of native large-bodied flow-cued spawners (Ye et al. 2020). A study of fish populations
in the River Murray in NSW indicated that fish communities in the reaches between the Hume Dam
and the Edward/Kolety-Wakool confluence were in generally poor condition and in fair to good
condition in the reaches between the confluence of the Murrumbidgee River and the South
Australian border (Riches et al. 2016).
Environmental watering aims to improve the abundance, richness and distribution of native fish
communities in the River Murray system by increasing the frequency of hydrologic spawning
triggers, improving hydraulic conditions for nesting fish and drifting larvae during breeding seasons
and increasing the availability of high-quality food resources for larvae and juvenile fish as they
develop.
For First Nations in the southern Basin, all waterways, communities, plant and animal species exist
as an interconnected whole. First Nations people have an intricate and enduring connection to
water. Cultural traditions, stories and knowledge are entwined in First Nations custodianship of
water resources. The common goal of improving and sustaining the health of our waterways can be
better achieved through collaboration.
52.3 Water for the Environment in the River Murray Channel
SCBEWC is the coordination committee that supports the delivery of water for the environment in
the River Murray system across multiple environmental water holders, managers and jurisdictions.
In recent years, SCBEWC has increasingly focused on targeting environmental outcomes for the
River Murray Channel and its floodplain from Hume Dam to the sea. The River Murray receives the
most environmental water of any asset within the Murray-Darling Basin. Water delivery options are
evaluated each year, informed by watering proposals developed for the channel downstream of
Yarrawonga and Torrumbarry weirs, and the SA section of the River Murray. Watering needs of the
channel, important wetland sites along the River Murray Channel and opportunities to leverage
from natural flows, operational deliveries and environmental flows from tributaries are all important
considerations in water delivery planning.
Water delivery in the River Murray at this point of time is constrained by several factors:
• Operational and management constraints as a result of sharing channel capacity with
consumptive users and conflicting priorities for the release of held water (MDBA 2013).
• The Barmah Choke, which has a channel capacity of 10,600 ML/day during summer and
autumn (to protect the forest from unseasonal flooding).
• Current limitations on maximum flow rates due to the potential impacts to third parties:
o Regulated flows from the Hume Dam, are limited to < 25,000 ML/day at Doctor’s
Point (located downstream of the Kiewa River confluence) (MDBA 2013)
o Regulated flows downstream of Yarrawonga Weir when inundation of Barmah-
Millewa Forest is desirable can be delivered up to 3.0m AHD at the Tocumwal
Gauge (approximately 15,000 ML/day downstream Yarrawonga), with the option of
flow up to 3.3m AHD at Tocumwal (approximately 18,000 ML/day downstream
Yarrawonga, subject to consultation with affected landholders and Basin Officials
Committee support). A trial of flows up to 3.3 metres AHD at Tocumwal may occur
in coming years, subject to seasonal conditions, water availability and the
outcomes from consultation with potentially affected landholders.
• Limitations to the magnitude of environmental releases that can be made from various
tributaries due to flow constraints within those tributaries.
• Limitations to the magnitude of releases that can be made from Lake Victoria, to top up
flows to South Australia.
Basin states are contributing to works under the Constraints Management Strategy (MDBA 2013)
that aim to address/relax these limitations to improve outcomes that can be achieved from water for
environment delivery.
2.3.1 Objectives and expected outcomes of environmental water
Ecological objectives and targets for environmental water delivery in the River Murray Channel are
established in two regional Long-Term Watering Plans (LTWP; see Appendix A): Long-Term
Environmental Watering Plan for the South Australian River Murray Water Resource Plan Area
(Department of Environment, Water and Natural Resources 2015); Murray–Lower Darling Long
Term Water Plan (Department of Planning, Industry and Environment 2020) and informed by the
Basin-wide Environmental Watering Strategy (2019).
On an annual basis1, considerations of antecedent conditions, climate, river flow predictions and
water resource availability are used to identify ecological objectives of environmental water delivery
for the River Murray Channel for a range of possible climate conditions. As an indicative example,
the objectives for environmental watering in the River Murray Channel during 2020-21 are as
follows (MDBA 2020):
River connectivity and native vegetation
• Improve longitudinal connectivity through the River Murray, supporting ecologically
important functions through shaping the pattern of how the river is flowing.
• Improve lateral connectivity to the wetlands and floodplains either side of the river
where overbank flows are targeted.
1 While a review of the environmental water objectives is undertaken each year as part of the planning
process, it is recognised that not all objectives are required to be achieved each year. For example, long-lived
fish species do not necessarily recruit every year.
6• Mitigate against water quality issues resulting from stratification of weir pools under low
flow conditions, especially in the lower Murray.
Native fish
• Create or maximise opportunities to increase the distribution and abundance of short to
moderate-lived native fish species.
• Provide conditions for the improvement in population structure of moderate to long
lived native fish species such as golden perch, Murray cod and freshwater catfish.
• Support Murray cod breeding in the mid-Murray through increased habitat and stable
flows with no sudden drops in river level during spring (supported by River Murray
flows and regulator opening strategy to provide off-river access).
• Support flow pulse specialist fish spawning and recruitment through the delivery of a
spring pulse of sufficient magnitude and duration.
Priority ecosystem function
• Provide and protect a diversity of refugia across the landscape.
• Create quality instream, floodplain and wetland habitat.
• Provide movement and dispersal opportunities for water dependent biota to complete
lifecycles and disperse into new habitats.
• Support nutrient, carbon and sediment transport along channels, and between
channels and floodplains/wetlands.
• Support instream and floodplain productivity.
Environmental watering is also expected to provide benefits for species and locations of cultural
significance. SCBEWC includes representatives of First Nations people to improve the alignment
between environmental water coordination and cultural values. Guidance has been sought from
First Nations people on key messages and principles that can be incorporated into environmental
water planning for the River Murray on an annual basis. As engagement and collaboration
continues to evolve in coming years, cultural outcomes will be better reflected in this monitoring
plan.
Environmental objectives and watering actions within the year are generally scaled depending
upon seasonal conditions and water resource availability. For example, during extremely dry
conditions, the main ecological objectives will be related to supporting key refuge sites and
avoiding severe impacts to ecological values. During moderate conditions the objectives may relate
to maintenance of communities and ecosystem health and during wet periods, environmental water
can be used to augment natural flows to improve ecological health and build resilience (Figure 3).
Figure 3: Example of the use of resource availability scenarios in environmental water planning (MDBA 2020).
An example of coordinated spring flow planning in the River Murray, including monitoring results, is
provided in Text box 2. It is expected that there is scope to enhance outcomes within a constrained
environment via adaptive management, underpinned by monitoring that moves from site-based to
integrated whole of system-scale monitoring.
7Southern Spring Flow 2019
In 2019, SCBEWC coordinated a 330 GL system-scale environmental watering event along the
River Murray Channel. A small natural overbank flow in winter 2019 prompted the use of
environmental releases from Hume Dam in August that were planned to augment a predicted
natural flow pulse. The predicted rainfall, however, did not eventuate, and flow targets were not met.
Adaptive management decisions were made, and a small winter pulse of 10,500 ML/day
downstream of Yarrawonga was sustained to inundate emerging vegetation in Barmah-Millewa
Forest. In September, spring releases were increased and a 15,000 ML/day flow target downstream
of Yarrawonga was delivered during September and October 2019. This resulted in around 25% of
the Barmah-Millewa Forest being inundated, supporting ecosystem processes, native fish,
floodplain vegetation and waterbirds, including the threatened Australasian bittern.
Flows reached a further six Ramsar listed wetlands including Gunbower Forest, Koondrook-
Perricoota Forest, Hattah Lakes, Riverland (Chowilla) and the Coorong. The spring release from
Hume Dam was coordinated with releases from Lake Eildon in the Goulburn River to create a pulse
along the length of the River Murray Channel. This resulted in flows above 15,000 ML/day at the
South Australian border for 11 days (Figure 4).
Short-term intervention monitoring indicated that the inundation of Barmah-Millewa Forest and
return flows to the River Murray Channel resulted in improved productivity outcomes in the central
Murray below the forest (Furst et al. 2020; Rees et al. 2020). In addition, the in-channel pulse in the
lower Murray increased flow velocity and inundated littoral habitat, also resulting in increases in
zooplankton (Furst et al. 2020). While only short-lived increases in carbon and nutrients were
detected downstream of Echuca, and no increases in the Lower Murray, it is likely that any new
carbon entering the river was quickly incorporated into the food web, and hence not detected in
sampling (Rees et al. 2020). This illustrates the importance of multiple indicators of productivity and
the integration of information across indicators to gain a more complete understanding of the trophic
responses to environmental flows.
Figure 4: Hydrograph at the South Australian border during the Southern Spring Flow 2019 (MDBA
2020).
Text box 2: River Murray Channel Southern Spring Flow 2019.
83 Key evaluation questions
Key evaluation questions (KEQs) have been used to guide the development of the monitoring plan
in accordance with the program objectives. The KEQs inform the selection of monitoring indicators
and the timing and frequency of their measurement. They also direct the analysis and evaluation by
focussing on the evidence that is required to answer the questions. This approach helps ensure
that monitoring undertaken is relevant and appropriate to the program objectives. As the monitoring
plan evolves an important adaptive management step will be for environmental water managers to
assess the collected evidence to decide if the KEQs have been adequately answered to inform
decisions about how to direct future monitoring efforts.
3.1 Themes
Productivity and native fish (specifically breeding of golden and silver perch and Murray cod) were
chosen as themes to focus the monitoring plan. These themes reflect the expected system-scale
outcomes from flow events that are planned to be delivered through the River Murray Channel (as
opposed to individual sites or wetland focus). Fish and productivity outcomes are key targets for
River Murray Channel watering actions, influencing. Information from monitoring and evaluation
that refines delivery decisions regarding flow rates, durations and volumes is expected to enhance
these outcomes.
While there is established science that underpins the relationship between hydrology, productivity
and outcomes for fish, knowledge gaps remain. Many of the KEQs developed for the monitoring
plan aim to better understand these connections to inform adaptive management of water for the
environment. The results also have the potential to inform delivery of operational flows and/or the
management of river infrastructure.
Coordinated spring flow events are expected to have detectable increases in ecosystem
productivity (basal food resources through to higher trophic levels), trigger fish spawning and
enhance larval development in various parts of the River Murray channel. Implementation of the
monitoring program aims to quantify the effect that coordinated spring flows have on various
productivity and larval fish indicators and compare those effects to what may happen without the
coordinated event as well as responses to natural events.
The selected indicators are expected to provide useful information without having to rely on
extensive co-variates. They are also considered to be relatively cost effective and provide an
opportunity to leverage off and complement existing state, CEWO, TLM and MDBA monitoring and
evaluation programs.
A general description of the expected ecological outcomes for the focus themes from spring flow
delivery in different parts of the River Murray Channel (Figure 5), provides the basis for the
development of KEQs and identification of indicators to address those KEQs.
9Lower Murray (See Bice et al. 2014 for more detail) Mid Murray Barmah-Millewa Forest and river reach immediately downstream
(Euston to Wellington) (downstream Torrumbarry to Euston)
Hydraulic conditions Hydraulic conditions Hydraulic conditions
• This reach of the River Murray is characterised by a series of weir pools and is influenced by • This reach of the River Murray is largely free-flowing without the influence of • Higher flows delivered overbank in winter-spring will inundate areas of the
flows from the Mid Murray and tributaries, the Darling/Baaka and Lake Victoria operations. weir-pools. Barmah-Forest floodplain, with return flows passing downstream in the River
Murray Channel and to the Edward/Kolety-Wakool system.
• During regulated conditions, the weir pools have the effect of slowing down water velocities. • Significant inflows (either managed or natural) enter this reach via the
High flow events and/or lowering weir pool water levels can increase flow velocities (note Goulburn, Campaspe, Edward/Kolety-Wakool and Murrumbidgee rivers. • Flow rates of ~15,000ML/d downstream of Yarrawonga Weir inundate
detailed relationships between weir pool height and in-channel flow velocities have been around 25% of the Barmah-Millewa Forest with water entering the forest via
• Water may be diverted into floodplain sites of Gunbower-Koondrook-
established for many of the weir pools in this reach; Ye et al. 2020). Conversely, weir pool a series of regulators. Higher flows will inundate a greater extent.
Perricoota and other smaller forests, however the volume of water returning to
raising has the effect of improving lateral connectivity with low-lying floodplain wetlands and
the river from managed events is expected to be relatively small compared to • Managed overbank flows using environmental water will have gradual rates
anabranches while decreasing water velocities.
return flows from floodplain sites in other zones. of rise and fall.
• Coordinated spring flows in the Lower Murray creates hydraulic diversity within weir pools and • Coordinating spring environmental flows in the River Murray Channel with • Multiple effluent channels distribute water onto and across the floodplain
provide some water level variation in the tailwaters that would not occur otherwise. Substantial tributary inflows results in a small increase in water levels in the Channel with water gradually returning back in-channel downstream of Barmah Lake
increases in lotic habitat (>0.3 m/s) are observed across the upper parts of the Lower Murray inundating small areas of the riverbank. Flow timing and magnitude can be and 200km downstream at the Wakool junction. Higher flows will result in a
River weir pools when flows to South Australia are in the order of 15,000 ML/day, but lotic shaped to provide flow variability or pulses to improve in-channel velocity and small increase in water levels inundating small areas of the riverbanks, with
conditions in the lower parts of the weir pools are still not achieved at this flow (Ye et al. 2020). hydraulic diversity. flow variability or pulses improving in-channel velocity and hydraulic diversity
To achieve lotic conditions in the lower weir pools flow pulses of ~20,000 ML/day are needed Productivity response Productivity response
or coordinated weir pool lowering of 1m at each weir pool between locks 1-6 (not achievable in
the near term or life of the monitoring plan) (Ye et al. 2020). • Productivity in this section of the River is influenced by return flows through • The main contributor to productivity increases in this reach will be return
Barmah-Millewa Forest and flows from the Goulburn, Edward/Kolety-Wakool flows from inundated parts of Barmah Millewa Forest (Nielsen et al. 2016).
Productivity response and the Murrumbidgee Rivers (Gawne et al. 2017). • Inundation of the forest mobilises floodplain carbon and nutrients and
• Productivity in this reach is expected to primarily be generated locally, via influences such as • While higher flows will wet more areas of the riverbank releasing small provides conditions for zooplankton to grow in wetlands and creek lines. The
coordinated delivery of spring pulses and weir pool level variation successively wetting and amounts of carbon and nutrients, the main source of productivity in this reach quality and quantity of basal food resources produced on the floodplain
drying fringing low-lying areas. Recent monitoring has highlighted that stable weir pool levels is expected to be via run-off from upstream floodplain sites and tributary differs from that produced within the main river channel and therefore are
strongly constrain local production (Ye et al. 2020). Transportation of carbon, nutrients and inputs. important contributors to riverine food webs (Gawne et al. 2007).
zooplankton from upstream sources is not expected to be a significant source of increased • Carbon, nutrients and zooplankton are transported from the forest floodplain
productivity during managed environmental flow events within current constraints (Furst et al • Productivity responses to managed flows in this zone are expected to be most to the River Murray Channel via floodplain return flows. These are expected
2020). evident immediately downstream of input sources (e.g., floodplain return flows to increase the abundance and diversity of basal food resources in the River
and tributary inflows). More widespread productivity responses will likely Murray channel downstream of the forest (Gawne et al. 2007).
• Return flows entering from floodplain sites such as Hattah, Lindsay-Mulcra-Walpolla and require larger flows (Furst et al 2019; Rees et al 2020; Rees et al 2021) that • The effect on the River Murray channel food web is expected to vary in the
Chowilla following managed inundations are expected to generate a localised productivity cannot be actively delivered within current operating constraints. following ways (Gawne et al. 2007):
response, however this is expected to be relatively small for managed events as the volume
Fish response o Area of floodplain inundated – greater inundation extent within the
returning will be small relative to the flow rate in the main channel (Wallace and Furst 2016,
forest is expected to have a larger productivity response in the river
Furst et al. 2019). • There is a significant knowledge gap about spawning and recruitment of downstream.
Fish response native fish species in this section of the river (I. Stuart pers. comm). o Time between inundation events – wetting events following a long dry
• Golden perch spawning has been detected in upstream tributaries, such as interval are expected to deliver larger productivity outcomes in the
• Sustained flows greater than 18,000 ML/d (possibly higher e.g., 20,000 ML/d) with water downstream river channel than inundation after a short dry interval.
temperature above threshold levels (~late spring) are needed at the SA border to cue golden the lower Goulburn with these larvae thought to drift downstream to the River
Murray where their fate remains unknown (Zampatti and Lee 2013). o Season – productivity responses are expected to be larger in warm
and silver perch spawning (Zampatti et al. 2015). weather/seasons than cool seasons.
• Downstream drift of golden and silver perch larvae into the Lower Murray is expected to occur • A flow pulse of sufficient magnitude and velocity is expected to trigger Fish response
under high flow conditions to leading to enhanced recruitment. Contributions from the localised spawning of golden and silver perch within this reachKing et al.
Darling/Baaka may be of particular significance for golden perch larvae distribution when 2009). • Murray cod are expected to establish nests in spring within the river channel
and creeks of the forest. Maintaining stable water levels during the nesting
water is available and timed with elevated Murray flows to promote dispersal into the Murray • Higher in-channel flow rates increase flow velocities facilitating larvae period to keep nests submerged and to avoid rapid drops in water levels, will
including u/s towards Torrumbarry. Such flows may also attract fish from the Murray into the dispersal from upstream to downstream sites. Natal origin studies indicate that
Baaka system (Koehn et al. 2020). enhance the survival of eggs and larvae (Tonkin et al. 2020).
some strong cohorts of golden perch in the Lower Murray originated in the Mid • Providing some variability in flows (e.g., increasing from 12,000 ML/d d/s
• Murray cod are expected to spawn and recruit locally in the lower Murray each year. However, Murray (Zampatti et al. 2015). Yarrawonga to 14,000 ML/d followed by gradual recession) once water
research has shown that that Murray cod recruitment is limited under predominantly lentic • Murray cod are expected to establish nests in spring within the river channel. temperatures are above threshold levels are expected to generate silver
conditions and that there is a positive association between recruitment and flow in the main Maintaining stable water levels during the nesting period to keep nests perch spawning within the river channel (Tonkin et al. 2020).
River Murray Channel (Ye et al. 2020). Providing elevated flows above 20,000 ML/day at the submerged and to avoid rapid drops in water levels, will enhance the survival
South Australian border will increase the quantity of lotic habitat in the lower Murray and of eggs and larvae (Tonkin et al. 2020).
therefore should improve Murray cod recruitment.
Figure 5: General description of expected ecological outcomes (associated with environmental water releases).
103.2 KEQ hierarchy
The KEQs were developed by a multi-jurisdictional group of environmental water managers with
significant operational experience in planning and delivering system-scale environmental water
events along the River Murray. Information that informed the KEQs included:
• The likely magnitude, timing and duration of coordinated spring flow events in the River
Murray Channel.
• Environmental objectives of coordinated spring flow events in the River Murray Channel.
• Likely response time and extent to which a response relies on other factors that cannot be
controlled.
• Environmental and management importance of expected response.
• NSW and SA River Murray Long-Term Watering Plans.
• Knowledge gaps identified through operational experience and past monitoring and
research.
This led to the development of evaluation questions (Figure 6) using the following hierarchy:
• Aspirational goal / vision – overarching goals to which information collected across multiple
programs (monitoring, research and modelling) will contribute.
• Long-term questions – that will be answered by information from a range of monitoring and
research programs to which the River Murray Channel Monitoring Plan will contribute.
• Intermediate questions – questions to be answered from data collected over the five years
of the program, hopefully spanning a range of climatic and flow conditions.
• Immediate questions – to be answered annually from conditions experienced before,
during and after environmental watering.
• Foundational information – baseline information about hydrology that supports the
evaluation of ecological responses.
11Aspirational Basin Plan (5.03): The restoration and protection of water-dependant ecosystems and ecosystem functions in the Murray-Darling Basin with strengthened resilience to
goal / vision climate change and other risks.
Relaxed constraints Improved coordination of environmental water for system scale outcomes Improved understanding of flow ecology relationships
Long term Will relaxed flow How does environmental water What is an What are the flow How could
How could environmental
questions constraints scenarios contribute to the quality and ecologically related limiting factors environmental water
enhance native fish quantity of food resources and meaningful water management be to recruitment of management be
(10 years)
improved to enhance
breeding and recruitment their transfer through food magnitude of golden perch and improved to enhance
golden perch and silver
outcomes in the RMC webs in the River Murray response in silver perch in the Murray cod
perch populations in the
compared with the Channel to support native fish productivity and fish RMC and southern populations in the
River Murray Channel?
existing flow constraints? recruitment? recruitment? basin? River Murray Channel?
Intermediate How does How does How did e- Is there a
questions How does Is there a
environmental hydrology water correlation How does hydrology How does weir How does e-
(5 years) hydrology correlation
water (magnitude, management between (magnitude, timing, pool raising and water
(variability, between
management timing, water over the past productivity water source) and e- lowering impact management
magnitude, productivity
influence the source) five years and water management golden and affect Murray
timing) affect and Murray
hydrological influence the influence recruitment (to influence recruitment silver perch cod
Murray cod cod
conditions quality, quantity productivity YoY) of golden (to YoY) of golden larvae survival recruitment
recruitment recruitment
along the and persistence along the perch and perch and silver and and
and and
length of the of productivity length of the silver perch in perch in the RMC? recruitment? condition?
condition? condition?
RMC? in the RMC? RMC? the RMC?
Immediate How did e- How did productivity (quality and quantity) Are golden perch and What was the breeding What was the What was What was
questions water influence in the RMC vary spatially (along the length silver perch larvae response (eggs, larvae, survival (to the relative the condition
(annual) hydrology? of the River) and temporally (over what present in each YoY) of golden perch and YoY) of abundance of Murray
How could it period of time was productivity enhanced). reach? What time of silver perch and how did this golden perch of age cod (length-
be better What were the hydrological conditions year? What volume / vary spatially and temporally and silver classes of weight
optimised? associated with this response? density /biomass? through the event? perch larvae? Murray cod? ratios)?
Foundation
information What was the flow at key What were the What were the relevant
What were the weir What were the sources What was the area
gauging stations along the velocities in each water quality responses
pool operations of water during the and duration of
entire length of the channel reach during the (temperature, salinity)
throughout the year? watering action? floodplain inundation?
throughout the year? watering action? during the watering action?
Figure 6: Key Evaluation Questions for the Program.
12You can also read