RNA N6-Methyladenosine Regulator-Mediated Methylation Modifications Pattern and Immune Infiltration Features in Glioblastoma - Frontiers
←
→
Page content transcription
If your browser does not render page correctly, please read the page content below
ORIGINAL RESEARCH
                                                                                                                                             published: 25 February 2021
                                                                                                                                          doi: 10.3389/fonc.2021.632934

                                              RNA N6-Methyladenosine Regulator-
                                              Mediated Methylation Modifications
                                              Pattern and Immune Infiltration
                                              Features in Glioblastoma
                                              Yimin Pan †, Kai Xiao †, Yue Li , Yuzhe Li and Qing Liu *

                                              Department of Neurosurgery in Xiangya Hospital, Central South University, Changsha, China

                                              Glioblastoma (GBM) is a group of intracranial neoplasms with intra-tumoral heterogeneity.
                                              RNA N6-methyladenosine (m6A) methylation modification reportedly plays roles in
                                              immune response. The relationship between the m6A modification pattern and immune
                                              cell infiltration in GBM remains unknown. Utilizing expression data of GBM patients, we
                            Edited by:
                                              thoroughly explored the potential m6A modification pattern and m6A-related signatures
                           Herui Wang,        based on 21 regulators. Thereafter, the m6A methylation modification-based prognostic
         National Cancer Institute (NCI),
                                              assessment pipeline (MPAP) was constructed to quantitatively assess GBM patients’
                          United States
                                              clinical prognosis combining the Robustness and LASSO regression. Single-sample
                       Reviewed by:
                                 Qi Li,       gene-set enrichment analysis (ssGSEA) was used to estimate the specific immune cell
     Capital Medical University, China        infiltration level. We identified two diverse clusters with diverse m6A modification
                       Guangyang Yu,
             National Cancer Institute,       characteristics. Based on differentially expressed genes (DEGs) within two clusters,
                        United States         m6A-related signatures were identified to establish the MPAP, which can be used to
                    *Correspondence:          quantitatively forecast the prognosis of GBM patients. In addition, the relationship
                              Qing Liu
                                              between 21 m6A regulators and specific immune cell infiltration was demonstrated in
                  liuqingdr@csu.edu.cn
     †                                        our study and the m6A regulator ELAVL1 was determined to play an important role in the
      These authors have contributed
                 equally to this work         anticancer response to PD-L1 therapy. Our findings indicated the relationship between
                                              m6A methylation modification patterns and tumor microenvironment immune cell
                     Specialty section:
                                              infiltration, through which we could comprehensively understand resistance to multiple
           This article was submitted to
                    Neuro-Oncology and        therapies in GBM, as well as accomplish precise risk stratification according to m6A-
               Neurosurgical Oncology,        related signatures.
                 a section of the journal
                   Frontiers in Oncology      Keywords: glioblastoma, m6A, immune infiltration, immunotherapy, prognosis
         Received: 24 November 2020
           Accepted: 18 January 2021
          Published: 25 February 2021
                                              INTRODUCTION
                              Citation:
    Pan Y, Xiao K, Li Y, Li Y and Liu Q       Glioblastoma (GBM) is the most common lethal neoplasm of the central nervous system,
     (2021) RNA N6-Methyladenosine
                                              accounting for approximately half of primary brain tumors and almost 60% of all types of
       Regulator-Mediated Methylation
    Modifications Pattern and Immune
                                              gliomas (1). Even after complete surgical removal combined with adjuvant therapy, for example
  Infiltration Features in Glioblastoma.       radiotherapy, chemotherapy, and targeted therapy, its prognosis remains notably poor with an
              Front. Oncol. 11:632934.        extremely low 5-year survival rate of approximately 5% (1–3). In addition, GBM patients and
      doi: 10.3389/fonc.2021.632934           families suffer a heavy burden due to progressive neurological deficits and decreasing quality of life

Frontiers in Oncology | www.frontiersin.org                                         1                                     February 2021 | Volume 11 | Article 632934
Pan et al.                                                                                               m6A Modification Pattern in Glioblastoma

(4). Despite the killing effect of systemic therapy after complete       ALKBH5 catalyze the demethylation process. The remaining
resection, infiltrating cancer cells can often escape, resulting in       regulators, such as YTHDF1/2/3, are a group of RNA-binding
tumor recurrence, progression, and even death (5). Recent                proteins identifying specific m6A methylation regions to regulate
advances in precision oncology, immunology, and other                    downstream translation processes (19, 20). Although previous
disciplines have uncovered multiple experimental therapies,              studies suggested YTHDF family have the role of enhancing
such as immunotherapy, gene therapy, and novel drug-delivery             translation, mRNA degradation, simultaneously accelerating
technologies, which are emerging as powerful tools to solve the          translation and mRNA degradation respectively through
complicated GBM treatment difficulties, including low                     binding different m6A-modified region (21–26), a novel model
permeability of the blood-brain barrier, complex tumor                   of YTHDF proteins shows that they bind the same mRNA and
signaling pathways, and the absence of specific biomarkers (6).           co-mediate mRNA degradation and cellular differentiation (27).
Since multimodality therapy heralds promise in achieving                 A growing number of studies suggested that m6A regulators
durable and broad anticancer responses, it is urgent to                  participate in multiple biological processes during tumor
establish a reliable tumor classification and prognosis model             progression, thus elucidating the relationship between m6A
for cancer treatment strategy planning.                                  regulators and tumor microenvironment infiltrating immune
    Represented by immune checkpoint inhibitors (ICIs),                  cells can assess GBM patients’ anticancer response to
Chimeric Antigen Receptor T-Cell immunotherapy (CAR-T),                  immunotherapy (28–30).
cancer vaccines, and oncolytic viruses, immunotherapy produces               Traditional bulk sequencing provides genetic information at
sustained killing of cancer cells by activating the patients’ own        the resolution of individual samples, thus there is a limitation
immune system. Since these immunotherapies reportedly                    whereby it cannot identify specific cells in the given tissue.
produce durable effects on several cancers, these methods have           Hence, single-cell RNA sequencing (scRNA-seq) emerged as a
also been applied to primary intracranial malignancies, including        practical tool to thoroughly distinguish each cell cluster,
newly diagnosed and recurrent glioblastoma (7, 8). The existence         including immune cells in normal and tumor tissue (31). Due
of the blood-brain barrier (BBB) and tumor microenvironment              to the expensive sequencing costs, scRNA-seq cannot easily
(TME) prevents the immune system’s continuous and effective              translate into clinical setting, and is primarily used for
response on intraparenchymal lesions, which limits the                   laboratory research only. In order to efficiently estimate
application on CNS tumors, resulting in only a specific                   immune cell infiltration level, we applied a relative quantitative
subgroup of glioma patients benefitting from this treatment (9,           algorithm based on single-sample gene-set analysis (ssGSEA),
10). Recent studies regarding the tumor microenvironment have            which can utilize traditional bulk expression profile data to
challenged the traditional cognition that tumor tissue is                determine the relative abundance of 23 immune cells in tumor
composed of pure tumor cells (11). It holds that the core                tissue (32, 33). Additionally, by analyzing the correlation among
tumor cells are surrounded by a complex microenvironment,                expression patterns of 21 m6A methylation regulators, we
which consists of multiple components, such as newborn blood             established the m6A methylation-based prognostic assessment
vessels, multiple cell factors, extracellular matrix (ECM),              pipeline (MPAP) to calculate GBM patients’ m6A modification
fibroblasts, and immune cells. Immune cells infiltrating the               score (MMS). According to the MMS, we can further predict the
TME were confirmed to be predictive to patients’ clinical                 clinical outcomes of GBM patients. Using the MPAP, we can
outcomes and have a critical role on the immune response                 determine m6A modification patterns in disease tissue by using
affecting the efficacy of immunotherapy, indicating that                  only conventional bulk transcriptome data, which provides novel
identifying the infiltrating pattern of immune cells in TME is            perspectives of GBM in an efficient and inexpensive way.
of great significance to estimate the prognosis of GBM patients
and assess the value of various therapies (12, 13).
    Recently, it was reported that the epigenetic modification of         MATERIALS AND METHODS
RNA has a potential specific dependence with
microenvironment infiltrating immune cells, suggesting that               Patient Selection and Data Preprocessing
elucidating the epigenetic characteristics of GBM can provide a          From Gliovis (gliovis.bioinfo.cnio.es), a published data
comprehensive basis for immunotherapy (14). Among over 150               visualization web tool for brain tumor expression profile data
RNA modifications, N6-methyladenosine (m 6 A) RNA                         uploaded on Gene-Expression Omnibus (GEO) and the Cancer
methylation is the most dominant form of epigenetic                      Genome Atlas (TCGA) (34), six glioblastoma datasets (Donson
regulation, occupying approximately 0.3% of total adenosine              et al, n = 21; Ducray et al, n = 48; Gravendeel et al, n = 163;
residues (15–17). Three types of distinct m 6A regulatory                Kamoun et al, n = 19; Murat et al, n = 84; Rembrandt et al, n =
factors called “writers”, “erasers”, and “readers”, respectively,        209); (tumor = 495; normal = 49) and corresponding clinical data
dynamically regulate the process of RNA translation,                     were obtained for downstream analysis, which was sequenced
degradation, and nuclear export by methyltransferases,                   using Affymetrix expression arrays (HG-U133_Plus_2, HG-
demethylases, and binding proteins, separately (18). In total, 21        U133A, HG_U95Av2, and HuGene-1_0-st). Before acquiring
regulators participate in the m6A RNA methylation process,               the expression data, the data had undergone robust multi-array
among which RBM15, ZC3H13, METTL3, METTL14, WTAP,                        average normalization, followed by quantile normalization using
and KIAA1429 represent the methyltransferases, while FTO and             R package “affy.” The median of genes with multiple probe sets

Frontiers in Oncology | www.frontiersin.org                          2                               February 2021 | Volume 11 | Article 632934
Pan et al.                                                                                                           m6A Modification Pattern in Glioblastoma

was selected as the final expression value. To eliminate the batch                   R package “limma”, which implemented an empirical Bayesian
effect produced not by biological differences but by technical                      algorithm to identify DEGs (39). We considered genes with
biases, we adopted the “Combat” function in the sva package                         adjusted p values < 0.05 as statistically different DEGs and
based on the classical Bayesian algorithm. In addition, somatic                     utilized these for downstream analysis.
datasets for glioblastoma and low-grade glioma were obtained
from TCGA and Copy Number Variation (CNV) data was                                  Collection of Expression Data Matching
downloaded from the UCSC Xena website (https://xena.ucsc.                           Immunotherapy Response Information
edu/).                                                                              In order to investigate potential predictive values of m6A
                                                                                    modifications for immunotherapy response in GBM patients,
M6A Regulators Clustering                                                           we comprehensively searched expression data matching
To further explore the regulation mode of m6A regulators, we                        anticancer responses for PD-L1 treatment. A urothelial
extracted expression profiles of 21 m 6A regulators from                             cancer cohort treated with anti-PD-L1 antibody was finally
integrated GBM microarray datasets. Eight methylases (METTL3/                       included for downstream analysis (40). The entire expression
14, RBM15/15B, WTAP, KIAA1429, CBLL1, ZC3H13), two                                  data and matching PD-L1 response information can be wholly
demethylases (ALKBH5, FTO), and 11 RNA binding                                      obtained from R package IMvigor210CoreBiologies. For
proteins (YTHDC1/2, YTHDF1/2/3, IGF2BP1, HNRNPA2B1,                                 raw expression data in the R package, we adopted the
HNRNPC, FMR1, LRPPRC, ELAVL1) were included for                                     function filterNvoom to normalize and filter out genes with
unsupervised clustering analysis. Thereafter, we utilized the                       low reads.
ConsensusClusterPlus package to run an unsupervised consensus
clustering one thousand times to divide GBM patients into stable
subgroups based on different m6A modification patterns (35). The                     Construction and Validation of MPAP
R package of ConsensusClusterPlus was used to classify patients                     Using DEGs obtained from subgroups with distinct m6A
with qualitatively different m6A modification patterns based on the                  signatures, we aimed to construct a scoring system in order to
expression of 21 m6A regulators, and two distinct modification                       estimate GBM patients’ prognosis. Firstly, R package rbsurv, a
patterns were eventually identified using unsupervised clustering,                   modeling tool to produce numerous Cox models and then select
including 233 cases in pattern A and 262 cases in pattern B. We                     the optimum one, was applied to filter the survival-related genes
termed these patterns as m 6 A cluster A-B, respectively.                           for the purpose of enhancing the robustness using cross-
Additionally, we conducted a principle component analysis                           validation methods. Next, we utilized the least absolute
(PCA) of 21 regulators of GBM expression data to explore                            shrinkage and selection operator (LASSO) regression, an
different m6A modification patterns between tumor and normal                         efficient regression approach for high-dimensional data with
tissue, as well as each GBM cluster based on consensus clustering.                  large correlated covariates (41–43), to establish our m6A
                                                                                    methylation-based immune cell infiltration assessment pipeline
Assessment of Immune Cell Infiltration                                               (MPAP). Combining Robustness and LASSO regression, we
To estimate immune cell infiltration level, we applied single-                       established a MPAP based on 13 genes and its correlation
sample gene-set enrichment analysis (ssGSEA) using traditional                      coefficients. Simultaneously, our MPAP was also validated in
microarray expression data (36). To identify multiple immune                        another GBM cohort. Then, in univariate and multivariate
cells using ssGSEA, a specific gene set, including gene expression                   analysis, m6A modification scores (MMS) obtained from the
features of 23 immune cells, was employed (32, 33). We obtained                     MPAP were proven to be independent prognostic factors in both
an enrichment score for each sample, representing the relative                      training and verification sets (Table 1, Figure 5).
infiltration level of immune cells, using ssGSEA.
                                                                                    Statistical Analysis
Gene Set Variation Analysis (GSVA) and                                              R software (version 3.6.0) was used for all statistical analysis and
GO/KEGG Annotation                                                                  p-values < 0.05 were considered statistically significant.
We downloaded KEGG pathway gene sets, named C2 collection,                          Robustness regression was conducted to select the optimum
from the molecular signature database (MsigDB) (https://www.                        Cox model and LASSO regression was subsequently performed
gsea-msigdb.org/gsea/msigdb) for GSVA inputting.29 Next, we                         to construct a predictive model. Thereafter, we utilized the
performed GSVA using R package “GSVA” on each subgroup to                           Kaplan-Meier (K-M) approach to establish survival curves and
compare relative enrichment level of immune-related KEGG                            log-rank tests to calculate p-values between each group. To find
pathways (37). Furthermore, differentially expressed genes                          the optimum cut-off value of each dataset, we adopted R package
(DEGs) among subgroups of distinct m 6 A modification                                survminer, which examined the efficiency of all potential cut-off
patterns were utilized for GO and KEGG enrichment analysis                          points. Applying receiver operating characteristic (ROC) curves,
b a s ed o n R p a c k a ge “ C l u s t e r P r o fil e r ” , wh i c h u s e s       we estimated the specificity and sensitivity of the predictive
hypergeometric distribution tests to annotate DEGs (38).                            model, which was implemented using R package pROC.
                                                                                    Correlation coefficients among 21 m 6 A regulators were
Differential Expression Analysis                                                    calculated using the Spearman correlation analysis and
We performed a differential expression analysis among                               transformed by -log10. In the training set and validation set,
subgroups with different m6A modification patterns based on                          we used multivariate analysis and calculated the hazard ratio

Frontiers in Oncology | www.frontiersin.org                                     3                                February 2021 | Volume 11 | Article 632934
Pan et al.                                                                                                                     m6A Modification Pattern in Glioblastoma

TABLE 1 | Univariate cox proportional hazards analysis of clinical parameters and m6A risk score level of glioblastoma (GBM) patients in the training set and
validation set.

Variables                                                                         Training set                                              Validation set

                                                                              Univariate analysis                                         Univariate analysis

                                                                      HR(95%CI)                      P-value                     HR(95%CI)                      P-value

Age group                            Younger vs old                0.41(0.286-0.61)                  6.7e-06                   1.24(0.87-1.76)                  0.217
CIMP status                          G-CIMP vs NON                 1.63(0.96- 2.78)                    0.068                           /                           /
Gender                               Male vs Female                1.04(0.78- 1.40)                    0.764                   0.91(0.63-1.32)                   0.642
Subtype                             NE+PE vs CL+ME                 1.15(0.80- 1.64)                    0.437                           /                           /
m6Arisk group                          Low vs High                 0.48(0.34- 0.70)                  8.67e-05                  0.53 (0.32-0.86)                 0.0103
Radiotherapy                            Yes vs No                          /                             /                     0.51(0.26-1.02)                   0.05
Chemotherapy                            Yes vs No                          /                             /                     0.59(0.30-1.18)                  0.139
IDH status                          Wildtype vs Mutant                     /                             /                     1.45(0.83-2.53)                  0.190
1p19q status                           Non vs Codel                        /                             /                     1.20(0.48-2.97)                  0.690

Bold values are statistically significant.

(HR) to compare the predictive efficacy between the clinical                            expression level of 21 m6A regulators, GBM samples can be entirely
information and our predictive model.                                                  discriminated against normal tissue using PCA analysis
                                                                                       (Supplemental Figure 1).

RESULTS                                                                                Expression Pattern Based on 21 m6A
                                                                                       Methylation Modification Regulators
Somatic Mutation Frequency Landscape                                                   To explore m6A modification patterns in GBM, we included
of 21 m6A Methylation Regulators                                                       several GEO datasets and matching clinical information for
In our research, a total of 21 m6A RNA methylation regulators was                      integrative analysis. Applying copy number variation (CNV)
determined, including eight methyltransferases (writer), two                           alteration analysis, we observed widespread CNV alteration on
demethylases (eraser), and 11 RNA binding proteins (reader). To                        21 regulators, among which amplification and deletion vary.
illustrate the process by which we constructed the MPAP and what                       CBLL1, HNRNPA2B1, ELAVL1, and YTHDF1 displayed the
datasets were applied in our study, a schematic workflow was                            prevalent CNV amplification, while ZC3H13, HNRNPC,
developed dividing the overall work into four steps broadly (Figure                    METTL3, and WTAP displayed the opposite (Figure 2A). We
1A). In Figure 1B, we summarized the somatic mutation frequency                        further analyzed the transcriptome expression level of 21 m6A
difference of 21 regulators between low-grade glioma (LGG) and                         regulators in GBM patients. Results indicate that regulators with
GBM. In 21 regulators, IGF2BP1, RBM15B, YTHDF2, and FTO                                CNV amplification tend to exhibit higher mRNA expression
were significantly higher in GBM than LGG containing one writer                         levels compared to normal tissue in GBM patients, and vice
(RBM15B), one eraser (FTO), and two readers (YTHDF2,                                   versa, suggesting that the expression levels of m6A regulators are
IGF2BP1). Despite the non-significant statistical difference                            predominantly influenced by CNV alterations (Figure 2B).
between LGG and GBM among the remaining 17 regulators, the                             Nevertheless, the transcriptome expression level of some
somatic mutation frequency in GBM on m6A regulators was                                specific regulators including HNRNPC, KIAA1429, METTL14,
considered to be more than in LGG, due to the larger sample                            METTL3, WTAP, is opposite to its CNV alterations. For
size of LGG (508) than GBM (495), except HNRNPC, FMR1, and                             example, HNRNPC and METTL3 with CNV deletion in GBM
WTAP, which demonstrated that the somatic mutation frequency                           tissue have a relatively higher transcriptome expression level
of GBM patients among m6A regulators tended to be higher than                          than that in tumor tissue. These opposite trends could be
that of LGG patients. This data implies that higher somatic                            attributed to transcriptional events mediated by
mutation frequency of m6A regulators may contribute to the                             transcriptional factors and epigenetic changes like histone
malignant degree of gliomas. The somatic mutation frequency of                         modifications, DNA methylations, which need to be further
21 m6A regulators was depicted in GBM samples. Totally, in 495                         elucidated in GBM progression. Adopting R package
GBM samples, 41 obtained alterations accounting for 10.43%.                            ConsensusClusterPlus, we divided 495 GBM patients into two
IGF2BP1 displayed the highest mutation rate, while WTAP and                            clusters with distinct m6A modification patterns according to
HNRNPC did not display any mutation (Figure 1C). Next, we                              transcriptome expression levels of 21 m 6 A regulators
further demonstrated the co-occurrence of 21 regulators, among                         (Supplemental Figures 2A–C). In addition, the heatmap of 21
which YTHDC1/2 and ZC3H13, YTHDC1/2 and LRPPRC,                                        m6A regulators, classified by the abovementioned two clusters,
YTHDC1/2 and YTHDF3, YTHDC1 and YTHDC2, YTHDF3                                         demonstrates the relationship between expression level and
and ZC3H13, YTHDF3 and LRPPRC, YTHDF2 and FMR1, and                                    matching clinical information, including age, clinical status,
YTHDC2 and METTL14 exhibited significant correlation (Figure                            CIMP, and histology subgroup. Notably, GBM patients in
1D). The composition of 495 GBM samples’ base conversion is                            m6A cluster B are more likely to express CIMP. Regarding the
shown in Figure 1E. Additionally, based on the transcriptome                           histology subgroup GBM patients in m6A cluster A tend to be in

Frontiers in Oncology | www.frontiersin.org                                        4                                       February 2021 | Volume 11 | Article 632934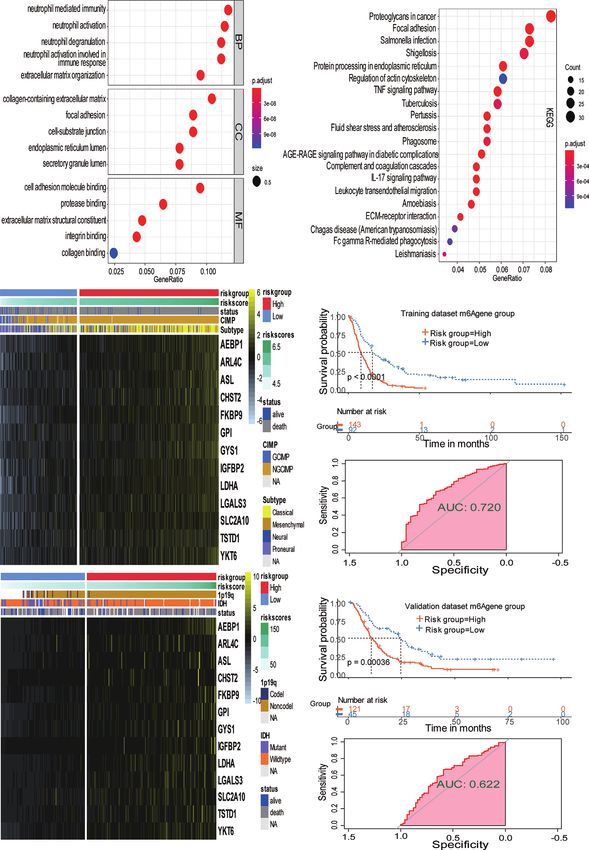
Pan et al.                                                                                                                        m6A Modification Pattern in Glioblastoma

                      A

                      B                                                                  C

                      D                                                                  E

 FIGURE 1 | Somatic mutation frequency landscape of 21 m6A methylation modification regulators in GBM. (A) Schematic workflow for the construction of MPAP.
 (B) Comparison of somatic mutation frequency of 21 m6A regulators between LGG (n=508) and GBM (n=393). The asterisk means the p-value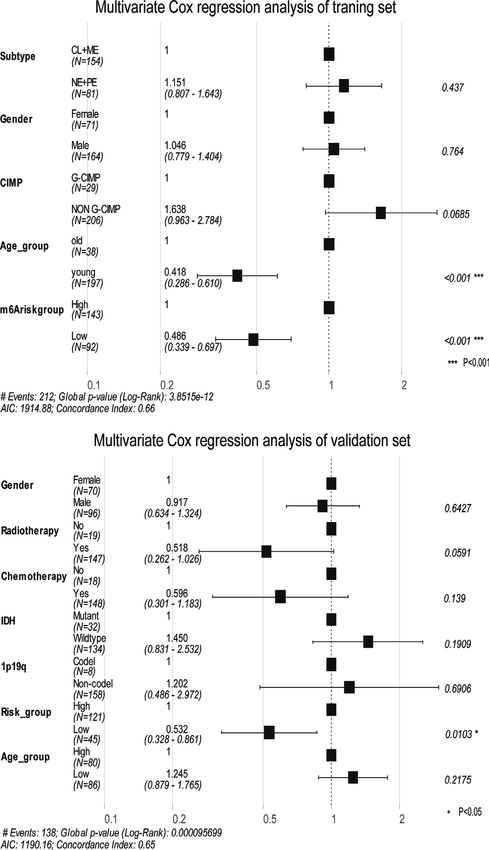
Pan et al.                                                                                                                m6A Modification Pattern in Glioblastoma

                     A                                                             B

                                     C

                                     D

 FIGURE 2 | Expression pattern of 21 m6A modification regulators in GBM. (A) The copy number variation (CNV) percentage of m6A regulators in GBM. The red dot
 represents the CNV amplification and the blue dot represents the CNV deletion. (B) The expression value of each m6Aregulators between tumor and normal sample.
 (C) The heatmap indicating the expression pattern of m6A regulators between 2 m6A modification clusters, which matched the clinical information, including age,
 status, CIMP, and histology subtype. (D) Principal component analysis (PCA) of m6A regulators to differentiate 2 m6A clusters.

among subgroups with higher expression levels of eraser                            a potential interactive effect (Figure 3B). In total, 2 m6A clusters
ALKBH5, most writers express the same trend, including                             with potentially different m6 A modification pattern were
METTL14, RBM15, RBM15B, WTAP, CBLL1, and ZC3H13                                    determined within the 495 GBM patients based on the
(Figure 3A). Simultaneously, regarding samples with higher                         transcriptome expression level of 21 m6A regulators. m6A
expression of FTO (another eraser), we observe a significantly                      cluster A was characterized by the relatively low expression of
higher level of writers, implying that writers and erasers display                 FTO, KIAA1429, ZC3H13, FMR1, LRPPRC, IGF2BP1,

Frontiers in Oncology | www.frontiersin.org                                    6                                     February 2021 | Volume 11 | Article 632934
Pan et al. m6A Modification Pattern in Glioblastoma
A B
C D
E F
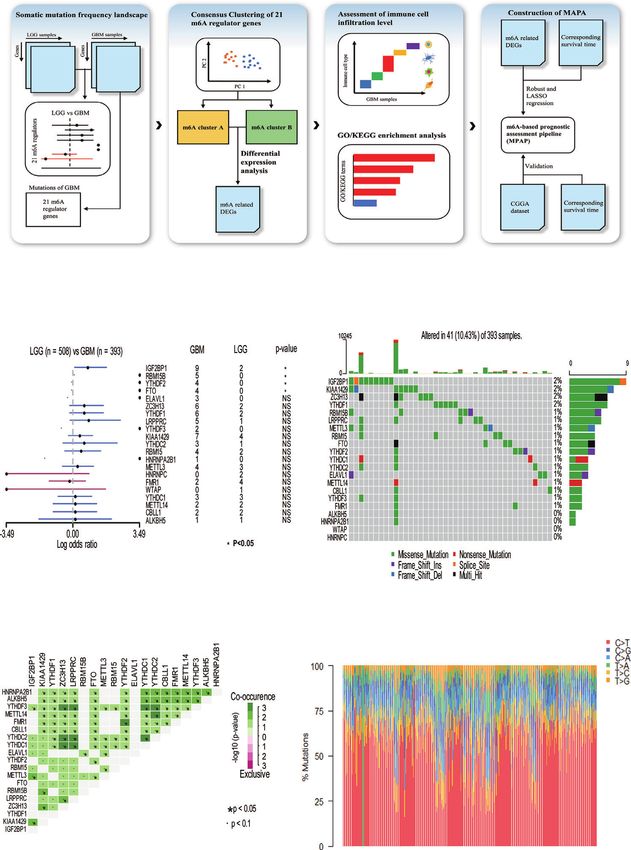
FIGURE 3 | The relationship between m6A modification genes and specific immune cell infiltration. (A) The expression level of eraser ALKBH5 between high and low
expression groups of writers, including METTL3/14, RBM 15/15B, WTAP, KIAA1429, CBLL1, and ZC3H13. (B) The same as A in eraser FTO. (C) Correlation
between 23 immune cells infiltration level and 21 m6A modification regulators. (D) The enrichment level of immune related pathways in KEGG between high and low
expression groups of ELAVL1. (E, F) The response percentage for PD-L1 treatment in high and low expression groups of ELAVL1. SD, stable disease; PD,
progressive disease; CR, complete response; PR, partial response.
YTHDC1 and high expression of the remaining regulators, histology subgroup expressed distinct between 2 m6A clusters,
while m6A cluster B showed an opposite trend. Although no indicating that 2 m6A clusters with different expression pattern
significant difference in the age distribution was identified, other of 21 regulators could have potential mechanisms to mediate
corresponding clinical information including CIMP and these adverse clinical features.
Frontiers in Oncology | www.frontiersin.org 7 February 2021 | Volume 11 | Article 632934Pan et al. m6A Modification Pattern in Glioblastoma
Immune Cell Infiltration Features in LASSO regression was applied for the establishment of the
Different m6A Modification Modules MPAP, during which 13 genes and the correlation coefficients
Spearman correlation of infiltration levels between 23 immune were obtained (Supplemental Figures 4A, B). According to the
cells and 21 m6A regulators demonstrated that expression level expression value of 13 genes and the correlation coefficients, we
of m6Aregulators and TME infiltration closely related to each computed the m6A modification score to divide GBM patients
other. It is suggested that clarifying expression modes of m6A into groups with distinct clinical outcomes (Figure 4D). The
regulators is of great significance for forecasting anticancer overall survival of the high-risk m6A modification group is
immune responses, which could be a powerful tool to indicate significantly shorter than that of the low-risk group with a log-
the efficacy of immunotherapies, such as PD-L1 treatment in ranked p-value < 0.0001. The expression levels of 13 genes
GBM patients (Figure 3C). We also found that the expression (AEBP1, ARL4C, ASL, CHST2, FKBP9, GPI, GYS1, IGFBP2,
level of the regulator ELAVL1 negatively correlated with the LDHA, LGALS3, SLC2A10, TSTD1, YKT6) are depicted in the
infiltration level of most immune cells, except only type 2 T heatmap (Figure 4C).
helper cells and activated CD4+ T cells. Utilizing GSVA to Simultaneously, for the purpose of testing the robustness of
compare immune-related KEGG pathway enrichment degree the MPAP, we utilized another GBM cohort from CGGA for
between subgroups expressing high and low ELAVL1 levels, it prognostic prediction as a validation dataset. Similarly, GBM
was demonstrated that subgroups with high ELAVL1 expression patients in the validation set were divided into two m6A
tend to exhibit relatively low enrichment degrees in immune- modification pattern-based risk groups according to MMS
related pathways and vice versa (Figure 3D). Besides, infiltration obtained using the MPAP. The expression levels of 13 genes
levels of 23 immune cells and the difference in expression of are also depicted in the heatmap (Figure 4F). The Kaplan-Meier
MHC molecules, costimulatory molecules, and adhesion curve depicted by matching clinical outcomes reveals a similar
molecules among subgroups with high and low ELAVL1 show trend: the overall survival of the high-risk m6A modification
the same trend: the expression of ELAVL1 is negatively group is significantly shorter than that of the low-risk group (log-
correlated to the infiltration level of most immune cells and ranked p-value = 0.00036), which confirms the robustness of our
above-mentioned immune-related modules (Supplemental model in a different GBM cohort (Figure 4G).
Figures 3A, B). Furthermore, we depicted ROC curves of the predictive
The results indicate that m6A regulator ELAVL1 is a potential model in the training and validation sets. The MPAP displays
predictive factor of immune response, which could be applied to satisfactory prediction sensitivity and specificity with the area
forecasting the anticancer efficacy of immunotherapy. To under the ROC curve measuring 0.720 and 0.622 in the training
elucidate the relationship between expression level of ELAVL1 and validation sets, respectively (Figures 4E, H). The
and response to immunotherapy, we included a urothelial cancer multivariate Cox regression analysis confirmed that the MPAP
cohort treated with anti-PD-L1 antibody (40). The Kaplan-Meier was an independent prognostic predictor in GBM patients with a
survival curve between two group classified by ELAVL1 log-ranked p-valuePan et al. m6A Modification Pattern in Glioblastoma
A B
C D
E
F G
H
FIGURE 4 | Signature patterns of expression level and biological characteristics of each risk group separated by MPAP. (A, B) Bubble plots showing the GO and
KEGG annotation of DEGs obtained from two m6A modification clusters. (C, D) Heatmaps demonstrating the expression level of 13 m6AA related signatures and
the matched clinical information in the training dataset and validation dataset. (E, F) Kaplan-Meier survival curves of risk groups separated by MPAP in the training
dataset and validation dataset. (G, H) ROC curves of the MPAP in the training set and validation set.
Frontiers in Oncology | www.frontiersin.org 9 February 2021 | Volume 11 | Article 632934Pan et al. m6A Modification Pattern in Glioblastoma
A
B
FIGURE 5 | The multivariate Cox regression analysis depicts log-ranked p-values of each factor to predict the prognosis in the training dataset and validation
dataset. (A) The forest plot shows the results of multivariate Cox regression analysis in the training dataset, in which the black squares represent the Hazard Ratio
(HR) and the whiskers around the squares represent the 95% confidence interval. The figures on the left side are the HR of each predictor while on the right side are
the p-value. (B) The same as A in the validation dataset. AIC, Akaike information criterion.
establish a risk stratification method and classify GBM patients costs of sequencing and is thus only used for laboratory research.
into various risk groups with diverse anticancer responses to Recently, many studies have suggested that m6A methylation
various therapies. Although the classical approach for identifying modification influences multiple processes during cancer
specific targets and assessing prognosis has made remarkable progression, such as inflammation and specific cellular signaling
achievements, such as immunohistochemistry (IHC) and pathways (45). Therefore, applying next generation sequencing
traditional histopathology, we require more comprehensive and (NGS) to explore m6A methylation modification patterns in GBM
thorough tools to adapt the changing treatment strategies. Despite will contribute to the classification of GBM patients for precision
its powerful efficiency in detecting potential therapeutic targets medicine and individualized treatment.
and eliminating interference of intra-tumoral heterogeneity, Recently, mRNA m6A methylation modification was reported
scRNA-seq cannot be applied to clinical settings due to the high to have significant role in multiple immune-related biological
Frontiers in Oncology | www.frontiersin.org 10 February 2021 | Volume 11 | Article 632934Pan et al. m6A Modification Pattern in Glioblastoma
A
B
C D
FIGURE 6 | Construction of quantitative prediction nomogram based on methylation-based prognostic assessment pipeline (MPAP). (A) The network diagram
shows the interaction between 21 m6A regulators and 13 m6A related signatures. (B) A nomogram to quantitatively predict survival based on m6A modification score
(MMS), clinical, and molecular parameters. (C) Calibration curves of the nomogram demonstrates the accuracy of the predicted survival. (D) Receiver operating
characteristic (ROC) curves to estimate the performance of the predictive nomogram.
process including innate and adaptive immune response, multiple immune cell infiltration has not been conducted in
immune cell homeostasis, immune recognition as well as anti- GBM. Since substantial evidence demonstrated that some
tumor immunity (14, 46–48). Although various evidence mutational signature can be utilized to predict a poor T cell
suggested single m6A regulator is related to individual type of infiltration, low survival rate and multiple systematic therapy
immune cell and specific aspect of immunity (48), integrated resistance in gliomas especially for PD-1 blockade (49),
analysis of 21 m6A regulators to determine its relationship with comprehensive recognition of epigenetic modification mediated
Frontiers in Oncology | www.frontiersin.org 11 February 2021 | Volume 11 | Article 632934Pan et al. m6A Modification Pattern in Glioblastoma
immune cell infiltration feature in intracranial malignancies can Additionally, although recent study had explored the
provide novel insights into risk stratification and clinical connection between tumor mutational burden and
therapeutic strategy. Hence, we identified 2 diverse m6A immunotherapy response in gliomas (49), the influence of
methylation modification patterns in GBM patients with specific gene for the efficacy of immunotherapy in GBM has
distinct tumor microenvironment immune cell infiltration not been elucidated due to the small sample capacity in the
utilizing 21 m 6 A modification regulators. However, the research on the effect of immunotherapy for GBM. Instead, we
concrete mechanism regarding how regulators influence applied a urothelial cancer cohort treated by PD-L1 blockade to
immune cell infiltration and proceed to regulator immune explore the connection between transcriptome expression
responses requires further clarification. In addition, it is pattern and immunotherapy response and ELAVL1 was
important to elucidate the interaction and mechanism among determined to be a predictor for the efficacy of PD-L1
m6A regulators and to find hub regulators that could be adopted blockade. But that urothelial cancer cohort is different from
for GBM treatment. Our research provides practical ideas for the GBM in some respects, for example, tumor samples in that
above-mentioned challenges. However, further research is cohort are metastases. And urothelial cancer is thought to be in a
required to understand how m 6 A modification affects totally different immune subtype from GBM (58), which will
immune response. affect the prediction value of ELAVL1 on immunotherapy. To
Increasing evidence suggested that m6A modification play an clarify these confusions, we further explore the correlation
extensive role in antitumoral drug resistance through various between the expression level of 21 m6A regulators and
mechanisms including drug transport and metabolism, immune cells infiltration level in that urothelial cancer cohort
mutational drug targets, cellular damage repair etc (50). It was (Supplemental Figure 5). It was demonstrated that the
also reported that targeting some specific m6A regulators can correlation between ELAVL1 and 23 immune cells infiltration
substantially surmount drug resistance in several cancers (51–53). level in the urothelial cancer has a similar trend with that in GBM
Notably, previous study demonstrated that methylation cohort (Supplemental Figure 5, Figure 3C), which support our
modification of MGMT promoter can lead to increased conclusion to a certain extent. However, due to the heterogeneity
chemotherapeutic effect in high grade gliomas (54, 55). between urothelial cancer and GBM the prediction value of
Therefore, identifying epigenetic modification related targets ELAVL1 and its potential mechanism for immunotherapy still
will contribute to enhancing anticancer effect of systematic needs to be further proved by large glioma cohort treated by PD-
treatment in GBM especially of immunotherapy. And 1/L1 blockade.
integration of multiple therapy and choosing the optimum To summarize, comprehensively studying the m 6 A
treatment strategy on the basis of advanced risk stratification methylation modification patterns in GBM patients, two
model may be the future direction for treating intracranial diverse m6A phenotypes with distinct epigenetic modification
malignancies. It was also confirmed that DEGs obtained from modes were identified to explore m6A modification-related
differential expression analysis between two clusters with different signatures. Using a quantitative method to assess the
m6A methylation modification modes were closely related to infiltration level of 23 immune cells in transcriptome
epigenetic and immune response-related KEGG pathways and expression data, we integrated these m6A regulated signature
GO terms, for example, neutrophil-mediated immunity and genes for further analysis to determine the relationship between
neutrophil activation involved in immune responses. We immune responses and m6A modifications, which we could
considered these m6 A modification related DEGs as key apply to estimate anticancer responses to immunotherapies in
signature genes in GBM, which could be utilized to detect clinical practice. According to our results, m6A modification
potential characteristics within intra-tumoral heterogeneity of regulator ELAVL1 was identified to potentially play a role in the
GBM, including immune cell infiltration. Thus, using these efficient prediction of PD-L1 treatment, while the effect of other
m6A modification-related signature genes, the MPAP was m6A regulators on specific treatment strategies were to be
constructed to quantitatively assess m6A patterns in GBM. determined. Considering the urgent demand for the
Hence the MPAP could be used as a novel tool to relatively construction of a risk stratification and prognosis assessment
assess GBM patients’ prognosis and guide clinical decision- system in GBM patients to cautiously formulate treatment
making. As the means of GBM therapy diversifies, formulating management, we established the MPAP using the m6A-related
treatment strategy based on prognostic models to guide precision signature genes to assess the m6A modification level, by which
medicine will be a trend in the fields of cancer treatment (56, 57). immune cell infiltration level can be identified and then be used
However, our study has a few limitations: retrospective to predict the clinical outcomes for patients receiving
research displays statistical bias and the traditional bulk immunotherapy treatment. Furthermore, integrating other
sequence transcriptome data lack comprehensive exploration clinical information, including CIMP and age, we constructed
for the intra-tumoral heterogeneity. Admittedly, there is urgent a nomogram to precisely forecast GBM patients’ survival time, in
demand for a prospective study to acquire a superior fit. Yet, we which the MMS obtained from MPAP was the leading predictor.
have established a superior predictive model to quantitatively In short, our findings provided a comprehensive understanding
assess GBM patients’ clinical outcomes based on m 6 A of m6A modifications in GBM and provided a powerful, high
modifications through multiple transcriptome data, at a quality tool at a low cost to quantitatively estimate GBM patients’
relatively low price that could be widely used. therapeutic response and clinical prognosis.
Frontiers in Oncology | www.frontiersin.org 12 February 2021 | Volume 11 | Article 632934Pan et al. m6A Modification Pattern in Glioblastoma
CONCLUSIONS FUNDING
In conclusion, by detecting distinct expression patterns of 21 This work was supported by the National Natural Science
m6A modification regulators in GBM, this study successfully Foundation of China (grant number 81802974)
identified 13 m6A-related signatures and constructed the MPAP
combining the Robust and LASSO regression, which we could
employ to quantitively predict the prognosis of GBM patients. ACKNOWLEDGMENTS
Additionally, we also determined that m6A regulators are
correlated with specific immune cell infiltration levels. All contributors to this study are included in the list of authors.
Comprehensively exploring m6A modification patterns in
GBM will enhance our understanding of immune infiltration
features in order to better manage the treatment strategies and SUPPLEMENTARY MATERIAL
improve clinical outcomes.
The Supplementary Material for this article can be found online
at: https://www.frontiersin.org/articles/10.3389/fonc.2021.
632934/full#supplementary-material
DATA AVAILABILITY STATEMENT
Supplementary Figure 1 | Principle component analysis (PCA) of m6A
Publicly available datasets were analyzed in this study. These data modification genes to differentiate normal and tumor tissue.
can be found here: https://xena.ucsc.edu https://gliovis.bioinfo.
cnio.es. Supplementary Figure 2 | Consensus clustering of GBM patients’ m6A
modification regulators. (A) Consensus matrices of the GBM cohort for k (number of
clusters) = 2 dividing GBM patients into two clusters. (B) Empirical cumulative
distribution function (CDF) plot display consensus distributions for each k, which
suggests dividing the patients into 2 groups reach the maximum stability. (C) The
ETHICS STATEMENT relative change area under CDF curve (y-axis) indicates the relative increase in
cluster stability, which means the optimal k=2.
Written informed consent was obtained from the individual(s)
for the publication of any potentially identifiable images or data Supplementary Figure 3 | (A) infiltration level of 23 immune cells between
included in this article. groups with high and low ELAVL1. (B) Expression level of MHC molecules, co-
stimulatory molecules, and adhesion molecule between groups with high and low
ELAVL1. (C) Kaplan-Meier survival curves of groups with high and low ELAVL1
expression level.
AUTHOR CONTRIBUTIONS
Supplementary Figure 4 | (A) LASSO coefficient profiles of the m6A related
YP and KX wrote the manuscript and drew the figures. YL and signatures. (B) Using 10-fold cross-validation to the optimal penalty parameter
lambda.
YZL collected the data. QL wrote the manuscript and supervised
the entire project. All authors contributed to the article and Supplementary Figure 5 | Correlation between 23 immune cells infiltration level
approved the submitted version. and 21 m6A modification regulators.
8. Lang FF, Conrad C, Gomez-Manzano C, Yung WKA, Sawaya R, Weinberg
REFERENCES JS, et al. Phase I Study of DNX-2401 (Delta-24-RGD) Oncolytic
1. Ostrom QT, Gittleman H, Truitt G, Boscia A, Kruchko C, Barnholtz-Sloan JS. Adenovirus: Replication and Immunotherapeutic Effects in Recurrent
CBTRUS Statistical Report: Primary Brain and Other Central Nervous System Malignant Glioma. J Clin Oncol (2018) 36(14):1419–27. doi: 10.1200/
Tumors Diagnosed in the United States in 2011-2015. Neuro Oncol (2018) 20 jco.2017.75.8219
(suppl_4):iv1–iv86. doi: 10.1093/neuonc/noy131 9. De Felice F, Pranno N, Marampon F, Musio D, Salducci M, Polimeni A, et al.
2. Ostrom QT, Cote DJ, Ascha M, Kruchko C, Barnholtz-Sloan JS. Adult Glioma Immune check-point in glioblastoma multiforme. Crit Rev Oncol Hematol
Incidence and Survival by Race or Ethnicity in the United States From 2000 to (2019) 138:60–9. doi: 10.1016/j.critrevonc.2019.03.019
2014. JAMA Oncol (2018) 4(9):1254–62. doi: 10.1001/jamaoncol.2018.1789 10. Tomaszewski W, Sanchez-Perez L, Gajewski TF, Sampson JH.
3. Ostrom QT, Gittleman H, Farah P, Ondracek A, Chen Y, Wolinsky Y, et al. Brain Tumor Microenvironment and Host State: Implications for
CBTRUS statistical report: Primary brain and central nervous system tumors Immunotherapy. Clin Cancer Res (2019) 25(14):4202–10. doi: 10.1158/
diagnosed in the United States in 2006-2010. Neuro Oncol (2013) 15 Suppl 2 1078-0432.Ccr-18-1627
(Suppl 2):ii1–56. doi: 10.1093/neuonc/not151 11. Binnewies M, Roberts EW, Kersten K, Chan V, Fearon DF, Merad M, et al.
4. Taphoorn MJ, Sizoo EM, Bottomley A. Review on quality of life issues in Understanding the tumor immune microenvironment (TIME) for
patients with primary brain tumors. Oncologist (2010) 15(6):618–26. effective therapy. Nat Med (2018) 24(5):541–50. doi: 10.1038/s41591-
doi: 10.1634/theoncologist.2009-0291 018-0014-x
5. Pinel S, Thomas N, Boura C, Barberi-Heyob M. Approaches to physical 12. Ali HR, Chlon L, Pharoah PD, Markowetz F, Caldas C. Patterns of Immune
stimulation of metallic nanoparticles for glioblastoma treatment. Adv Drug Infiltration in Breast Cancer and Their Clinical Implications: A Gene-
Deliv Rev (2019) 138:344–57. doi: 10.1016/j.addr.2018.10.013 Expression-Based Retrospective Study. PLoS Med (2016) 13(12):e1002194.
6. Lapointe S, Perry A, Butowski NA. Primary brain tumours in adults. Lancet doi: 10.1371/journal.pmed.1002194
(2018) 392(10145):432–46. doi: 10.1016/s0140-6736(18)30990-5 13. Quail DF, Joyce JA. Microenvironmental regulation of tumor progression and
7. Huang J, Liu F, Liu Z, Tang H, Wu H, Gong Q, et al. Immune Checkpoint in metastasis. Nat Med (2013) 19(11):1423–37. doi: 10.1038/nm.3394
Glioblastoma: Promising and Challenging. Front Pharmacol (2017) 8:242. 14. Han D, Liu J, Chen C, Dong L, Liu Y, Chang R, et al. Anti-tumour
doi: 10.3389/fphar.2017.00242 immunity controlled through mRNA m(6)A methylation and YTHDF1 in
Frontiers in Oncology | www.frontiersin.org 13 February 2021 | Volume 11 | Article 632934Pan et al. m6A Modification Pattern in Glioblastoma
dendritic cells. Nature (2019) 566(7743):270–4. doi: 10.1038/s41586-019- 37. Hänzelmann S, Castelo R, Guinney J. GSVA: gene set variation analysis for
0916-x microarray and RNA-seq data. BMC Bioinf (2013) 14:7. doi: 10.1186/1471-
15. Alarcó n CR, Lee H, Goodarzi H, Halberg N, Tavazoie SF. N6- 2105-14-7
methyladenosine marks primary microRNAs for processing. Nature (2015) 38. Yu G, Wang LG, Han Y, He QY. clusterProfiler: an R package for comparing
519(7544):482–5. doi: 10.1038/nature14281 biological themes among gene clusters. Omics (2012) 16(5):284–7.
16. Patil DP, Chen CK, Pickering BF, Chow A, Jackson C, Guttman M, et al. m(6) doi: 10.1089/omi.2011.0118
A RNA methylation promotes XIST-mediated transcriptional repression. 39. Ritchie ME, Phipson B, Wu D, Hu Y, Law CW, Shi W, et al. limma powers
Nature (2016) 537(7620):369–73. doi: 10.1038/nature19342 differential expression analyses for RNA-sequencing and microarray studies.
17. Zhao BS, Roundtree IA, He C. Post-transcriptional gene regulation by mRNA Nucleic Acids Res (2015) 43(7):e47. doi: 10.1093/nar/gkv007
modifications. Nat Rev Mol Cell Biol (2017) 18(1):31–42. doi: 10.1038/ 40. Mariathasan S, Turley SJ, Nickles D, Castiglioni A, Yuen K, Wang Y, et al.
nrm.2016.132 TGFb attenuates tumour response to PD-L1 blockade by contributing to
18. Yang Y, Hsu PJ, Chen YS, Yang YG. Dynamic transcriptomic m(6)A exclusion of T cells. Nature (2018) 554(7693):544–8. doi: 10.1038/
decoration: writers, erasers, readers and functions in RNA metabolism. Cell nature25501
Res (2018) 28(6):616–24. doi: 10.1038/s41422-018-0040-8 41. Peng D, Wang L, Li H, Cai C, Tan Y, Xu B, et al. An immune infiltration
19. Chen XY, Zhang J, Zhu JS. The role of m(6)A RNA methylation in human signature to predict the overall survival of patients with colon cancer. IUBMB
cancer. Mol Cancer (2019) 18(1):103. doi: 10.1186/s12943-019-1033-z Life (2019) 71(11):1760–70. doi: 10.1002/iub.2124
20. Tong J, Flavell RA, Li HB. RNA m(6)A modification and its function in 42. Tian MX, Liu WR, Wang H, Zhou YF, Jin L, Jiang XF, et al. Tissue-infiltrating
diseases. Front Med (2018) 12(4):481–9. doi: 10.1007/s11684-018-0654-8 lymphocytes signature predicts survival in patients with early/intermediate
21. Wang X, Lu Z, Gomez A, Hon GC, Yue Y, Han D, et al. N6-methyladenosine- stage hepatocellular carcinoma. BMC Med (2019) 17(1):106. doi: 10.1186/
dependent regulation of messenger RNA stability. Nature (2014) 505 s12916-019-1341-6
(7481):117–20. doi: 10.1038/nature12730 43. Zhu GQ, Zhou YJ, Qiu LX, Wang B, Yang Y, Liao WT, et al. Prognostic
22. Wang X, Zhao BS, Roundtree IA, Lu Z, Han D, Ma H, et al. N(6)- alternative mRNA splicing signature in hepatocellular carcinoma: a study
methyladenosine Modulates Messenger RNA Translation Efficiency. Cell based on large-scale sequencing data. Carcinogenesis (2019) 40:1077–85.
(2015) 161(6):1388–99. doi: 10.1016/j.cell.2015.05.014 doi: 10.1093/carcin/bgz073
23. Du H, Zhao Y, He J, Zhang Y, Xi H, Liu M, et al. YTHDF2 destabilizes m(6)A- 44. Zhao HF, Wang J, Shao W, Wu CP, Chen ZP, To ST, et al. Recent advances in
containing RNA through direct recruitment of the CCR4-NOT deadenylase the use of PI3K inhibitors for glioblastoma multiforme: current preclinical and
complex. Nat Commun (2016) 7:12626. doi: 10.1038/ncomms12626 clinical development. Mol Cancer (2017) 16(1):100. doi: 10.1186/s12943-017-
24. Li A, Chen YS, Ping XL, Yang X, Xiao W, Yang Y, et al. Cytoplasmic m(6)A 0670-3
reader YTHDF3 promotes mRNA translation. Cell Res (2017) 27(3):444–7. 45. Zhang B, Wu Q, Li B, Wang D, Wang L, Zhou YL. m(6)A regulator-mediated
doi: 10.1038/cr.2017.10 methylation modification patterns and tumor microenvironment infiltration
25. Shi H, Wang X, Lu Z, Zhao BS, Ma H, Hsu PJ, et al. YTHDF3 facilitates characterization in gastric cancer. Mol Cancer (2020) 19(1):53. doi: 10.1186/
translation and decay of N(6)-methyladenosine-modified RNA. Cell Res s12943-020-01170-0
(2017) 27(3):315–28. doi: 10.1038/cr.2017.15 46. Li HB, Tong J, Zhu S, Batista PJ, Duffy EE, Zhao J, et al. m(6)A mRNA
26. Seo KW, Kleiner RE. YTHDF2 Recognition of N(1)-Methyladenosine (m(1) methylation controls T cell homeostasis by targeting the IL-7/STAT5/SOCS
A)-Modified RNA Is Associated with Transcript Destabilization. ACS Chem pathways. Nature (2017) 548(7667):338–42. doi: 10.1038/nature23450
Biol (2020) 15(1):132–9. doi: 10.1021/acschembio.9b00655 47. Winkler R, Gillis E, Lasman L, Safra M, Geula S, Soyris C, et al. m(6)A
27. Zaccara S. Jaffrey SR. A Unified Model for the Function of YTHDF Proteins in modification controls the innate immune response to infection by targeting
Regulating m(6)A-Modified mRNA. Cell (2020) 181(7):1582–95.e18. type I interferons. Nat Immunol (2019) 20(2):173–82. doi: 10.1038/s41590-
doi: 10.1016/j.cell.2020.05.012 018-0275-z
28. Fu Y, Dominissini D, Rechavi G, He C. Gene expression regulation mediated 48. Shulman Z, Stern-Ginossar N. The RNA modification N(6)-methyladenosine
through reversible m6A RNA methylation. Nat Rev Genet (2014) 15(5):293– as a novel regulator of the immune system. Nat Immunol (2020) 21(5):501–12.
306. doi: 10.1038/nrg3724 doi: 10.1038/s41590-020-0650-4
29. Pinello N, Sun S, Wong JJ. Aberrant expression of enzymes regulating m(6)A 49. Touat M, Li YY, Boynton AN, Spurr LF, Iorgulescu JB, Bohrson CL, et al.
mRNA methylation: implication in cancer. Cancer Biol Med (2018) 15 Mechanisms and therapeutic implications of hypermutation in gliomas.
(4):323–34. doi: 10.20892/j.issn.2095-3941.2018.0365 Nature (2020) 580(7804):517–23. doi: 10.1038/s41586-020-2209-9
30. Tong J, Cao G, Zhang T, Sefik E, Amezcua Vesely MC, Broughton JP, et al. m 50. Li B, Jiang J, Assaraf YG, Xiao H, Chen ZS, Huang C. Surmounting cancer
(6)A mRNA methylation sustains Treg suppressive functions. Cell Res (2018) drug resistance: New insights from the perspective of N(6)-methyladenosine
28(2):253–6. doi: 10.1038/cr.2018.7 RNA modification. Drug Resist Update (2020) 53:100720. doi: 10.1016/
31. Tanay A, Regev A. Scaling single-cell genomics from phenomenology to j.drup.2020.100720
mechanism. Nature (2017) 541(7637):331–8. doi: 10.1038/nature21350 51. Yan F, Al-Kali A, Zhang Z, Liu J, Pang J, Zhao N, et al. A dynamic N(6)-
32. Barbie DA, Tamayo P, Boehm JS, Kim SY, Moody SE, Dunn IF, et al. methyladenosine methylome regulates intrinsic and acquired resistance to
Systematic RNA interference reveals that oncogenic KRAS-driven cancers tyrosine kinase inhibitors. Cell Res (2018) 28(11):1062–76. doi: 10.1038/
require TBK1. Nature (2009) 462(7269):108–12. doi: 10.1038/nature08460 s41422-018-0097-4
33. Charoentong P, Finotello F, Angelova M, Mayer C, Efremova M, Rieder D, 52. Huang H, Weng H, Chen J. m(6)A Modification in Coding and Non-coding
et al. Pan-cancer Immunogenomic Analyses Reveal Genotype- RNAs: Roles and Therapeutic Implications in Cancer. Cancer Cell (2020) 37
Immunophenotype Relationships and Predictors of Response to Checkpoint (3):270–88. doi: 10.1016/j.ccell.2020.02.004
Blockade. Cell Rep (2017) 18(1):248–62. doi: 10.1016/j.celrep.2016.12.019 53. Meng Q, Wang S, Zhou S, Liu H, Ma X, Zhou X, et al. Dissecting the m(6)A
34. Bowman RL, Wang Q, Carro A, Verhaak RG, Squatrito M. GlioVis data portal methylation affection on afatinib resistance in non-small cell lung cancer.
for visualization and analysis of brain tumor expression datasets. Neuro Oncol Pharmacogenomics J (2020) 20(2):227–34. doi: 10.1038/s41397-019-
(2017) 19(1):139–41. doi: 10.1093/neuonc/now247 0110-4
35. Wilkerson MD, Hayes DN. ConsensusClusterPlus: a class discovery tool with 54. Hegi ME, Diserens AC, Gorlia T, Hamou MF, de Tribolet N, Weller M,
confidence assessments and item tracking. Bioinformatics (2010) 26 et al. MGMT gene silencing and benefit from temozolomide in
(12):1572–3. doi: 10.1093/bioinformatics/btq170 glioblastoma. N Engl J Med (2005) 352(10):997–1003. doi: 10.1056/
36. Subramanian A, Tamayo P, Mootha VK, Mukherjee S, Ebert BL, Gillette MA, NEJMoa043331
et al. Gene set enrichment analysis: a knowledge-based approach for 55. Berdasco M, Esteller M. Clinical epigenetics: seizing opportunities for
interpreting genome-wide expression profiles. Proc Natl Acad Sci U S A translation. Nat Rev Genet (2019) 20(2):109–27. doi: 10.1038/s41576-018-
(2005) 102(43):15545–50. doi: 10.1073/pnas.0506580102 0074-2
Frontiers in Oncology | www.frontiersin.org 14 February 2021 | Volume 11 | Article 632934Pan et al. m6A Modification Pattern in Glioblastoma
56. Kennedy BC, Showers CR, Anderson DE, Anderson L, Canoll P, Bruce JN, Conflict of Interest: The authors declare that the research was conducted in the
et al. Tumor-associated macrophages in glioma: friend or foe? J Oncol (2013) absence of any commercial or financial relationships that could be construed as a
2013:486912. doi: 10.1155/2013/486912 potential conflict of interest.
57. Vidyarthi A, Agnihotri T, Khan N, Singh S, Tewari MK, Radotra BD, et al.
Predominance of M2 macrophages in gliomas leads to the suppression of local Copyright © 2021 Pan, Xiao, Li, Li and Liu. This is an open-access article distributed
and systemic immunity. Cancer Immunol Immunother (2019) 68(12):1995– under the terms of the Creative Commons Attribution License (CC BY). The use,
2004. doi: 10.1007/s00262-019-02423-8 distribution or reproduction in other forums is permitted, provided the original author(s)
58. Thorsson V, Gibbs DL, Brown SD, Wolf D, Bortone DS, Ou Yang TH, et al. and the copyright owner(s) are credited and that the original publication in this journal is
The Immune Landscape of Cancer. Immunity (2018) 48(4):812–30.e14. cited, in accordance with accepted academic practice. No use, distribution or
doi: 10.1016/j.immuni.2018.03.023 reproduction is permitted which does not comply with these terms.
Frontiers in Oncology | www.frontiersin.org 15 February 2021 | Volume 11 | Article 632934You can also read