RNA promotes phase separation of glycolysis enzymes into yeast G bodies in hypoxia - eLife
←
→
Page content transcription
If your browser does not render page correctly, please read the page content below
RESEARCH ARTICLE

                                    RNA promotes phase separation of
                                    glycolysis enzymes into yeast G bodies in
                                    hypoxia
                                    Gregory G Fuller1, Ting Han2, Mallory A Freeberg1†, James J Moresco3‡,
                                    Amirhossein Ghanbari Niaki4, Nathan P Roach1, John R Yates III3, Sua Myong4,
                                    John K Kim1*
                                    1
                                     Department of Biology, Johns Hopkins University, Baltimore, United States;
                                    2
                                     National Institute of Biological Sciences, Beijing, China; 3Department of Chemical
                                    Physiology, The Scripps Research Institute, La Jolla, United States; 4Department of
                                    Biophysics, Johns Hopkins University, Baltimore, United States

                                    Abstract In hypoxic stress conditions, glycolysis enzymes assemble into singular cytoplasmic
                                    granules called glycolytic (G) bodies. G body formation in yeast correlates with increased glucose
                                    consumption and cell survival. However, the physical properties and organizing principles that
                                    define G body formation are unclear. We demonstrate that glycolysis enzymes are non-canonical
                                    RNA binding proteins, sharing many common mRNA substrates that are also integral constituents
                                    of G bodies. Targeting nonspecific endoribonucleases to G bodies reveals that RNA nucleates G
                                    body formation and maintains its structural integrity. Consistent with a phase separation
*For correspondence:
jnkim@jhu.edu                       mechanism of biogenesis, recruitment of glycolysis enzymes to G bodies relies on multivalent
                                    homotypic and heterotypic interactions. Furthermore, G bodies fuse in vivo and are largely
Present address: †EMBL-EBI,         insensitive to 1,6-hexanediol, consistent with a hydrogel-like composition. Taken together, our
Wellcome Genome Campus,
                                    results elucidate the biophysical nature of G bodies and demonstrate that RNA nucleates phase
Hinxton, United Kingdom;
‡                                   separation of the glycolysis machinery in response to hypoxic stress.
  Center for the Genetics of Host
Defense, UT Southwestern
Medical Center, Dallas, United
States
                                    Introduction
Competing interests: The
                                    Cells perform many diverse activities that are spatially and temporally organized into non-mem-
authors declare that no
                                    brane-bound compartments that often form transiently and can display solid, gel, or liquid-like prop-
competing interests exist.
                                    erties. Liquid-like structures formed through phase separation of protein polymers display fast
Funding: See page 26                internal rearrangements, undergo fusion and fission, and exchange components with the surround-
Received: 15 May 2019               ing solvent (Alberti et al., 2019; Hyman et al., 2014).
Accepted: 31 March 2020                Recently, we and others demonstrated that glycolysis enzymes coalesce into membraneless cyto-
Published: 16 April 2020            plasmic granules called glycolytic bodies (G bodies) in hypoxic stress in yeast, C. elegans, and mam-
                                    malian cells (Jang et al., 2016; Jin et al., 2017; Miura et al., 2013). In yeast, the presence of G
Reviewing editor: David Ron,
University of Cambridge, United
                                    bodies correlates with accelerated glucose consumption, and impairing G body formation leads to
Kingdom                             the accumulation of upstream glycolytic metabolites (Jin et al., 2017). These data suggest that dur-
                                    ing hypoxic stress, when oxidative phosphorylation is inhibited, G bodies form to enhance the rate
   Copyright Fuller et al. This
                                    of glycolysis by concentrating glycolysis enzymes. In C. elegans, hypoxia rapidly induces the forma-
article is distributed under the
                                    tion of foci containing glycolysis enzymes near presynaptic release sites in neurons (Jang et al.,
terms of the Creative Commons
Attribution License, which          2016). A phosphofructokinase mutant incapable of punctate localization disrupts synaptic vesicle
permits unrestricted use and        clustering in neurons, suggesting that coalescence of glycolysis enzymes promotes synaptic function
redistribution provided that the    (Jang et al., 2016). However, the mechanism of G body formation remains poorly understood.
original author and source are         G bodies have a number of features common to known phase-separated bodies. In addition to
credited.                           being non-membrane bound, some G body components, including phosphofructokinase 2 (Pfk2),

Fuller et al. eLife 2020;9:e48480. DOI: https://doi.org/10.7554/eLife.48480                                                       1 of 30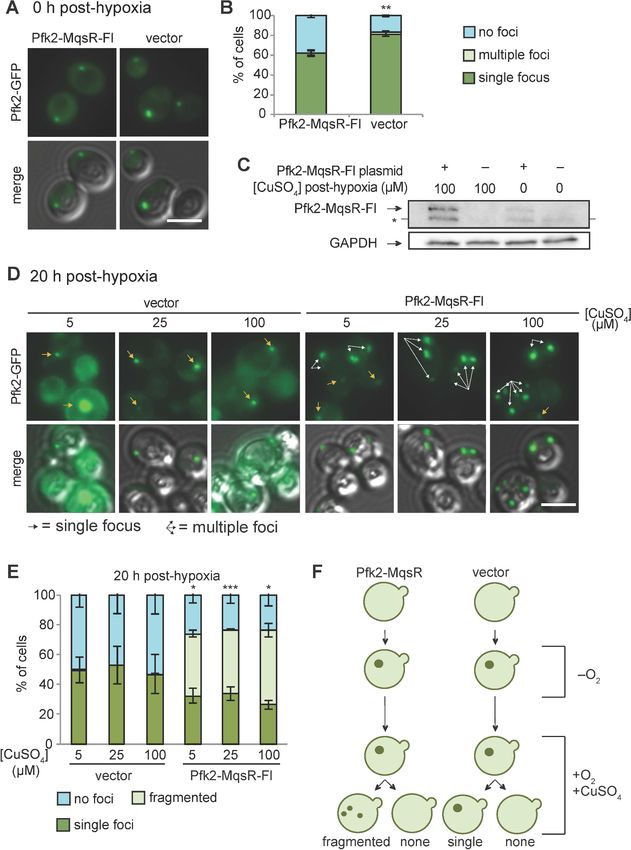
Research article Cell Biology
contain intrinsically disordered regions (IDRs), a feature of proteins that undergo phase transitions
(Jin et al., 2017). The IDR is required for Pfk2 localization to G bodies (Jin et al., 2017). In addition,
G body formation in mammalian cells is inhibited by addition of RNase to the culture media, sug-
gesting that RNA is required for G body integrity (Jin et al., 2017).
Many other phase-separated structures contain RNA. For instance, stress granules contain
mRNAs stalled in translation initiation (Buchan et al., 2008) and involve protein-protein and IDR
interactions between mRNA binding proteins (Panas et al., 2016; Protter et al., 2018). Nucleoli,
which are sites of ribosomal RNA processing, also form by phase separation (Brangwynne et al.,
2011; Protter et al., 2018). For some proteins, RNAs can promote phase separation in vitro
(Elbaum-Garfinkle et al., 2015; Zhang et al., 2015) or even phase separate by themselves
(Jain and Vale, 2017; Van Treeck et al., 2018). Furthermore, RNase treatment can disrupt mature
granules such as P bodies, demonstrating the importance of RNAs in the structural integrity of RNP
granules (Teixeira et al., 2005). The identity of bound RNAs can be important for phase separation.
For example, the yeast Whi3 protein phase separates in the presence of its substrate RNA, CLN3,
but not in the presence of total RNA (Zhang et al., 2015). Additionally, RNAs that phase separate
alone from yeast total RNA in vitro are enriched in stress granules, suggesting that RNA may drive
phase separation of stress granule proteins in vivo (Van Treeck et al., 2018).
In contrast, other RNA binding proteins display the opposite behavior. For Pab1, a core stress
granule component, high concentrations of RNA prevent phase separation in vitro (Riback et al.,
2017). Microinjection of RNase A can induce aggregation of nuclear FUS protein in vivo, suggesting
that, in this case, high levels of RNA oppose phase separation. RNA binding-defective mutants of
TDP-43 display an increased propensity to phase separate in vitro and in vivo and addition of TDP-
43 RNA substrates allows TDP-43 to remain soluble (Maharana et al., 2018; Mann et al., 2019).
Taken together, reconciling these disparate behaviors in which some RNAs promote formation of
stress granules and P bodies, while others antagonize phase separation of proteins such as TDP-43
and FUS will require targeted in vivo approaches to determine how mature granules are affected by
RNA. In granules for which RNA facilitates RNP granule formation, RNA may function by forming a
scaffold to promote multivalent interactions (Fay and Anderson, 2018; Jain and Vale, 2017;
Langdon and Gladfelter, 2018). Interestingly, metabolic enzymes, including some involved in gly-
colysis, bind mRNAs (Beckmann et al., 2015; Matia-González et al., 2015). However, the physio-
logical roles of this RNA binding remain poorly understood.
In this study, we show that G bodies are novel RNP granules formed through a phase separation
mechanism in vivo. We identify the common mRNA substrates of the G body resident glycolysis
machinery and demonstrate the essential role that RNA plays in G body biogenesis and maintenance
in vivo. Thus, our data suggest a model where, in response to hypoxic stress, when cellular demand
for energy must be met solely through glycolysis, G bodies form through multivalent protein-protein
and protein-RNA interactions to enhance the rate of glycolysis.
Results
Analysis of the RNA-binding proteome uncovers core G body
constituents
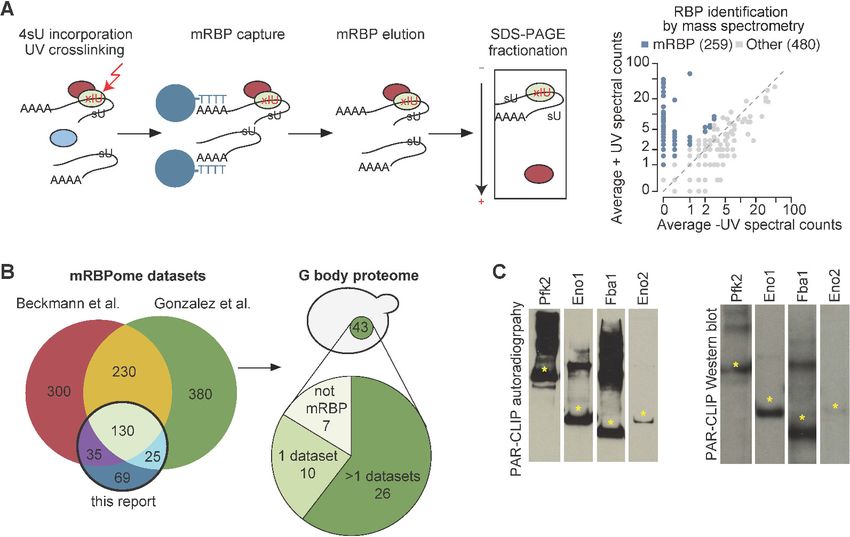
To identify the RNA binding proteome in S. cerevisae, we incorporated 4-thiouridine (4SU) into RNA
in log phase yeast cells grown under normoxic conditions and combined photoactivatable-ribonucle-
oside-enhanced cross-linking (PAR-CL) with oligo(dT) affinity purification and tandem mass spec-
trometry (PAR-CL-MS, Figure 1A) as previously described (Baltz et al., 2012; Castello et al., 2012).
Stringent washes and separation by SDS-PAGE removed non-crosslinked proteins. We identified 259
mRNA-binding proteins (mRBPs) as defined by having >2 counts in +UV mass spec and 0 counts in –
UV mass spec or an FDR < 10% (see Materials and methods). Nearly half of these mRBPs were non-
canonical RBPs that do not contain conventional RNA binding domains. Many of these have been
identified as mRBPs in yeast and other organisms (Beckmann et al., 2015; Matia-González et al.,
2015), thus validating our approach (Figure 1B). In addition, our study identified 69 novel mRBPs in
yeast (Figure 1B, Supplementary file 1). Consistent with previous studies, we identified 10 glycoly-
sis enzymes as mRBPs and other studies identified five additional glycolysis enzymes
Fuller et al. eLife 2020;9:e48480. DOI: https://doi.org/10.7554/eLife.48480 2 of 30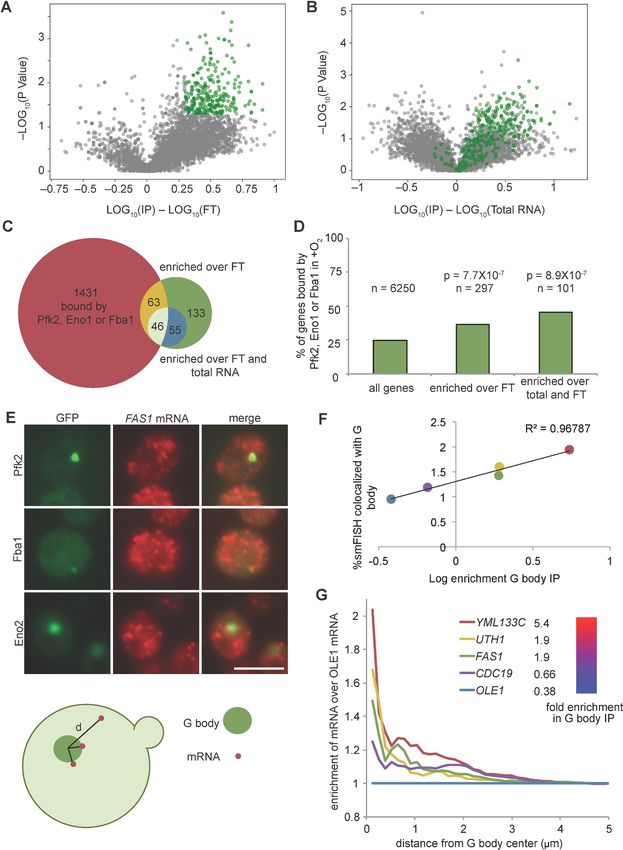
Research article                                                                                                              Cell Biology

Figure 1. G bodies are enriched for RNA-binding proteins. (A) Photoactivatable-ribonucleoside-enhanced cross-linking with oligo(dT) affinity
purification and tandem mass spectrometry (PAR-CL-MS) pipeline. Briefly, 4-thiouridine (4SU) is incorporated by supplementation in media and
crosslinked to protein with 365 nm UV light. mRBPs are captured with oligo-d(T) beads and eluted. RNPs are fractionated by SDS-PAGE and resulting
proteins are analyzed by proteomic mass spectrometry. Average mass spectrometry spectral peak counts from biological replicate PAR-CL-MS versus
non-UV-treated control. Proteins enriched in PAR-CL-MS (blue dots) had either (1)>2 spectral counts in PAR-CL and 0 spectral counts in -UV control or
(2) had FDR < 10% as calculated by QSPEC (Choi et al., 2008). (B) Overlap of identified mRBPs with datasets generated with similar methodology.
mRBP datasets are from Matia-González et al. (2015) and Beckmann et al., 2015. Distribution of G body proteome (union of colocalization validated
G-body proteins from Jin et al., 2017 and Miura et al., 2013. (C) Autoradiography and western blot of PAR-CLIP of TAP-tagged proteins (Pfk2, Eno1,
Eno2, and Fba1). Stars indicate the same band in autoradiography and western blot confirming RNA binding by each indicated protein.
The online version of this article includes the following source data and figure supplement(s) for figure 1:
Figure supplement 1. Identification of glycolysis enzyme binding sites.
Figure supplement 1—source data 1. Source data for Figure 1—figure supplement 1E.

                                    (Beckmann et al., 2015; Matia-González et al., 2015). Of the RNA binding glycolysis enzymes, 10
                                    localize to G bodies in hypoxia (Figure 1—figure supplement 1A), (Jin et al., 2017).

                                    Glycolysis enzymes bind similar transcripts
                                    To validate RNA binding by glycolysis enzymes, we end-labeled potential RNAs crosslinked to TAP-
                                    tagged Pfk2, Eno1, Eno2, and Fba1 (Figure 1C, left panels) with g 32-P ATP. The autoradiographs
                                    displayed the same migration pattern in SDS-PAGE as the immunoblots of the corresponding TAP-
                                    tagged glycolysis enzymes (Figure 1C, right panels), suggesting that the glycolysis enzymes Pfk2,
                                    Eno1, Eno2, and Fba1 bind RNA. We then identified the mRNA substrates of Pfk2, Eno1, and Fba1
                                    by performing photoactivatable, ribonucleoside-enhanced cross-linking and immunoprecipitation
                                    (PAR-CLIP) followed by deep sequencing (PAR-CLIP-seq; Hafner et al., 2010) in log phase yeast
                                    cells grown under normoxic conditions. To determine the binding site sequences, we empirically
                                    determined ‘high-confidence’ RPM (reads per million mapped reads) thresholds (Pfk2: 5 RPM, Fba1:
                                    0.5 RPM, Eno1: 0.5 RPM) for each library (Figure 1—figure supplement 1B). We identified 1540
                                    total mRNAs that bind at least one of these three glycolysis enzymes. Specifically, there were 439
                                    direct mRNA substrates of Pfk2 with 559 discrete binding sites, 1,001 mRNA substrates with 1432
                                    binding sites for Eno1, and 721 mRNA substrates with 1014 binding sites for Fba1 (Figure 1—figure
                                    supplement 1B, right panels). The results of Eno1 PAR-CLIP-seq were in agreement with a recent
                                    analysis of Eno1 in normoxic conditions by CRAC (a method that UV crosslinks and affinity purifies

Fuller et al. eLife 2020;9:e48480. DOI: https://doi.org/10.7554/eLife.48480                                                                   3 of 30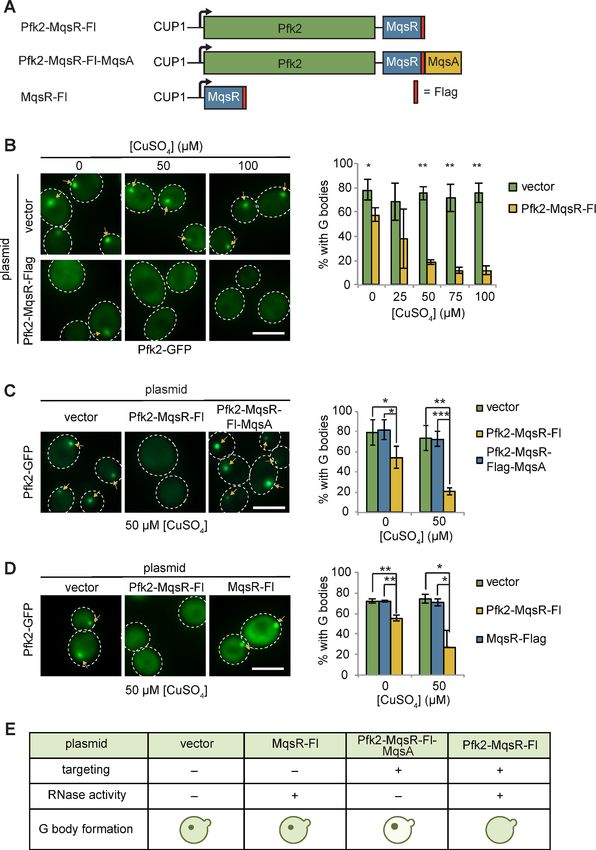
Research article                                                                                                    Cell Biology

                                    protein-RNA complexes under denaturing conditions Shchepachev et al., 2019), providing addi-
                                    tional validation of our identified binding sites. We identified 69 out of the top 100 bound mRNAs in
                                    the CRAC dataset. mRNAs bound by each glycolysis enzyme displayed substantial overlap, with 490
                                    mRNAs binding at least two of the three glycolysis enzymes and 131 mRNAs binding all three
                                    (Figure 2A). Intriguingly, bound mRNAs of all three enzymes were enriched for functional annota-
                                    tions related to glycolysis as well as other metabolic pathways (Figure 2B). For example, Pfk2 targets
                                    included mRNAs encoding 13 of the 22 known glycolytic enzymes (Figure 1—figure supplement
                                    1C). Fba1 and Eno1 also bound to mRNAs encoding glycolysis enzymes, and together, Pfk2, Fba1,
                                    and Eno1 bound to 16 of the 22 glycolytic enzyme-encoding mRNAs in yeast (Figure 1—figure sup-
                                    plement 1C).
                                       With the exception of Fba1-bound mRNAs, which are primarily in non-coding RNAs and coding
                                    sequences, most of the glycolytic enzyme binding sites on substrate mRNAs were within the 3’
                                    untranslated regions (3’ UTRs) and coding sequences, followed by non-coding RNAs and 5’ UTRs
                                    (Figure 2C). We used the high-confidence binding sites for each glycolysis enzyme to identify
                                    enriched motifs. Pfk2 binding sites contained an AU-rich element, similar to elements that regulate
                                    mRNA stability in yeast (Vasudevan and Peltz, 2001), whereas Eno1 and Fba1 binding sites con-
                                    tained pyrimidine-rich motifs (Figure 2D). Furthermore, the binding sites for each enzyme displayed
                                    overlap between enzymes. Although binding footprints were short (22 nt on average), between 10–
                                    17% of binding sites were bound by at least two of the three glycolysis enzymes (Fba1, Eno1, or
                                    Pfk2), and 13–19% of the sites for one enzyme partially overlapped with the binding sites of at least
                                    one other glycolysis enzyme with the remainder of binding sites being uniquely bound by either
                                    Pfk2, Eno1 or Fba1 (Figure 2E). These partially overlapping sites and identical shared sites had
                                    greater average sequencing depth than unique sites bound by only one glycolysis enzyme
                                    (Figure 2F). Unique binding sites, however, had a greater log enrichment of binding site RPM to
                                    gene RPKM (reads per kilobase of transcript per million mapped reads) than overlapping sites and
                                    identical sites in multiple datasets, suggesting that these sites were more tightly bound (Figure 2F).
                                    Thus, the greater binding frequency on overlapping sites was largely driven by the amount of target
                                    mRNA. Nevertheless, the overlap in bound transcripts and binding sites suggests that common RNA
                                    binding could contribute to the coalescence of glycolysis enzymes into G bodies.

                                    G bodies copurify with and contain RNAs
                                    We previously developed a method using differential centrifugation and affinity capture to isolate G
                                    bodies and identify their resident proteins by mass spectrometry, followed by validation using coloc-
                                    alization to G bodies (Jin et al., 2017). Of the 43 identified G body components, 36 are mRBPs
                                    (Jin et al., 2017; Miura et al., 2013; Figure 1B, Supplementary file 1). Glycolysis enzymes are dif-
                                    fusely localized in the cytosol of yeast cells and bind RNA under normoxic growth conditions (Fig-
                                    ure 2). The observation that many of the proteins targeted to G bodies upon shift to hypoxic
                                    conditions bind RNA under normoxic growth, including glycolysis enzymes, raised the possibility
                                    that G bodies themselves contain RNA. To test this hypothesis, we adapted our previous G body
                                    purification protocol to perform RNA extraction, cDNA synthesis, and quantitative PCR to evaluate
                                    the presence of co-purifying RNA (Figure 2—figure supplement 1A). In order to reduce back-
                                    ground, we generated a yeast strain with an integrated Pfk2-GFP-1xFlag transgene. This yeast strain
                                    was shifted to hypoxic conditions for 18 hr to induce G body formation. G bodies were then immu-
                                    nopurified from lysates with a monoclonal mouse anti-Flag antibody and eluted with Flag peptide
                                    before proteinase K digestion and RNA extraction (Figure 2—figure supplement 1A,B). As a con-
                                    trol for nonspecific RNA binding, we performed the same protocol with wild type BY4742 cells and
                                    extracted RNA from the flow through for each sample (Figure 2—figure supplement 1A,B). By
                                    comparing the relative amount of RNA from the flow through and the eluate, we determined the
                                    percent of RNA in the eluate compared to the input of the immunoprecipitation. We tested a range
                                    of qPCR probes for RNAs with or without binding sites identified in PAR-CLIP-seq of Eno1, Pfk2 and
                                    Fba1 (Supplementary file 2). While Pfk2-GFP-Flag pulldowns recovered between 2.4% and 7% of
                                    the flow-through RNA, we recovered at most 1.5% of flow-through RNA in control experiments (Fig-
                                    ure 2—figure supplement 1C), indicating a 3.5 to 11.5-fold enrichment of these RNAs in G bodies
                                    versus the BY4742 control. These trends were not different for RNAs with binding sites for glycolysis
                                    enzymes, suggesting that RNA binding by other RBPs in G bodies may contribute to RNA accumula-
                                    tion in G bodies. However, the low recovery rate relative to flow-through RNAs suggests that only a

Fuller et al. eLife 2020;9:e48480. DOI: https://doi.org/10.7554/eLife.48480                                                         4 of 30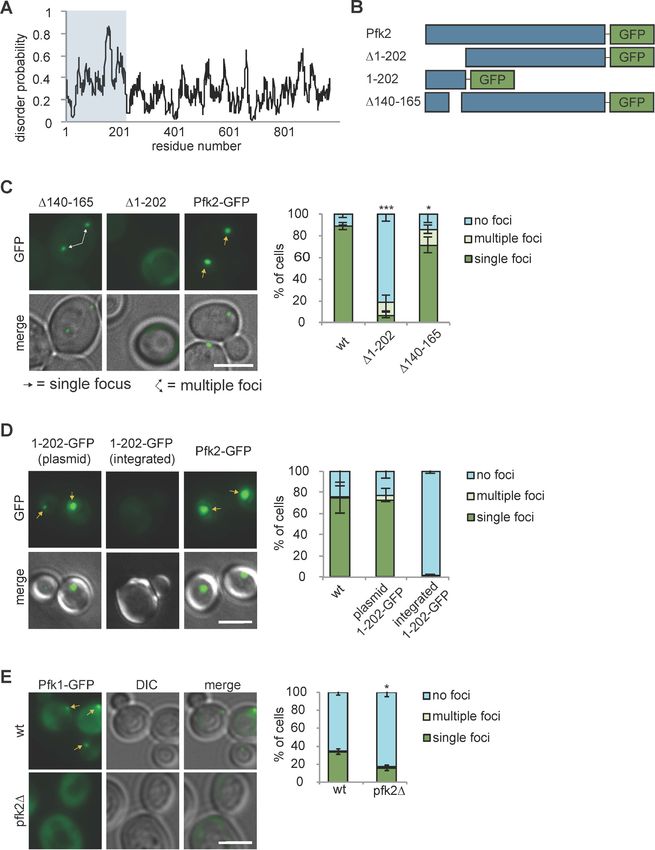
Research article                                                                                                               Cell Biology

Figure 2. Glycolysis enzymes bind similar RNAs. (A) Overlap of mRNAs bound by Pfk2, Eno1, and Fba1 as identified by PAR-CLIP-seq in normoxic
conditions. (B) Gene ontology (GO) terms enriched among transcripts containing high-confidence Pfk2, Eno1 and Fba1 sites include glycolysis. Fisher’s
exact test p-values are plotted. (C) Percent of total Pfk2, Eno1, and Fba1 PAR-CLIP-seq reads per million mapped reads (RPM), aligning with the
indicated genic regions. (D) Identified sequence motifs among Pfk2, Eno1, and Fba1 binding sites. (E) Percent of binding sites for each PAR-CLIP-seq
Figure 2 continued on next page

Fuller et al. eLife 2020;9:e48480. DOI: https://doi.org/10.7554/eLife.48480                                                                    5 of 30
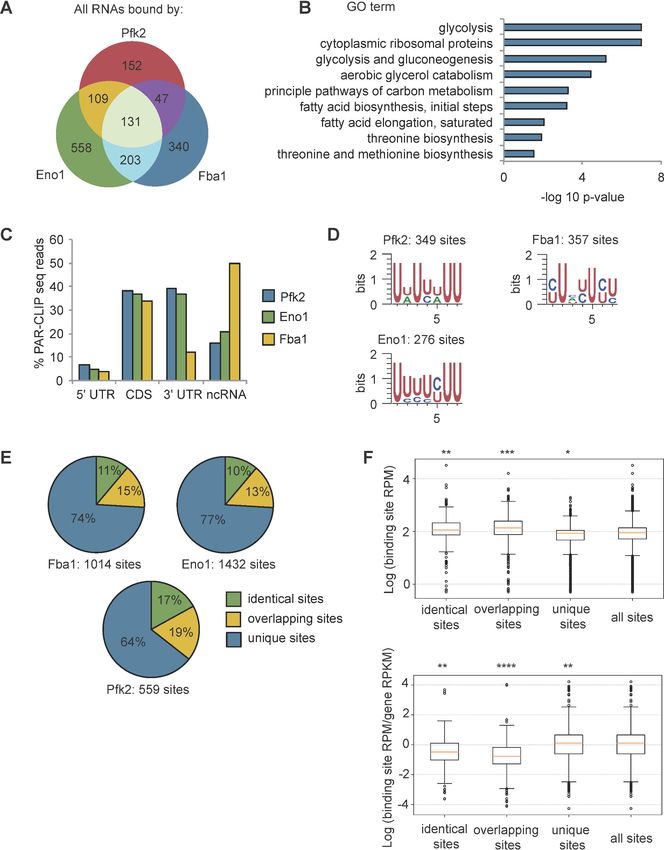
Research article                                                                                                                  Cell Biology

Figure 2 continued
dataset that are bound by more than one glycolysis enzyme (identical sites), overlap a binding site of another glycolysis enzyme (overlapping sites), or
are bound by only one glycolysis enzymes (unique sites) (F) (Top) Binding sites present in multiple datasets or overlapping other binding sites tend to
have greater read depth. Boxplot of log10 (Binding Site RPM) for each class of binding site. p-values represent unpaired student’s T Tests. (Bottom)
Glycolysis enzymes tend to bind tighter to unique sites. Boxplot of log10 ratio of binding site RPM to gene RPKM from mRNA seq. p-values represent
unpaired student’s T tests. *p
Research article                                                                                                            Cell Biology

Figure 3. G body associated RNAs overlap with RNAs bound by glycolysis enzymes in normoxia. (A) Volcano plot of RNAs enriched in G body RIPs
over flow through RNAs. (B) Volcano plot of RNAs comparing G body RIPs and total RNA. (A–B) RNAs highlighted in green represent RNAs > 2 fold
enriched over flow through with p2 fold enriched in RPM in G body RIPs with p
Research article                                                                                                            Cell Biology

Figure 3 continued
biological replicates plotted. (G) Fold change of cumulative distribution of distances from G body center for each mRNA tested over OLE1 mRNA.
n = 3773 CDC19, 3781 FAS1, 3532 UTH1, 3036 YML133C and 5159 OLE1 mRNAs.
The online version of this article includes the following source data and figure supplement(s) for figure 3:
Source data 1. Source data for Figure 3C,D.
Source data 2. Source data for Figure 3F.
Source data 3. Source data for Figure 3G.
Figure supplement 1. Validation of smFISH colocalization with G body markers.
Figure supplement 1—source data 1. Source data for Figure 3—figure supplement 1C.
Figure supplement 1—source data 2. Source data for Figure 3—figure supplement 1D.
Figure supplement 1—source data 3. Source data for Figure 3—figure supplement 1E.

                                    Yamaguchi et al., 2009). We placed Pfk2-MqsR-Flag under the control of the copper sulfate
                                    (CuSO4) inducible CUP1 promoter on a centromeric plasmid, and introduced this plasmid, or a con-
                                    trol vector, into cells expressing the G body reporter Pfk2-GFP (Figure 4A). We detected weak
                                    expression of Pfk2-MqsR-Flag even in the absence of CuSO4, consistent with weak activation of the
                                    CUP1 promoter in hypoxic conditions (Becerra et al., 2002). Cells treated with CuSO4 showed a
                                    dose-dependent increase in Pfk2-MqsR-Flag levels (Figure 4—figure supplement 1A, top panels).
                                    At low concentrations of CuSO4 (5, 10 mM) in hypoxia, the Pfk2-MqsR-Flag fusion protein was tar-
                                    geted to G bodies and colocalized with Pfk2-GFP (Figure 4—figure supplement 1B,C). Using this
                                    same approach, another RNase, RNase A, could also be induced and targeted to G bodies as a
                                    Pfk2-RNase A fusion protein (Figure 4—figure supplement 1D,E).
                                       Targeting Pfk2-MqsR-Flag to G bodies caused a robust reduction in the fraction of hypoxic cells
                                    with G bodies in a dose-dependent manner (Figure 4B). In contrast, G body formation in hypoxic
                                    cells carrying a control vector was unaffected by CuSO4 treatment at all concentrations tested
                                    (Figure 4B). Even without induction, hypoxic cells carrying the Pfk2-MqsR-Flag plasmid showed a
                                    20% decrease in G body formation, consistent with the weak expression of Pfk2-MqsR-Flag under
                                    these conditions. CuSO4-induced expression of Pfk2-RNase A similarly inhibited G body formation
                                    (Figure 4—figure supplement 2A).
                                       The MqsR RNase is inhibited by its antitoxin, MqsA (Kasari et al., 2010; Yamaguchi et al.,
                                    2009). To verify that MqsR nuclease activity was required to inhibit G body formation, we fused the
                                    antitoxin MqsA to the Pfk2-MqsR-Flag construct, generating a Pfk2-MqsR-Flag-MqsA fusion protein.
                                    At both 0 and 50 mM CuSO4, G body formation in hypoxic cells was now unaffected by induction of
                                    Pfk2-MqsR-Flag-MqsA (Figure 4C), indicating that MqsA effectively inhibited the G body-targeted
                                    MqsR RNase from disrupting G body formation. G bodies appeared larger and brighter in Pfk2-
                                    MqsR-Flag-MqsA-expressing cells than in cells expressing a vector control, possibly due to overex-
                                    pression of Pfk2 (Figure 4C). Similarly, a Pfk2-RNase AH12A mutant with decreased RNase activity
                                    was less effective at reducing G body formation than Pfk2-RNase Awild-type, especially at 100 mM
                                    CuSO4 (Figure 4—figure supplement 2B). Pfk2-RNase AH12A possesses residual RNase activity
                                    (Thompson and Raines, 1994), which likely contributes to the modest loss of G body formation.
                                    Thus, inhibition of G body formation by RNase A and MqsR is due to their ribonuclease activity.
                                       To further test whether specific targeting of MqsR-Flag to G bodies by fusion to Pfk2 was
                                    required for inhibiting G body formation, we engineered cells expressing MqsR-Flag alone, which
                                    was inducible by addition of CuSO4 (Figure 4—figure supplement 1A, bottom panels). Unlike Pfk2-
                                    MqsR-Flag expression, MqsR-Flag expression had no effect on G body formation in hypoxic cells
                                    (Figure 4D). In addition, we tested the ability of Pfk2-RNase A to inhibit G body formation of several
                                    other G body markers, including Eno2, Cdc19, and Fba1. In each case, CuSO4 induction of hypoxic
                                    cells expressing Pfk2-RNase A, but not the vector control, led to a decrease in G body formation in
                                    a CuSO4 concentration-dependent manner (Figure 4—figure supplement 3A). Expression of RNase
                                    alone or loss of RNase activity prevents inhibition of G body formation. Taken together, directing a
                                    functional RNase to sites of G body formation leads to loss of G bodies, indicating that RNA is
                                    required for G body formation in vivo (Figure 4E).

Fuller et al. eLife 2020;9:e48480. DOI: https://doi.org/10.7554/eLife.48480                                                                 8 of 30
Research article Cell Biology Figure 4. Tethering Pfk2 to an RNase prevents G-body formation. (A) Schematic of Pfk2-MqsR constructs. All constructs were expressed from a centromeric plasmid under control of the CuSO4-inducible CUP1 promoter. (B) (Left) Representative images of hypoxic Pfk2-GFP localization with increasing concentrations of CuSO4 for cells expressing a vector control or cells expressing Pfk2-MqsR-Flag. (Right) Quantification of G body formation in cells with varying CuSO4 concentrations. (C) (Left) Representative images of hypoxic Pfk2-GFP localization comparing cells with a vector control, Pfk2- Figure 4 continued on next page Fuller et al. eLife 2020;9:e48480. DOI: https://doi.org/10.7554/eLife.48480 9 of 30
Research article                                                                                                                  Cell Biology

Figure 4 continued
MqsR-Fl, or Pfk2-MqsR-Fl-MqsA with 50 mM CuSO4. (Right) Quantification of G body formation for cells with each plasmid with 0 and 50 mM CuSO4. (D)
(Left) Representative images of hypoxic Pfk2-GFP localization at 50 mM CuSO4. (Right) Quantification of G body formation for cells with each plasmid
with 0 and 50 mM CuSO4. (E) Schematic summary of results of G body formation with either a vector plasmid or plasmids expressing either MqsR-Flag,
Pfk2-MqsR-Flag, or Pfk2-MqsR-Flag-MqsA. All scale bars are 5 mM. For each graph, data represent mean and standard deviation of three to four
individual experiments (n > 100 cells per replicate per condition). Arrows indicate G bodies. Statistics were analyzed by unpaired student’s T tests with
a Bonferroni correction for multiple testing. *p
Research article                                                                                                               Cell Biology

Figure 5. Pfk2-MqsR-Fl induction fractures existing G bodies. (A) Cells with a plasmid inducibly expressing Pfk2-MqsR-Flag form G bodies in the
absence of induction by CuSO4. Representative images of hypoxic Pfk2-GFP localization in cells expressing a vector control or Pfk2-MqsR-Fl with 0 mM
CuSO4. (B) Quantification of G body formation of cells in (A). (C) Western blot showing induction of Pfk2-MqsR-Fl where CuSO4 is added after 20 hr in
hypoxia and cells are subsequently cultured for 20 hr in normoxia. Pfk2-MqsR-Fl is probed with a monoclonal anti-Flag antibody. GAPDH serves as a
Figure 5 continued on next page

Fuller et al. eLife 2020;9:e48480. DOI: https://doi.org/10.7554/eLife.48480                                                                   11 of 30
Research article                                                                                                                      Cell Biology

Figure 5 continued
loading control. * indicates a nonspecific band. (D) Representative images of Pfk2-GFP localization in cells expressing a vector control and cells
expressing Pfk2-MqsR-Fl after 20 hr hypoxia followed by induction with varying concentrations of CuSO4 in normoxia for 20 hr. Cells with Pfk2-MqsR-Fl
frequently have multiple large foci. (E) Quantification of cells with a single focus, multiple foci, or no foci for cells in (D). (F) Cartoon showing Pfk2-GFP
localization before hypoxia, immediately after hypoxia, and after induction with CuSO4. All graphs show mean and standard deviation of three
independent experiments (n > 100 cells per condition per replicate). Arrows indicate G bodies. Statistics calculated with unpaired student’s T tests. All
scale bars 5 mm. *p
Research article                                                                                                                   Cell Biology

Figure 6. Protein recruitment to G bodies relies on multivalent interactions. (A) IUPRED prediction of disorder in Pfk2. The first 202 amino acid residues
(i.e., the Pfk2 N-terminus) are largely unstructured. (B) Schematic of Pfk2-GFP variants tested. (C) (Left) The Pfk2 N-terminus is required for G body
localization. Representative images of Pfk2-GFP variant localization in hypoxia. (Right) Quantification of G body localization. (D) (Left) The Pfk2
N-terminus is not sufficient for G body localization. Representative images of Pfk2-GFP variant localization in hypoxia. When integrated (in the absence
Figure 6 continued on next page

Fuller et al. eLife 2020;9:e48480. DOI: https://doi.org/10.7554/eLife.48480                                                                       13 of 30
Research article                                                                                                                    Cell Biology

Figure 6 continued
of full-length Pfk2), GFP fused to the Pfk2 N-terminus does not localize to G bodies. When expressed on a plasmid in a strain expressing full-length
Pfk2, GFP fused to the Pfk2 N-terminus is able to localize to G bodies. (Right) Quantification of G body localization. (E) (Left) Pfk1-GFP recruitment to G
bodies depends on Pfk2. Representative images of hypoxic Pfk1-GFP localization in wild-type and pfk2D cells. (Right) Quantification of Pfk1-GFP
localization in wild-type and pfk2D cells in hypoxia. All scale bars are 5 mm. Arrows represent either G bodies or cells with multiple G bodies. For (C)
and (E): Data represent mean and standard deviation of three replicates (n > 100 cells per condition per replicate). For (D): Data represent mean and
standard deviation of two biological replicates (n > 100 cells per condition per replicate). Statistics are unpaired student’s T tests comparing G body
formation. *p
Research article                                                                                                   Cell Biology

                                    (Arvanitidis and Heinisch, 1994). We treated the cells with a small dose of CuSO4 (5 mM) and per-
                                    formed FRAP. Surprisingly, we detected slightly greater overall percentage of recovery (13% vs.
                                    4.1%) for cells expressing Pfk2D348S-MqsR-Flag, although the weak recovery was more rapid (5.7 min
                                    vs. 10.6 min) (Figure 7—figure supplement 2D). Taken together, when RNA is slightly depleted
                                    from G bodies by targeted RNase treatment, there is a modest enhancement in recovery of Pfk2-
                                    GFP, indicating that Pfk2 is more stably associated with G bodies in the absence of RNase. Thus,
                                    RNA may promote stronger binding of Pfk2-GFP in G bodies.
                                       Consistent with fusion events in G body biogenesis, yeast cells display multiple Pfk2-GFP foci at
                                    early time points in hypoxia but only a single focus at later timepoints (Jin et al., 2017). To test
                                    directly G body fusion in vivo, we mated a and a yeast cells, each expressing Pfk2-GFP, and imaged
                                    the mating cells over time following hypoxic incubation. When cells were cultured in hypoxia for 18
                                    hr and subsequently placed under a coverslip, we could track individual G bodies over several hours
                                    (Figure 7—figure supplement 3A). G bodies moved throughout the cell (Figure 7A,B; Figure 7—
                                    video 1, Figure 7—video 2). When a G body from one mating cell type met a G body from the
                                    other mating cell type, they were able to fuse into a single G body in the mated diploid cell. How-
                                    ever, unlike granules in liquid-like states, G body fusion occurred over longer timescales: from as
                                    short as 2 min to as long as 60 min, with a median of 18 min from initial contact to fusion to form a
                                    single G body (Figure 7A). Although some G bodies stayed oblong in shape when fused, others
                                    became more spherical over tens of minutes, suggesting that they behaved as gels with fusion over
                                    long timescales. In accordance with these results, we also identified some cells that formed G bodies
                                    de novo during imaging. Initially, two distinct foci appeared from a diffuse cytoplasm, but over 60
                                    min, these foci became brighter and fused within 2 min of initial contact (Figure 7B).
                                       To gain a better understanding of the frequency of fusion events, we mated a cells expressing
                                    Pfk2-GFP to a cells expressing Pfk2-Azurite following hypoxic treatment and allowed them to settle
                                    in 24-well plates. Over successive timepoints (3, 5, 7 and 24 hr), we measured the fraction of foci
                                    with each label that were overlapping, adjacent to, or distinct from puncta with the other label
                                    (Figure 7C). These cells would be in a hypoxic environment allowing for some de novo granule for-
                                    mation. We observed a high frequency of overlapping puncta, which increased over time. Overlap-
                                    ping puncta likely arose from fusion, although we cannot rule out that a subset arose from de novo
                                    granule formation in mating cells. The fraction of mating cells with adjacent and unassociated puncta
                                    decreased from 41% after 3 hr mating to only 11% after 24 hr mating, whereas the fraction with
                                    overlapping or fused puncta increased (Figure 7D,E, Figure 7—figure supplement 3B). The pro-
                                    gression from many particles to a single particle is consistent with fusion of granules. Taken
                                    together, these results suggest that G bodies can fuse over minutes and are largely insensitive to
                                    1,6-hexanediol, properties reminiscent of gels.

                                    G body formation improves competitive fitness in yeast in hypoxia
                                    To determine if RNA-mediated G body formation is important for cell survival or proliferation in hyp-
                                    oxia, we used a growth competition assay. By inoculating hypoxic cultures with log phase cells
                                    expressing either Pfk2-MqsR-Flag or a vector control and measuring G body formation, we could
                                    determine the expected fraction of cells with G bodies from a culture inoculated with a 1:1 mix of
                                    each population. An increase in the fraction of cells with G bodies from the 1:1 mix of each popula-
                                    tion relative to the expected fraction would indicate a competitive advantage for the cells from the
                                    vector control group (which form G bodies). Conversely, a decrease would indicate a competitive
                                    advantage for cells expressing the Pfk2-MqsR-Flag plasmid (which do not form G bodies) (Figure 7—
                                    figure supplement 4A). By comparing G body formation in the mixed population to the mean of
                                    each single population alone, we could determine the precise fraction of the total population arising
                                    from each population seeded. Strikingly, after 6 to 7 generations in hypoxia, we observed that vec-
                                    tor control cells made up 65% of the culture when grown with Pfk2-MqsR-Flag expressing cells (Fig-
                                    ure 7—figure supplement 3B). Since each population had been grown to log phase in normoxia,
                                    this difference was solely due to competitive growth in hypoxia. The advantage in vector control
                                    cells was not due to extra Pfk2 catalytic activity as cells expressing Pfk2D348S-MqsR-Flag also had a
                                    disadvantage compared to vector control cells. Furthermore, cells expressing MqsR alone also had a
                                    growth advantage over both Pfk2-MqsR-Flag and Pfk2D348S-MqsR-Flag expressing cells. Cells
                                    expressing Pfk2-MqsR-Flag-MqsA had only a small and not statistically significant increase in com-
                                    petitive fitness (Figure 7—figure supplement 3B). To determine if the competitive advantage

Fuller et al. eLife 2020;9:e48480. DOI: https://doi.org/10.7554/eLife.48480                                                      15 of 30
Research article Cell Biology Figure 7. G bodies fuse in vivo. (A–B) Still images from time-lapse imaging of Pfk2-GFP in mating cells with cartoon. a and a cells each expressing Pfk2- GFP were cultured together in hypoxia for 18 hr, mounted on a slide, and imaged every 2 min for 3–4 hr. (A) G body fusion. Initially, foci are present in opposite ends of mating cells. One G body crosses to the other end and gradually fuses with the other G body. (Right) Quantification of time to fuse for multiple G body fusion events from initial contact to fusion. (B) De novo G body formation. Initially, Pfk2-GFP is diffuse in the highlighted cell. Two Figure 7 continued on next page Fuller et al. eLife 2020;9:e48480. DOI: https://doi.org/10.7554/eLife.48480 16 of 30
Research article                                                                                                                 Cell Biology

Figure 7 continued
small puncta appear and gradually fuse into one larger focus, becoming more intense over time. (C) Mating for quantification of G body fusion. a and a
cells expressing Pfk2-GFP and Pfk2-Azurite, respectively, are grown in hypoxia together and allowed to settle in 24-well plates. Cultures are sampled at
3, 5, 7 and 24 hr and phenotypes are evaluated. (D) Representative images of mating Pfk2-Azurite and Pfk2-GFP cells displaying different colocalization
phenotypes. (E) Quantification of G body fusion at each time point. Foci were classified as single foci in cells that were overlapping, multiple
overlapping foci in cells, adjacent foci in cells, or foci not touching or associated in cells. Data represent mean of three independent experiments
(n > 40 foci per timepoint per replicate). Arrows indicate G bodies. All scale bars are 5 mm. p-values represent largest Chi square test of difference
between subsequent timepoints for a replicate. *p
Research article                                                                                                      Cell Biology

                                    (Figure 7—figure supplement 2). Indeed, formation of G bodies when cells are transitioned to hyp-
                                    oxia involves fusion of smaller granules into larger structures. Early fusion events were insensitive to
                                    1,6-hexanediol due to the presence of single foci even after extended 1,6-hexanediol treatment dur-
                                    ing hypoxia (Figure 7—figure supplement 1). Additionally, even after extended periods in hypoxia,
                                    G bodies fuse in mating cells, demonstrating that ‘mature’ G bodies can still fuse (Figure 7). Fourth,
                                    in contrast to other RNP granules, G bodies are remarkably stable. Like stress granule cores, which
                                    can be isolated and are stable in a lysate, G bodies can be purified intact (Jin et al., 2017). However,
                                    unlike stress granules, which can disperse on the order of tens of minutes following removal of
                                    stress, and nucleoli, which rapidly assemble and disassemble during mitosis (Brangwynne et al.,
                                    2011; Feric et al., 2016; Jain et al., 2016; Tsai et al., 2008; Walters et al., 2015), G bodies can
                                    persist for tens of hours as revealed in our experiments inducing Pfk2-MqsR-Flag following hypoxic
                                    incubation (Figure 5). One possibility is that G bodies initially form from a liquid state and gradually
                                    solidify, becoming more similar to protein aggregates of FUS and IDRs of other proteins over time
                                    (Lin et al., 2015; Mateju et al., 2017; Murakami et al., 2015). However, G bodies, once formed,
                                    can be disrupted by the targeting of an RNase, demonstrating that they are not static. The effect of
                                    Pfk2-MqsR-Flag induced after hypoxic treatment (when G bodies have already formed) was largely
                                    independent of the concentration of CuSO4 added (Figure 5). Thus, a small amount of RNA degra-
                                    dation was sufficient for G body fragmentation. The fragmented foci induced after hypoxic treat-
                                    ment appeared larger than single puncta in vector control cells (Figure 5), suggesting additional
                                    Pfk2-GFP could accumulate in these puncta in the absence of RNA. This is consistent with RNA pri-
                                    marily being required for G body fusion and nucleation. It is unclear whether resident G body pro-
                                    teins ever return to the soluble cytosolic pool when cells are shifted back from hypoxic to normoxic
                                    conditions.
                                        Similar to proteins in other granules, protein recruitment to G bodies relies on multivalent interac-
                                    tions. Both the N- and C-terminal domains of Pfk2 are necessary but not sufficient for G body
                                    recruitment (Figure 6). Pfk1 is recruited to G bodies via an interaction with Pfk2 (Figure 6). Addition-
                                    ally, protein-RNA interactions are required for G body formation (Figure 4). Such multivalent interac-
                                    tions are necessary for phase separation and can drive granule formation (Hyman et al., 2014;
                                    Li et al., 2012).

                                    RNA in phase separation
                                    By targeting destructive RNase fusion proteins to sites of G body formation, like a Trojan Horse, we
                                    show that RNA is required for G body formation in vivo (Figure 4). Degradation of RNA in existing
                                    G bodies led to multiple puncta, suggesting that RNA is required for G body stability or integrity
                                    (Figure 5). Furthermore, FRAP data indicated that Pfk2-GFP in G bodies targeted by a weak induc-
                                    tion of RNase was slightly more dynamic than untreated G bodies, suggesting that RNA contributes
                                    to Pfk2 recruitment to G bodies (Figure 7—figure supplement 2). Our mass spectrometry analysis
                                    of the ‘RBPome’ identified hundreds of mRBPs, including glycolysis enzymes, consistent with and
                                    adding to previous work on RPBome discovery (Figure 1; Matia-González et al., 2015;
                                    Beckmann et al., 2015; Scherrer et al., 2010). By PAR-CLIP-seq, a comprehensive picture of an
                                    extensive glycolysis enzyme-bound transcriptome is emerging (Figure 2; Shchepachev et al., 2019).
                                    Intriguingly, these enzymes bind similar transcripts primarily in the 3’ UTRs and coding regions of
                                    their substrate mRNAs (Figure 2). We identified a common set of transcripts bound by multiple gly-
                                    colysis enzymes in normoxic conditions (Figure 2). We determined, by RIP-qPCR and RIP-seq of puri-
                                    fied G bodies, that many of these mRNA substrates were then recruited along with their protein
                                    binding partners to G bodies in hypoxia (Figure 3). smFISH of G body-associated RNAs revealed the
                                    extent to which RNA colocalization with G bodies correlated with the degree of enrichment (Fig-
                                    ure 3). Surprisingly, no RNA analyzed by smFISH was strongly enriched in G bodies, although some
                                    RNAs partitioned up to 2-fold more in G bodies than others. In contrast, stress granules can concen-
                                    trate up to 95% of particular mRNA species (Khong et al., 2017), although this is within multiple
                                    granules. Therefore, while RNAs are required for G body formation, there may be only modest pref-
                                    erence for which specific RNA species are recruited to G bodies, as long as they bind glycolysis
                                    enzymes.
                                        We propose a model in which RNA serves as a scaffold for G body nucleation and growth. Con-
                                    sistent with this model, addition of RNA promotes the aggregation of the glycolysis enzyme, Cdc19,
                                    in vitro (Saad et al., 2017). Among the commonly bound transcripts were a number of mRNAs

Fuller et al. eLife 2020;9:e48480. DOI: https://doi.org/10.7554/eLife.48480                                                          18 of 30
Research article Cell Biology
encoding the glycolysis enzymes themselves. Weak, dynamic interactions between G body compo-
nents with RNA and with each other would allow for the growth of G bodies. It has been proposed
that RNA interactions with glycolysis enzymes can facilitate post-transcriptional regulation of the
pathway (Matia-González et al., 2015). This mode of regulation could additionally contribute to G
body formation through concentration of nascent proteins due to spatially segregated translation of
glycolysis enzyme mRNAs. Interactions with glycolysis enzyme mRNAs may specifically facilitate mul-
tivalent interactions of glycolysis enzymes with RNA by providing a common set of substrates. Alter-
natively, hypoxia may weaken interactions of glycolysis enzymes with RNAs, allowing for G bodies to
form via protein-protein interactions. Many RNAs are localized peripherally to G bodies (Figure 3).
These RNAs may then allow G bodies to fuse by binding the glycolysis enzymes in other G bodies,
explaining the loss of foci with loss of RNA. Experiments measuring binding affinity of glycolysis
enzymes to mRNA in hypoxia and normoxia will be required to differentiate these possibilities.
Phase separation in the control of metabolic pathways
Although spatial organization of pathways to concentrate constituent enzymes is not novel, phase
separation is emerging as a new mechanism to achieve this type of organization. Even for glycolysis,
pathway compartmentalization is known to occur; glycolysis enzymes are concentrated in mem-
brane-bound compartments called glycosomes in various protozoa, including in Trypanosoma bru-
cei, which can survive in anaerobic conditions (Michels et al., 2006; Opperdoes, 1987). However,
phase separation is mechanistically distinct in that it does not require formation of a membrane or
specific transporters. G bodies represent an addition to the known metabolic pathways organized
by phase separation mechanisms. Three recent studies have demonstrated glycolysis enzyme coales-
cence in hypoxia, which is associated with increased rates of glucose flux (Jang et al., 2016;
Jin et al., 2017; Miura et al., 2013). Thus, G bodies and glycosomes may represent a case of con-
vergent evolution. Similar structures also form in the neurons of C. elegans, where enzyme clustering
in response to hypoxia was associated with proper synaptic function, suggesting that glycolysis
enzymes coalesce to increase glycolysis and meet the local high energy demand during synapses
(Jang et al., 2016). Furthermore, cancer cell lines form small aggregates of glycolysis enzymes even
in the presence of oxygen, suggesting that concentrating glycolysis enzymes is a highly conserved
process (Kohnhorst et al., 2017). Additionally, pyrenoids, which enhance the rate of carbon fixation
in Chlamydomonas by concentrating CO2 in the presence of ribulose 1,5 bisphosphate carboxylase
oxygenase (RuBisCo), were shown to form via phase separation (Freeman Rosenzweig et al., 2017).
Carbon metabolism, then, can be controlled both at the level of fixation and harvesting via phase
separation into distinct compartments. Here, we demonstrate that cells capable of forming G bodies
possess a distinct growth advantage over multiple generations when co-cultured with cells that can-
not form G bodies (Figure 7—figure supplement 3). Thus, RNA induced coalescence of glycolysis
enzymes promotes proliferation in hypoxia, likely by enhancing rates of glycolysis.
The precise mechanism of enhanced glycolysis activity is unclear in G bodies. Recent in vitro
measurements of dextranase activity in artificial liquid-liquid phase separated compartments suggest
that phase separation can enhance reaction rates through decreased substrate inhibition
(Kojima and Takayama, 2018). The G body resident factor phosphofructokinase mediates one of
the irreversible steps in glycolysis. It is also subject to substrate inhibition by ATP and may experi-
ence increased specific activity akin to release from substrate inhibition when dextranase undergoes
liquid-liquid phase separation. However, purinosomes, which are complexes composed of purine
biosynthesis enzymes, are thought to enhance pathway activity through substrate channeling
(An et al., 2008; Zhao et al., 2013). Concentrating enzymes in RNP granules may achieve similar
results or enhance reaction flux rates via concentrating intermediate metabolites. Alternatively, con-
centration of energy producing enzymes with their cognate mRNAs may facilitate enhanced transla-
tion of the glycolysis enzymes, thus promoting pathway activity without increasing specific activity of
the enzymes. Understanding the mechanism and function of metabolic pathway enhancement by
phase separation will require future mechanistic studies.
Fuller et al. eLife 2020;9:e48480. DOI: https://doi.org/10.7554/eLife.48480 19 of 30Research article Cell Biology
Materials and methods
Yeast strains and culturing
Strains used are listed in Supplementary file 3. Deletion mutants and integrated transgenic strains
were generated through transformation of amplified auxotrophic markers at the site of PCR ampli-
fied fragments with at least 40 nt of overlapping sequence to 3’ and 5’ UTR sequences. GFP mutants
were derived from the yeast GFP tagged library (Huh et al., 2003). TAP-tagged mutant strains were
derived from the yeast TAP library (Ghaemmaghami et al., 2003). Plasmids were transformed with
standard lithium acetate transformation (Gietz and Woods, 2002) and selected on SD with appro-
priate amino acid supplements and auxotrophic selection.
Cells were grown as indicated either in YPD (2% peptone, 1% yeast extract, 5% glucose) or SMD
(0.67% yeast nitrogen base, 5% glucose, appropriate amino acid and vitamin supplements). For hyp-
oxic growth of yeast for imaging, cells were reinoculated from stationary phase starter cultures in
0.5–1 ml of the indicated media in 24-well plates at an OD600 of 0.05. Cells were grown for the indi-
cated amounts of time in hypoxia using the AnaeroPack system in 2.5 L boxes (Mitsubishi Gas Chem-
ical). For larger-scale biochemical experiments, cells were grown in 125 ml Erlenmeyer flasks in 10–
25 ml of media in 7 L boxes. For analysis of copper inducible proteins, cells were grown in SMD lack-
ing uracil and supplemented with CuSO4 at varying concentrations.
Glucose starvation and 1,6-hexanediol treatment
For glucose starvation, cells were reinoculated from YPD starter cultures into SMD at an OD600 of
0.15. Cells were grown for 6 hr shaking at 30˚C to log phase and pelleted for 2 min at 500 x g. Cells
were washed and resuspended in SM media lacking glucose with or without 5% 1,6-hexanediol for
30 min at room temperature. Cells were either immediately imaged or had 1,6-hexanediol in PBST
directly added to the media, incubated for 1 hr at room temperature, and then imaged.
For hypoxic treatment with 1,6-hexanediol, cells were grown in YPD and reinoculated in SMD
with 0%, 1%, or 2% 1,6-hexanediol at an OD600 of 0.05 and grown 20 hr in hypoxia and imaged. For
treatment with 1,6-hexanediol after hypoxia, cells were cultured in the same way and had 1,6-hexa-
nediol in PBST directly added to the media, incubated for 1 hr at room temperature, and then
imaged.
Plasmid construction
Plasmids were generated by overlap extension PCR fusing fragments amplified from genomic DNA
to fragments amplified from plasmid sources. Pfk2-Rnase A was generated by fusing the Pfk2-linker
sequence from THY62 to RNase A, omitting the signal peptide from the pET22B RNase A plasmid,
which was a gift from Ronald Raines (Addgene plasmid #58903). Pfk2-MqsR was generated by fusing
the Pfk2-linker sequence from THY62 to MqsR amplified with a 3’ 1X Flag peptide sequence from
the pSLC-241 plasmid, which was a gift from Swaine Chen (Addgene plasmid #73194). Pfk2-MqsR-
MqsA was generated by fusing Pfk2-MqsR-Fl to MqsA and subsequently fusing the Pfk2 3’ UTR.
Cytoplasmic MqsR was generated by amplifying MqsR from pSLC-241. Each construct was subse-
quently fused to the Pfk2 3’ UTR amplified from genomic DNA and subcloned into pCu416CUP1
(ATCC 87729) using Spe1 and Xho1 sites. Pfk2-Rnase AH12A was introduced with site-directed muta-
genesis and verified by sequencing. Pfk2D348S was introduced using site directed mutagenesis and
verified by sequencing.
Yeast immunofluorescence
Yeast immunofluorescence protocol was adapted from Amberg et al. (2005). Briefly, cells were
grown in hypoxia for indicated periods of time to an OD600 of ~2 in 1 ml volumes. Formaldehyde
was added to culture media to 1% for 10 min and then washed away. Cells were resuspended in KM
(50 mM potassium phosphate, 5 mM MgCl2, pH 6.5) with 4% formaldehyde for 1 hr at 30˚C and
washed twice with KM and once with KM with 50% sorbitol (KMS). Cells were resuspended in 50 mL
KMS with 5 U Zymolyase (Zymo E1004) for 20 min at 37˚C. Cells were washed and resuspended in
KMS and adhered to Superfrost Plus (Fisher 12-550-15) slides. For probing Pfk2-RNase A, cells were
dipped in ice-cold methanol for 6 min followed by acetone for 30 s and dried at 50˚C. For Pfk2-
MqsR, to preserve GFP fluorescence, this step was omitted. Cells were blocked in 1% BSA in PBST 2
Fuller et al. eLife 2020;9:e48480. DOI: https://doi.org/10.7554/eLife.48480 20 of 30Research article Cell Biology
hr at room temperature. For Pfk2-RNase A, cells were incubated with 1:200 rabbit anti-S tag anti-
body (Genscript A00625) overnight and 1:1000 mouse anti-GFP antibody (Thermo Fisher A-11120)
for Pfk2-RNase A and 1:200 mouse anti-Flag antibody in PBST overnight at 4˚C. Cells were washed
three times in PBST and 1:500 donkey anti-mouse Alexa Fluor 488 antibody (A-21202), and 1:500
goat anti-rabbit Alexa Fluor 647 antibody (A-21245) for Pfk2-RNase A in PBST was added for 1 hr at
room temperature. For Pfk2-MqsR-Fl experiments, 1:500 donkey anti-mouse Alexa Fluor 647 anti-
body (A-31571) was added in PBST for 1 hr at room temperature. Cells were mounted in Vectashield
plus DAPI (Vector laboratories, H1200) and imaged.
Yeast fluorescence microscopy imaging and analysis
All cells were imaged using a Zeiss AxioImager M2 with an ORCA-Flash 4.0 LT camera with band
pass GFP filter (Zeiss 38 HE eGFP) illuminated with a 488 nm LED with either 40X or 100X objective
taking Z stacks to cover the entire cell. Immunofluorescence images were taken with illumination
from a mercury halide arc lamp and band pass GFP filter and CY5 filter (Zeiss 50).
For assaying G body formation, cells were manually counted and classified into one of three cate-
gories: cells with single puncta, cells with multiple puncta, and cells with no puncta. At least 100 cells
were considered for each replicate and condition.
For mating experiments, cells of each mating type were mixed at an OD600 of 0.05 and grown 18
hr -O2. Cells were allowed to settle in 24-well plates for mating to proceed and sampled after 3, 5,
7, and 24 hr. For mating cells with Pfk2-Azurite and Pfk2-GFP, Azurite was imaged with a BFP band
pass filterset (Zeiss 96 HE) illuminated with a 365 nm LED, and GFP was imaged as above. To com-
pensate for high background, mating cells were resuspended in PBS before imaging. Z stacks were
taken in each channel and brightfield. Overlapping puncta were manually counted in all Z planes,
and puncta were classed into four categories: overlapping puncta in cells with one focus, overlap-
ping puncta in cells with multiple foci, adjacent puncta, and puncta not associated with other puncta.
For mating cells with Pfk2-GFP only to observe kinetics, cells were mixed and grown 18 hr -O2 and
placed on a slide. Fields of cells were imaged taking Z stacks every 2 min through a GFP filter.
For size distributions of G bodies, local maxima were identified in maximum intensity projections
in FIJI (Schindelin et al., 2012) using the Find Maxima tool. A square with sides of 4.9 mm was drawn
around each maximum. Average background from three separate spots in each image was sub-
tracted. Using custom Python scripts (Supplementary file 5), each focus was fit using nonlinear least
squares to a 2-dimensional Gaussian distribution of the form:
2 2 2 2
ððcos 2 þ sin 2Þðx x0 Þ2 þ2ð sin2
þ sin2
2 Þðx x0 Þðy y0 Þþð
sin
2 þ
cos 2
2 Þðy y0 Þ ÞÞ
2sx 2sy 4s2x 4sy 2sx 2sy
f ðx; y Þ ¼ b þ A e
where b is the baseline fluorescence, A is the amplitude of the peak fluorescence of the focus, x0
and y0 define the center coordinate, sx and sy represent the standard deviation along each axis and
q defines the rotation of the punctum.
Yeast PAR-CL-Mass spectrometry
3 L of BY4742 were cultured from an initial OD600 of 0.003 and grown until OD600 of 0.7–0.8. Cyclo-
heximide was added to a final concentration of 0.1 mg/ml and incubated at 30˚C for 5 min. Cells
were pelleted by centrifugation for 5 min at 4,000 rpm at 18˚C using a JLA-10.5 rotor in an Avanti
J-26XP centrifuge, resuspended in 10 ml 1X PBS (with 0.1 mg/ml cycloheximide), transferred to a
150 mm glass Petri dish, placed on ice, and irradiated 4 times with 365 nm UV light at 150 mJ/cm2
using a UVP CL-1000L UV crosslinker. The cells were then transferred to a 15 ml conical tube and
pelleted for 3 min at 3000 x g at room temperature. After removing the PBS, the cells were frozen in
liquid nitrogen. For the negative control, cells were frozen without UV irradiation. Frozen cell pellets
were pulverized for two cycles, each for 1 min, at 30 Hz on a Retsch MM 4000 ball mill homogenizer.
Sample chambers were pre-chilled in liquid nitrogen and re-chilled between cycles. The resulting fro-
zen powdered homogenate was resuspended in 3 ml of polysome lysis buffer (20 mM HEPES, pH
7.5, 140 mM KCl, 1.5 mM MgCl2, 1% Triton X-100, 1X cOmplete Mini Protease Inhibitor, EDTA free,
0.1 mg/ml cycloheximide) and incubated on ice for 10 min. Cell debris was removed by centrifuga-
tion for 2 min at 3000 x g at 4˚C. The supernatant fraction was clarified by a 20,000 x g spin for 10
min at 4˚C and supplemented with 12 ml SUPERaseIn (20 U/ml). 0.3 ml of 1 M (34.2% w/v) sucrose
cushion solution, prepared in polysome lysis buffer, was layered on the bottom of each 11 34 mm
Fuller et al. eLife 2020;9:e48480. DOI: https://doi.org/10.7554/eLife.48480 21 of 30Research article Cell Biology
polycarbonate centrifugation tube. 3 ml of clarified lysate was loaded onto three sucrose cushions (1
ml per cushion) and spun for 80 min at 54,000 rpm at 4˚C in a TLS-55 rotor using an Optima Ultra-
centrifuge MAX-E. After centrifugation, the top 1 ml of solution was recovered from each tube (3 ml
in total), mixed with 1.5 g of guanidine thiocyanate (GuSCN, Promega V2791), vortexed to dissolve
GuSCN, and heated for 5 min at 65˚C. A Zeba desalting column (7K MWCO, 10 ml, Pierce 89894)
was used to remove GuSCN and to exchange buffer to 50 mM NaCl buffer (20 mM HEPES, pH 7.3,
50 mM NaCl, 0.5% Sarkosyl, 1 mM EDTA). Buffer-exchanged lysate was combined with 0.1 vol of 5
M NaCl to adjust the salt concentration to 0.5 M and supplemented with 6 ml SUPERaseIn (20 U/ml).
The lysate was incubated with 37.5 mg of oligo(dT)25 beads (NEB S1419S) for 30 min at 4˚C on a
Nutator. Beads were washed four times with ice-cold low-salt wash buffer (20 mM HEPES, pH 7.3,
0.2 M NaCl, 0.2% Sarkosyl, 1 mM EDTA). RNAs were eluted in 1 ml of elution buffer (10 mM HEPES,
pH 7.3, 1 mM EDTA) by heating for 3 min at 65˚C. Eluted RNAs were concentrated to 80 ml with
Amicon spin filters (3 KD cutoff, Millipore UFC500324). Concentrated RNAs were mixed with 40 ml
of 3X SDS sample buffer (150 mM Tris, pH 6.8, 6% SDS, 30% glycerol, 3% beta-mercaptoethanol,
37.5 mM EDTA, 0.06% Bromophenol blue) and heated for 5 min at 65˚C. 20 ml of sample was loaded
per lane (six lanes total) of a 4–12% NU-PAGE Bis-Tris gel and run for 10 min at 100 V, followed by
70 min at 150 V. The gel was stained with Colloidal Blue (Invitrogen LC6025), and a gel piece, 0.1
cm-1.0 cm below the well, was excised and stored at 80˚C before mass spectrometry analysis.
For mass spectrometry, unless otherwise noted, all chemicals were purchased from Thermo Fisher
Scientific (Waltham, MA). Deionized water (18.2 MW, Barnstead, Dubuque, IA) was used for all prep-
arations. Buffer A consists of 5% acetonitrile, 0.1% formic acid; buffer B consists of 80% acetonitrile,
0.1% formic acid; and buffer C consists of 500 mM ammonium acetate. All buffers were filtered
through 0.2 mm membrane filters (PN4454, Pall Life Sciences, Port Washington, NY). In-gel digestion
was performed as in Jensen et al. (1999) with the following adjustments: Gel particles were rehy-
drated with 10 mM Tris (2-carboxyethyl) phosphene in 100 mM NH4HCO3 and incubated for 30 min
at room temperature. Digestion buffer was 50 mM NH4CO3, 5 mM CaCl2, containing 12.5 ng/ml
trypsin. The gel pieces were rehydrated at room temperature for 30–45 min. The enzyme superna-
tant fraction was not removed, and 50 ml digestion buffer, without enzyme, was added before over-
night digestion. A MudPIT microcolumn (Wolters et al., 2001) was prepared by first creating a Kasil
frit at one end of an undeactivated 250 mm ID/360 mm OD capillary (Agilent Technologies, Inc,
Santa Clara, CA). The Kasil frit was prepared by briefly dipping a 20- to 30 cm capillary in well-mixed
300 ml Kasil 1624 (PQ Corporation, Malvern, PA) and 100 ml formamide, curing at 100˚C for 4 hr
and cutting the frit to ~2 mm in length. Strong cation exchange particles (SCX Partisphere, 5 mm
dia., 125 Å pores, Whatman) were packed in-house from particle slurries in methanol to 2.5 cm. 2.5
cm reverse phase particles (C18 Aqua, 3 mm dia., 125 Å pores, Phenomenex, Torrance, CA) and
were then packed into the capillary using the same method as SCX loading, to create a biphasic col-
umn. The MudPIT microcolumn was equilibrated using 60% buffer A, 40% buffer B for 5 min, and fol-
lowed by 100% buffer A for 15 min. An analytical RPLC column was generated by pulling a 100 mm
ID/360 mm OD capillary (Polymicro Technologies, Inc, Phoenix, AZ) to 5 mm ID tip. Reverse phase
particles (Aqua C18, 3 mm dia., 125 Å pores, Phenomenex, Torrance, CA) were packed directly into
the pulled column at 800 psi until they were 12 cm long. The column was further packed, washed,
and equilibrated with buffer B followed by buffer A. The MudPIT microcolumn was connected to an
analytical column using a zero-dead volume union (Upchurch Scientific (IDEX Health and Science),
P-720–01, Oak Harbor, WA). LC- MS/MS analysis was performed using an Eksigent nano-flow pump
and a Thermo LTQ-Orbitrap using an in-house-built electrospray stage. MudPIT experiments were
performed where each step corresponds to 0, 10, 20, 30, 40, 50, 60, 70, 80, 90, and 100% buffer, C
being run for 5 min at the beginning of each gradient of buffer B. Electrospray was performed
directly from the analytical column by applying the ESI voltage at a tee (150 mm ID, Upchurch Scien-
tific) while flowing at 350 nl/min through the columns. Electrospray directly from the LC column was
done at 2.5 kV with an inlet capillary temperature of 250˚C. Data-dependent acquisition of MS/MS
spectra with the LTQ-Orbitrap were performed with the following settings: MS/MS on the 10 most
intense ions per precursor scan, one microscan, unassigned and charge state one reject; dynamic
exclusion repeat count, 1, repeat duration, 30 s; exclusion list size 120; and exclusion duration, 120
s. Tandem mass spectra were extracted from raw files using RawExtract 1.9.9 (McDonald et al.,
2004) and were searched against a yeast protein database (http://www.yeastgenome.org) with
reversed sequences using ProLuCID (Peng et al., 2003; Xu et al., 2015). The search space included
Fuller et al. eLife 2020;9:e48480. DOI: https://doi.org/10.7554/eLife.48480 22 of 30You can also read