Roadmap for europe - Greenpeace
←
→
Page content transcription
If your browser does not render page correctly, please read the page content below
roadmap                                  for europe
      TOWARDS A SUSTAINABLE AND INDEPENDENT ENERGY SUPPLY

report The Energy [R]evolution for the EU 28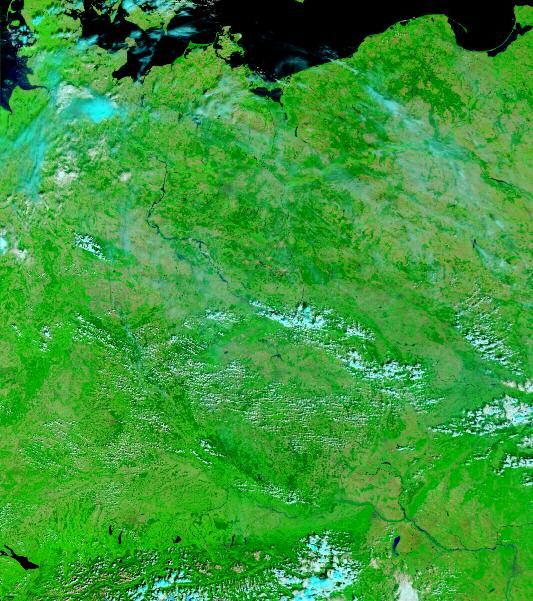
“will we look into the eyes
      of our children and confess
      that we had the opportunity,
      but lacked the courage?
      that we had the technology,
      but lacked the vision?”

                                                                                                                                                       © LANGROCK/ZENIT/GP

                                      Greenpeace International,              Greenpeace European Unit               Chapter 1: Ludwig Bölkow
                                      Greenpeace EU-Unit                     Franziska Achterberg                   Systemtechnik, Dr. Werner Zittel
                                      date June 2014                         Greenpeace Belgium                     editor Alexandra Dawe,
                                                                             Jan Vande Putte
                                      lead author Sven Teske,                                                       design & layout onehemisphere,
                                      Greenpeace International               research & co-authors                  Sweden, www.onehemisphere.se
                                                                             Overall modelling: DLR, Institute
                                      Greenpeace International               of Technical Thermodynamics,           contacts
                                      Sven Teske                                                                    sven.teske@greenpeace.org
 partners                                                                    Department of Systems Analysis and
                                                                             Technology Assessment, Stuttgart,
                                                                             Germany: Dr. Thomas Pregger

image OFFSHORE WINDFARM, MIDDELGRUNDEN, COPENHAGEN, DENMARK.

For further information about the global, regional and national scenarios please visit the Energy [R]evolution website: www.energyblueprint.info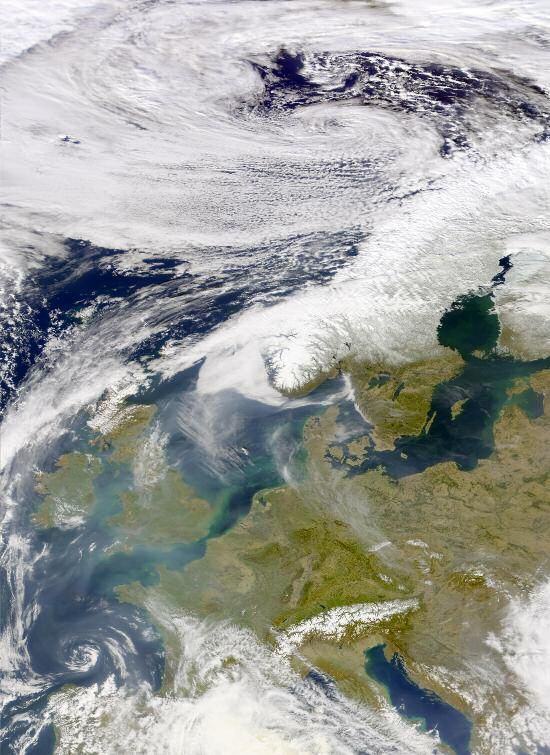
contents                                                            list of figures

introduction                                                   4    figure 1.1    gas-production 1990-2010 and projection
                                                                                  until 2050 for europe                              11
                                                                    figure 1.2    oil-production 1990-2010 and projection
executive summary                                              5                  until 2050 for europe                              12
                                                                    figure 1.3    coal-production 1990-2010 and projection
                                                                                  until 2050 for europe                              13
                                                                    figure 2.1    development of total final energy demand
1   fossil fuel resource analysis                              8
                                                                                  by sector in the energy [r]evolution scenario
                                                                                  (high efficiency)                                  19
    1.1   gas                                                  9
                                                                    figure 2.2    development of electricity demand by sector in
    1.1.1 qualitative analysis of trends and projections       9                  the energy [r]evolution scenario (high efficiency) 19
    1.1.2 identification of potential regional short                figure 2.3    development of heat demand by sector in the
          falls and bottlenecks                                10                 energy [r]evolution scenario (high efficiency)     19
    1.1.3 analysis of regional oversupply risks towards 2020   11   figure 2.4    electricity generaion structure under the COM
    1.1.4 gas production in the EU between 1990 and 2010                          and energy [r]evolution scenario (high efficiency) 20
          and a projection until 20350                         11   figure 2.5    development of total electricity supply costs &
    1.2   oil                                                  11                 of specific electricity generation costs           21
    1.2.1 qualitative analysis of trends and projections       11   figure 2.6    development of total final energy demand by
    1.2.2 identification of potential regional short falls                        sector under the COM and the energy [r]evolution
          and bottlenecks                                      11                 scenario (high efficiency)                         22
    1.2.3 analysis of regional oversupply risks towards 2020   12   figure 2.7    development of total transport energy demand by
    1.2.4 oil production in the EU between 1990 and 2010                          fuel under the COM and the energy [r]evolution
          and a projection until 20350                         12                 scenario (high efficiency)                         23
    1.3   hard coal                                            12   figure 2.8    development of total primary energy demand by
    1.3.1 qualitative analysis of trends and projections       12                 sector under the COM and the energy [r]evolution
    1.3.2 identification of potential regional short falls                        scenario (high efficiency)                         24
          and bottlenecks                                      13   figure 2.9    development of CO2 emissions by sector under
    1.3.3 coal production in the EU between 1990 and 2010                         the energy [r]evolution scenario (high efficiency) 24
          and a projection until 2050                          13   figure 3.1    oil: EU import requirements versus oil demand:
    1.4   uranium                                              13                 COM and energy [r]evolution                        27
    1.5   current supply and demand in europe                  14   figure 3.2    gas: EU import requirements versus gas demand:
                                                                                  COM and energy [r]evolution                        27
    1.5.1 EU primary energy production                         14
                                                                    figure 3.3    coal: EU import requirements versus coal demand:
    1.5.3 imports and energy deficit of the EU                 14
                                                                                  COM and energy [r]evolution                        28
    1.5.3 great differences among member states                14

2   the energy [r]evolution: the EU energy
    independence pathway for europe                            15

    2.1   assumptions and methodology                          16   list of tables
    2.1.1 assumptions for the cmmission scenario (COM)
          used as a reference scenario                         16
    2.1.2 assumptions for the energy [r]evolution scenario     16
    2.1.3 oil and gas price projections                        18
    2.2   key results of the energy [r]evolution EU                 figure 2.1     population development in the EU 28 2010-2050     17
          energy independence pathway                          19   figure 2.2     GDP development projections in the
    2.2.1 EU28: energy demand by sector                        19                  EU 28 2010-2050                                   17
    2.2.2 EU28: electricity generation                         20   figure 2.3     development projections for fossil fuel and
    2.2.3 EU28: future costs of electricity generation         21                  biomass prices in € 2010                          18
    2.2.4 EU28: future investments                             21   figure 2.4     renewable electricity generation capacity under
                                                                                   the COM scenario and energy [r]evolution
    2.2.5 EU28: heat supply                                    22                  scenario (high efficiency)                        20
    2.2.6 EU28: transport                                      23   figure 2.5     projection of renewable heating capacity under
    2.2.7 EU28: primary energy consumption                     24                  the COM and the energy [r]evolution scenario
    2.2.8 EU28: development of CO2 emissions                   24                  (high efficiency)                                 22
                                                                    figure 2.6     projection of transport energy demand by mode
                                                                                   in the COM and the energy [r]evolution scenario
3   fossil fuel requirements for the EU                        25                  (high efficiency)                                 23
                                                                    figure 3.1     overview of fuel demand under COM and the
    3.1     fossil fuel balance: scenario comparison           26                  energy [r]evolution                               26
    3.2     fossil fuel balances by fuel                       27   figure 3.2     overview of additional fuel demand COM vs
    3.2.1   oil                                                27                  energy [r]evolution                               27
    3.2.2   gas                                                27   figure 3.3     invesments in new power plants under the
    3.2.3   coal                                               28                  energy [r]evolution and COM scenarios             28
    3.3     fossil fuel costs versus investment in                  figure 3.4     invesments and fuel cost savings under the
            new renewable power technologies                   28                  COM and energy [r]evolution scenarios             29
                                                                    figure 10.1    conversion factors - fossil fuels                 33
                                                                    figure 10.2    conversion factors - difference energy units      33
4   EU policy recommendations                                  30   figure 10.3-10.20 EU 28: scenario results data                   34

5   glossary & appendix                                        32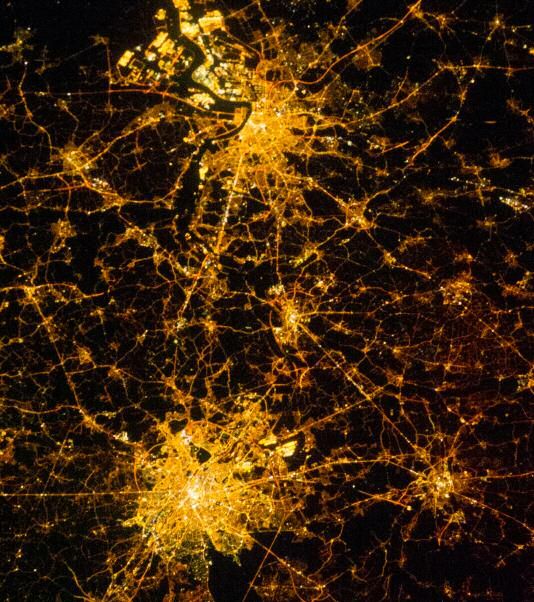
ROADMAP FOR EUROPE
TOWARDS A SUSTAINABLE AND INDEPENDENT ENERGY SUPPLY

introduction

                                                                                                                                                                        © ANTHONY UPTON 2003
image NORTH HOYLE WIND FARM, UK’S FIRST WIND FARM IN THE IRISH SEA WHICH SUPPLIES 50,000 HOMES WITH POWER.

This report, which includes the 4th edition of Greenpeace’s EU              EU leaders are expected to reach crucial decisions on both these
Energy [R]evolution scenario1, comes at a time of profound                  discussions in October this year.
changes and challenges in the European energy market. The
                                                                            Against this background, this report compares the impact on
conflict in Ukraine has once again sparked a discussion about
                                                                            energy imports of two approaches to 2030 climate and energy
Europe’s dependence on fossil and nuclear fuel imports and its
                                                                            targets. The first approach is based on the Commission’s proposal
need to reduce this dependence to ensure future energy security.
                                                                            for a 40% cut in carbon emissions and a 27% renewable energy
The EU depends on Russian gas piped through Ukraine for about
                                                                            share by 2030, without any specific target for energy savings.2
10% of its overall needs, with some Eastern countries being
                                                                            The second scenario reflects the demands by Greenpeace and
much more exposed.
                                                                            other environmental organisations for a set of three targets,
In March 2013, the threat of possible gas supply disruptions led            including a 55% cut in EU carbon emissions (compared to
EU leaders to ask the European Commission to draw up a plan                 1990), a renewable energy share of 45% and a reduction in
to reduce Europe’s energy dependence. The Commission released               primary energy consumption of 40% (compared to 2005).
this plan on 28 May.
                                                                            Chapter 1 provides an analysis of global conventional fossil fuel
This energy security debate comes at the same time as                       production. It highlights the declining trend of this production with
discussions on the future direction of European climate and                 a particular focus on the EU’s own fossil fuel production. Chapter
energy policies. The focus is on which targets the EU should set            2 presents two scenarios based on the Commission proposal for
for 2030 to follow up its three targets for 2020 on carbon                  2030 targets (COM scenario) and Greenpeace’s demands for such
reductions, renewable energy and energy efficiency. In January              targets (Energy [R]evolution scenario). A third chapter provides an
2014, the Commission tabled a proposal including two targets for            overview of fossil fuel import requirements of the two energy
2030, a domestic 40% reduction in carbon emissions (compared                scenarios. Finally, Chapter 4 recommends a number of EU policy
to 1990 levels) and a 27% share of renewable energy in the                  measures that would be needed to achieve the changes set out
EU’s overall energy consumption.                                            under the Greenpeace Energy [R]evolution scenario.
The two discussions on energy security and 2030 targets are
inextricably linked. While not every measure to enhance the EU’s            references
energy security will also advance its climate and energy agenda, a          1   THE FIRST EDITION OF THE EU E[R] REPORT WAS PUBLISHED IN 2005. FURTHER EDITIONS FOLLOWED
                                                                                IN 2010 AND 2012.
set of ambitious 2030 targets will drastically reduce the need for          2   AT THE TIME OF WRITING (JUNE 2014) THE COMMISSION HAS YET TO PROPOSE A FIRM TARGET ON 2030
                                                                                ENERGY SAVINGS.
energy imports, thereby strengthening the EU’s security of supply.
4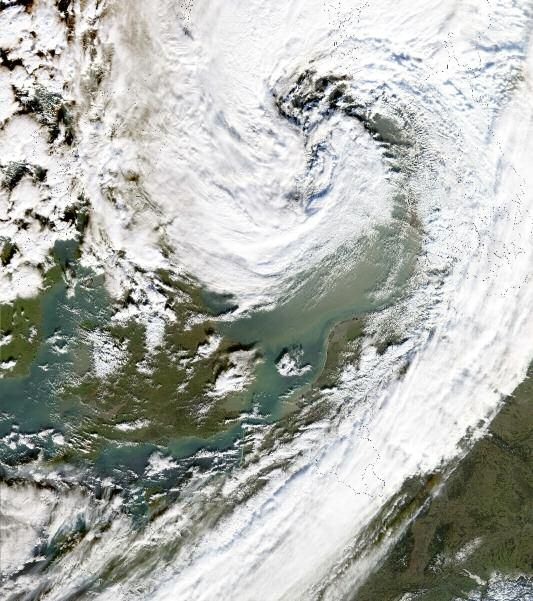
executive summary

                                                                                                                                                     © LEONID IKAN /ISTOCK
image PIPELINES IN RUSSIA.

The consequences of the Ukraine crisis have once again               This report compares the impact on EU energy imports of two
highlighted Europe’s vulnerability to energy import disruptions.     approaches to 2030 climate and energy targets. This first
There is a risk that, as in 2006 and 2009, gas imports from          approach is based on the Commission’s proposal for a 40% cut in
Russia through Ukraine could drop or dry up completely. These        domestic EU carbon emissions (compared to 1990) and a 27%
imports represent over 10% of Europe’s gas supply.                   renewable energy share, without any specific target for energy
                                                                     savings. The second approach reflects demands by Greenpeace and
However, Europe’s reliance on Russian gas is part of a wider
                                                                     other environmental organisations for a set of three targets
problem of import dependency. The EU spends about € 400
                                                                     including carbon emission cuts of at least 55% (compared to
billion buying over half of its energy (53%) from abroad.1 At the
                                                                     1990), a renewable energy share of 45% and a reduction in
same time, the use of imported fossil fuels leads to large amounts
                                                                     primary energy consumption of 40% (compared to 2005).
of CO2 emissions which cause climate change.
                                                                     The report shows that, based on the Commission’s proposed 2030
The debate about energy security comes at a time when Europe is
                                                                     targets, even if the European Union exploits all of its own
discussing what energy policies to set for beyond 2020. In
                                                                     conventional gas, oil and hard coal, it would still have to import a
January, the Commission tabled a proposal for 2030 climate and
                                                                     total of 29,000 petajoules (PJ) per year in fossil fuels by 2030.
energy targets. In May, it also released a proposal for a European
energy security strategy. EU leaders are expected to take a final    Specifically, it would need to import about 255 billion cubic
decision on both issues – 2030 targets and energy security – at      metres (m3) of gas, 2.8 billion barrels (bbl) of oil and 81 million
an EU summit in October.                                             tonnes of hard coal. Overall, this would result in a limited
                                                                     reduction in EU energy imports compared to today’s levels.

                                                                     reference
                                                                     3   HTTP://EC.EUROPA.EU/ENERGY/DOC/20140528_ENERGY_SECURITY_COMMUNICATION.PDF

                                                                                                                                                                5
ROADMAP FOR EUROPE
TOWARDS A SUSTAINABLE AND INDEPENDENT ENERGY SUPPLY

By contrast, if EU leaders backed more ambitious 2030 targets,        - The development of the electricity supply market is
overall fossil fuel import requirements would be 45% lower than         characterised by a dynamically growing renewable energy
under the Commission proposal. Specifically, annual imports of          market. This will compensate for the phasing out of nuclear
about 90 billion m3 of gas and 1.3 million bbl of oil could be          energy and reduce the number of fossil fuel-fired power plants
avoided by 2030, while no imports of hard coal would be needed          required for grid stabilization. By 2050, 95% of the electricity
at all. Compared to the Commission proposal, this represents an         produced in EU28 will come from renewable energy sources.
extra 35% cut in gas imports and a 45% cut in oil imports by            ‘New’ renewables – mainly wind, solar thermal energy and PV
2030. By 2020, gas imports could already be 12% lower, while            – will contribute 76% of electricity generation. The Energy
oil and coal imports would be 19% and 42% lower respectively.           [R]evolution scenario projects an immediate market
                                                                        development with high annual growth rates achieving a
The Energy [R]evolution pathway would also result in much
                                                                        renewable electricity share of 44% across Europe already by
higher carbon emission cuts by 2030 compared to the
                                                                        2020 and 75% by 2030. The installed capacity of renewables
Commission proposal. The investments required in the power
                                                                        will reach 907 GW in 2030 and 1,211 GW by 2050.
sector would be very similar to those under the Commission’s
proposal. The Commission’s impact assessment accompanying its         • Heating sector: -Efficiency gains in the heat supply sector are
2030 proposal also shows that higher targets would lead to              larger than in the electricity sector. Under the Energy
better health and more jobs for EU citizens.                            [R]evolution scenario, final demand for heat supply can even be
                                                                        reduced significantly. Compared to the COM scenario,
EU leaders should therefore place much greater emphasis on
                                                                        consumption equivalent to 4,060 PJ/a is avoided through
energy savings and renewable energy in order to reduce Europe’s
                                                                        efficiency measures by 2050
dependence on fossil fuel imports and to enhance its energy
security. A stringent set of policy targets for 2030 would deliver     Renewables currently provide 15% of EU28’s energy demand
on both objectives – reducing the risk of energy supply shortages      for heat supply, mainly from biomass. The lack of district
and reducing the risk posed by global climate change.                  heating networks is a severe structural barrier to the large
                                                                       scale utilization of geothermal and solar thermal energy. In the
                                                                       Energy [R]evolution scenario, renewables provide 47% of
key results high efficiency energy
                                                                       EU28’s total heat demand in 2030 and 91% in 2050.
[r]evolution pathway
                                                                      • Future costs of electricity generation: The Energy [R]evolution
• Energy demand by sector: Under the COM scenario, total
                                                                        scenario slightly increases the generation costs of electricity
  primary energy demand in EU28 decreases by -20% from the
                                                                        generation in EU28 compared to the COM scenario. This
  current 72,300 PJ/a to 57,841 PJ/a in 2050. The energy
                                                                        difference will be less than 0.7 €cents/kWh up to 2020, however.
  demand in 2030 in the Energy [R]evolution scenario decreases
                                                                        Because of the lower CO2 intensity of electricity generation,
  by 40% compared to current consumption and it is expected
                                                                        electricity generation costs will become economically favorable
  by 2050 to reach 37,900 PJ/a.
                                                                        under the Energy [R]evolution scenario and by 2050 costs will
• Primary energy consumption: Compared to the COM scenario,             be 2.5 €cents/kWh below those in the COM version. Under the
  overall energy related primary energy demand under the Energy         COM scenario, the unchecked growth in demand, an increase in
  [R]evolution scenario will be reduced by around 40% in 2030.          fossil fuel prices and the cost of CO2 emissions result in total
  Around 48% of the remaining demand will be covered by                 electricity supply costs rising from today’s € 324 billion per year
  renewable energy sources (including non-energy use).The               to € 355 billion in 2030 and more than € 461 billion by 2050.
  Energy [R]evolution version reduces coal and oil significantly
                                                                      • Future investments: Until 2030 It would require about € 1,754
  faster than the EC. This is made possible mainly by the
                                                                        billion in investment for the Energy [R]evolution scenario to
  replacement of coal power plants with renewables and a faster
                                                                        become reality (including investments for replacement after the
  introduction of very efficient electric vehicles in the transport
                                                                        economic lifetime of the plants) - approximately € 195 billion or
  sector to replace oil combustion engines. This leads to an
                                                                        € 12 billion annually more than in the COM scenario (€ 1558
  overall renewable primary energy share of 48% in 2030 and
                                                                        billion). The average annual investment in the power sector under
  92% in 2050. Nuclear energy is phased out just after 2030.
                                                                        the Energy [R]evolution scenario between today and 2050 would
• Power sector: -Under the Energy [R]evolution scenario,                be approximately € 84 billion.
  electricity demand in the industry as well as in the residential
                                                                      • Fuel costs savings: The fuel cost savings in the Energy
  and service sectors is expected to decrease after 2015.
                                                                        [R]evolution scenario reach a total of € 1,192 billion up to
  Because of the growing shares of electric vehicles, heat pumps
                                                                        2050, or € 29.8 billion per year. The total fuel cost savings
  and hydrogen generation however, electricity demand increases
                                                                        based on the assumed energy price path therefore would cover
  to 2,519 TWh in 2030 and 2,673 TWh/a in 2050, 27% below
                                                                        the total additional investments several times over compared to
  the COM case.
                                                                        the COM scenario.

6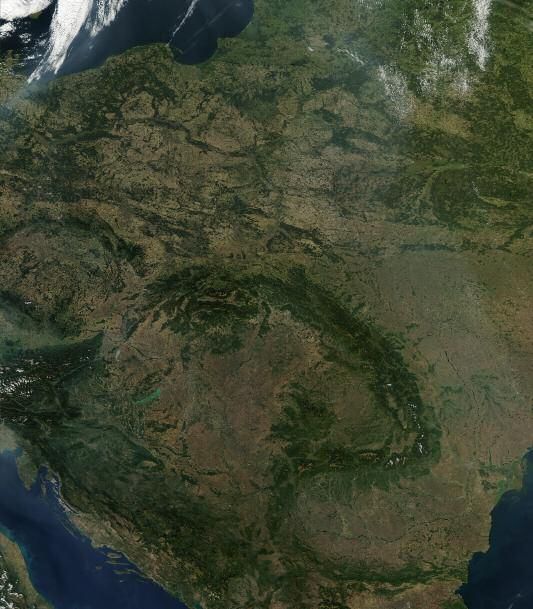
image TEST WINDMILL N90 2500, BUILT BY THE

                                                                                                                    © PAUL LANGROCK/ZENIT/GP
                                                                    GERMAN COMPANY NORDEX, IN THE HARBOUR OF
                                                                    ROSTOCK. THIS WINDMILL PRODUCES 2.5 MEGA WATT
                                                                    AND IS TESTED UNDER OFFSHORE CONDITIONS. TWO
                                                                    TECHNICIANS WORKING INSIDE THE TURBINE.

• Transport: In the transport sector, it is assumed under the
  Energy [R]evolution scenario that an energy demand reduction
  of about 6,000 PJ/a can be achieved by 2050, saving 49%
  compared to the COM scenario. Energy demand will therefore
  decrease between 2009 and 2050 by 54% to 6,200 PJ/a. In
  2030, electricity will provide 12% of the transport sector’s
  total energy demand in the Energy [R]evolution, while in 2050
  the share will be 50%.
• Development of CO2 emissions: While energy related CO2
  emissions in EU28 will decrease by 40% in the COM scenario,
  under the Energy [R]evolution scenario they will decrease by
  over 60% by 2030. It is important to note, that the original
  Commission scenario has a reduction target of 40%
  greenhouse gas (GHG), while the COM case calculates only
  energy related CO2 emissions. Annual per capita emissions will
  drop from 7.2 tonne to 2.7 tonne in 2030 and 0.3 tonne in
  2050. In spite of the phasing out of nuclear energy and
  increasing demand, CO2 emissions will decrease in the
  electricity sector. In the long run efficiency gains and the
  increased use of renewable electricity in vehicles will reduce
  emissions in the transport sector. With a share of 18% of CO2
  emissions in 2030, the power sector will drop below transport
  and other sectors as the largest sources of emissions. By 2050,
  EU28’s CO2 emissions are 4% of 1990 levels.

                                                                                                                                 7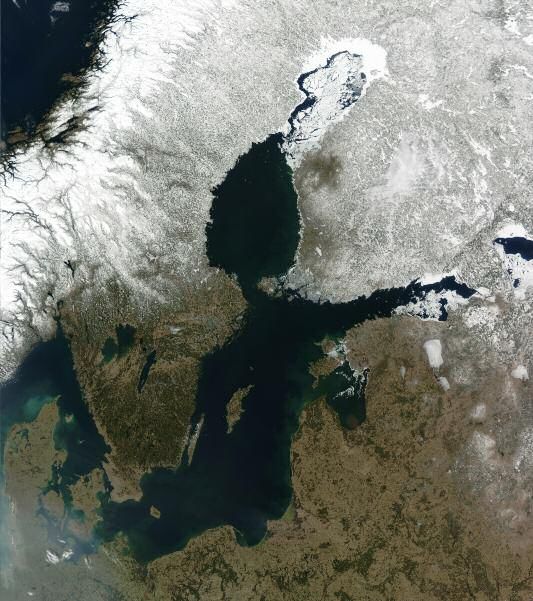
1
fossil fuel resource analysis
GAS ANALYSIS OF COAL SUPPLY URANIUM RESOURCES’ - CURRENT SUPPLY AND
EU’S 97% DEPENDENCY DEMAND IN EUROPE
OIL: QUALITATIVE ANALYSIS OF ON URANIUM IMPORTS
TRENDS AND PROJECTIONS
1 © JEFF SCHMALTZ, MODIS RAPID RESPONSE TEAM, NASA/GSFC
“ energy
efficiency
reduces
energy
imports”
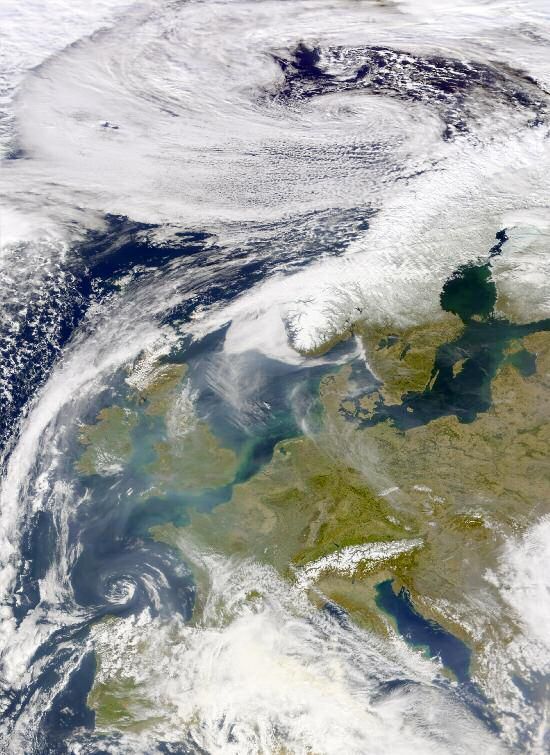
image THE SCANDINAVIAN COUNTRIES, NORWAY AND SWEDEN, AND FINLAND TO THE NORTH OF THE SEA ARE STILL BLANKETED IN SNOW. FROM THE LEFT, THE COUNTRIES
LINING THE BALTIC ON THE SOUTH ARE DENMARK, GERMANY, POLAND, RUSSIA (KALININGRAD), LITHUANIA, LATVIA, ESTONIA, AND RUSSIA. BELARUS FORMS THE LOWER
RIGHT CORNER OF THE IMAGE.
8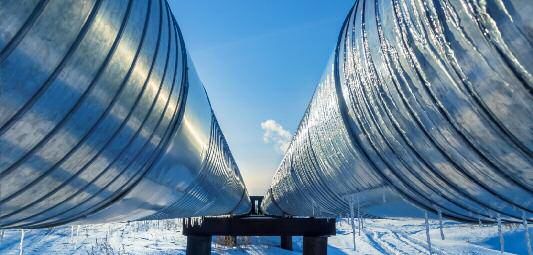
image A COW IN FRONT OF A BIOREACTOR IN THE
                                                                        BIOENERGY VILLAGE OF JUEHNDE. IT IS THE FIRST
                                                                        COMMUNITY IN GERMANY THAT PRODUCES ALL OF

                                                                                                                                            © LANGROCK/ZENIT/GP
                                                                        ITS ENERGY NEEDED FOR HEATING AND
                                                                        ELECTRICITY, WITH CO2 NEUTRAL BIOMASS.

                                                                                                                                                                  1

                                                                                                                                                                  fossil fuel resource analysis |
Burning fossil fuels emits large amounts of CO2 which is proven         1.1 gas
to cause climate change the science was indisputably laid out in
                                                                        1.1.1 qualitative analysis of trends and projections
the Fifth Assessment Report by the Intergovernmental Panel on
Climate Change (IPCC)4,, which concluded that there is 95               All large gas producers in Europe except Norway are already in
percent certainty that human activity -- such as the burning of         decline. Even Norway seems to be very close to peak production.
fossil fuels -- is the primary cause of climate change.                 It is agreed by almost all observers including IEA and Eurogas –
                                                                        the European gas producers association – that gas production in
However, added to the worry with regards to the environment is
                                                                        Europe will considerably decline by 2030 and 2035.
also security of supply. Renewable energies – with the exception

                                                                                                                                                                     GAS
of bioenergy – have the fundamental advantage that they do not          Conventional natural gas production peaked in the US in parallel
need any fuels which releases the EU from relying on imports            to oil production around 1970. The development of tight gas
from outside of its borders. Thus, one of the main drivers for the      formations – which very often are not distinguished from
expansion of renewable energy markets should be security of             conventional production as the transition is smooth – helped to
supply. Currently the EU still relies for the majority of its energy    soften the decline. In 2010, gas production from tight gas had a
needs on fossil fuel despite the dwindling local reserves and           share of about 30% on overall gas production. A further 10% is
unreliable international markets that fluctuate dependent on            contributed by gas production from coal beds (CBM). However a
economic and geopolitical externalities.                                regional analysis of coal bed methane (CBM) reservoirs and coal
                                                                        beds shows that peak has already been reached in the largest and
To better understand the current fossil fuel supplies the EU can
                                                                        most promising regions, for instance in Wyoming.
tap into, this chapter takes an in depth view of the current fossil
fuel landscape. It is based on a global fossil fuel resource analysis   Some believe that shale gas will be a game changer. Indeed, US
of Ludwig Bölkow System Analysis (LBST) for Greenpeace                  production from gas shale increased from below 1% in around
International which estimated the global conventional oil, gas and      2000 to about 10% in 2010 This steep rise in production is
coal resources based on production capacities of existing oil- and      taken as base for extrapolation to other shales in the USA and
gas wells and coal mines, current infrastructure as well as the         also in other countries around the world.
investment plans known by the end of 2011. It assessed the
                                                                        The natural gas production in Russia peaked in 1989 when
remaining fossil fuel resources between 2012 and 2050 excluding
                                                                        production from the three largest fields Urengoy, Medvezhe and
any new deep sea and Arctic oil exploration, oil shale and tar
                                                                        Yamburg peaked with a combined output of more than 90% of
sand mining.
                                                                        Russian gas production. In the meantime the decline has been
The assessment is based on past and projected production                stopped and reversed by the expensive development of already
volumes. The research distinguishes between resources, reserves         known fields, after the disintegration of the Soviet empire
and production dynamics:                                                attracted new investments. However, the remaining new fields are
                                                                        further away from markets in geographically more challenging
• Resources very often have a large speculative element which
                                                                        regions, requiring higher specific investments and longer lead
  has no correlation to possible production volumes. Resource
                                                                        times due to the short Arctic summers.
  estimates are by no means usable in the sense that these
  resources exist, or even when they exist that they have the           Presently, Russia faces serious challenges due to the steady decline of
  possibility of becoming economically interesting for production       base production, the development of expensive new fields, a rising
  one day. Nobody in a company or institute can be made                 domestic demand and increased demand from Asia as well as Europe.
  responsible for a resource message which decades later turns
                                                                        In face of these developments the industry enthusiasm for
  out to be extremely unrealistic.
                                                                        unconventional gas resources points towards serious problems with
• Reserves have a closer correlation to potential future                existing production infrastructure. The necessary huge investments in
  production volumes. However, the quality of reserve estimates         the development of unconventional gas resources must be interpreted
  still differs. It is by no means ensures that these reserves will     as confirmation that gas production will become much more
  be produced.                                                          expensive than in the past – despite what is being claimed publicly.
• The most important measure is production volumes. The                 Our scepticism with regards to shale gas resources is based on
  dynamics between production from declining producing fields           various issues:
  and still untouched but discovered new fields determines
                                                                        First of all the production methods are harmful to the
  whether the net balance at a regional and global level will
                                                                        environment, requiring huge amounts of water, chemicals and
  decline or rise. Despite the recent enthusiasm about rising gas
                                                                        disposal opportunities for wastewater. The fast development in the
  resources it is a matter of fact that about half of present world
                                                                        USA was only possible as the production was exempted from
  gas production comes from regions where peak production
                                                                        environmental rules (The US-EIA was excluded from monitoring
  happened: Europe, North America and Russia.
                                                                        and punishing violations by the Clean Energy Act in Amendment
                                                                        1007, where these activities were explicitly excluded from the
                                                                        SWDA from 1974 and amendments).
                                                                        reference
                                                                        4   HTTPS://WWW.IPCC.CH/REPORT/AR5/WG1/

                                                                                                                                                      9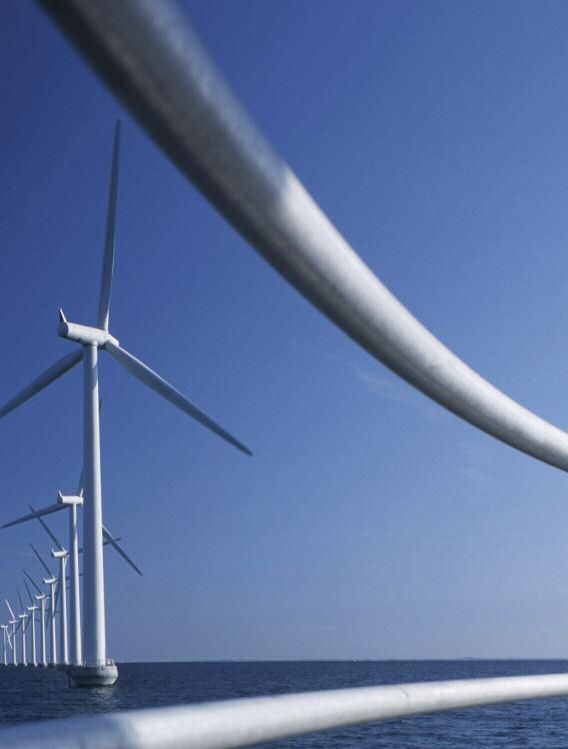
ROADMAP FOR EUROPE
                                  TOWARDS A SUSTAINABLE AND INDEPENDENT ENERGY SUPPLY

                     1
fossil fuel resource analysis |

                                  Still unclear:                                                             1.1.2 identification of potential regional shortfalls
                                                                                                             and bottlenecks
                                  • How will the current production volumes develop over time
                                    from existing wells as projections show that production can              The gas sector is very different to the oil sector as regional
                                    significantly decrease after only a very short timeframe?                markets developed where consumer and producer regions were
                                                                                                             connected by pipelines. Only a few percent of world gas production
                                  • Can the USA production experiences of large quantities of
                                                                                                             is transported in liquefied form to intercontinental destinations.
                                    shale gas actually be replicated in other regions – is this
                                    transferable to other countries?                                         Mature areas with long lasting relations are the USA with
   GAS

                                                                                                             connections to Canada and Mexico, Europe with connections to
                                  Shale gas wells show a typical production profile with a short
                                                                                                             North Africa and Russia, and predominantly China. Korea and
                                  production period followed by a steep decline of 5 – 10% per
                                                                                                             Japan are completely isolated. Their import needs are completely
                                  month. The regional aggregation of individual well profiles shows
                                                                                                             satisfied by LNG. Based on these structures, regional bottlenecks
                                  that production can initially increase rapidly, with the addition of
                                                                                                             and inequalities between different markets are more likely to
                                  new wells. But very soon the decline of the individual wells takes
                                                                                                             occur than with oil.
                                  the lead – new wells must be added faster and faster just to
                                  compensate for the decline. However economics has it that first            The USA is by far the largest consumer in North America and
                                  developments start in the most rich areas which promise highest            already receives imports from Canada to satisfy its needs. Based
                                  profits. As soon as these are developed the new well additions are         on experienced shortfalls in the early 2000s and expected rising
                                  smaller in production volume and lower in total output. Initally           requirements many new LNG import facilities have been planned,
                                  technological learning can compensate for this deficit. But as soon        some of them already realized. Total US-regasification-capacitiy
                                  as the development speed of new pits decelerates so does the total         rose from 20 billion Nm³/year in the year 2000 to 160 billion
                                  output. This decline in output has already begun in the Antrim             Nm³/year in 2010. However three developments inverted the
                                  Shale (Michigan), the Barnett Shale (Texas), the Fayetteville Shale        situation making USA for some time an exporter of LNG at very
                                  (Texas/Arkansas) and even the Haynesville shale.                           low level (~1 billion Nm³/yr).
                                  The worldwide resource estimates assume huge recovery rates of             With regards to Europe, we believe that the decline of domestic
                                  around 25% of the estimated gas in place. However, the present             production will set the frame for rising import needs. According
                                  developments in the US indicate that only 5%-10% of the gas in             to LBST, 200-300 billion cubic-meters per year [m³/yr] must be
                                  place may eventually be produced. But another restriction comes            imported additionally until 2030 in order to match an even flat
                                  from the huge water requirements and the different geographic              demand. Shale gas developments inside Europe will only have a
                                  structure of these shale regions. For instance, it is very unlikely that   marginal influence on these developments. Probably also Russia
                                  in China, South Africa or Australia huge amounts of water (in the          will not be able to supply these quantities. Moreover, LBST
                                  order of ten million litres per well and a total of several hundred        believes that Russian exports to Europe will stay static and start
                                  thousand wells) will be allowed to be contaminated with toxic              to decline around 2020-2025. This judgement is based on the
                                  chemicals while these areas experience water scarcity already              expected development:
                                  today. In addition these shales are very often far away from               • That Russia will struggle in increasing its gas production due
                                  consumers and distribution networks while the pure economics                 to severe development problems of remaining on- and offshore
                                  prohibits their development; or too close to densely populated               fields in Yamal, Kara Sea and Barent Sea. According to our
                                  areas which immediately has the risk of strong opposition, as seen           understanding it is by no means guaranteed that production
                                  in New York, South Africa, the UK, the Netherlands, France,                  will stay level until 2020-2030,
                                  Germany, Austria and Bulgaria.
                                                                                                             • That Russian domestic demand will rise in the future in
                                  Finally it is often stated that by far the largest undeveloped               parallel to its economic development which is based on rising
                                  conventional gas reserves are in Iran and in Qatar. Their                    profits from oil exports,
                                  development and liquefaction will result in ample supply for
                                  decades. But a closer analysis shows even here huge question               • That new consumers in Asia will be able to compete for higher
                                  marks arise. Most importantly is the often ignored fact that the             prices. For instance gas pipelines from Turkmenistan – via
                                  huge reserves of both countries almost completely depend on one              Russia already an important gas exporter to Europe – will be
                                  offshore field in the Arab gulf crossing the border between the two          much fast and cheaper build to China.
                                  countries. The southern part in Qatar is called the North Field; the       Indonesia, one of the most important LNG suppliers will also see
                                  northern part in Iran is called South Pars. The size of this               strengthening supply problems in parallel to its declining oil
                                  6,000 km2 field as the world’s largest gas field was determined in         production. Around 2003 Indonesia switched from an oil net
                                  the 1970s after its discovery by only a few exploration wells. Some        exporter to a net importer. In parallel to its development the need
                                  years ago gas companies drilled a dry hole in an area which caste          for domestic gas supply will rise.
                                  huge doubts on the reserve estimate which are still used today.

                                  10
image SOLON AG PHOTOVOLTAICS FACILITY IN
ARNSTEIN OPERATING 1,500 HORIZONTAL AND
© LANGROCK/ZENIT/GP
VERTICAL SOLAR “MOVERS”. LARGEST TRACKING
SOLAR FACILITY IN THE WORLD. EACH “MOVER”
CAN BE BOUGHT AS A PRIVATE INVESTMENT FROM
THE S.A.G. SOLARSTROM AG, BAYERN, GERMANY.
1
fossil fuel resource analysis |
1.1.3 analysis of regional oversupply risks towards 2020 1.2 oil
Probably the most gas rich regions over the next two decades will 1.2.1 qualitative analysis of trends and projections
be Australia and Qatar. Their potential to increase production and
According to the Ludwig Bölkow System Analysis (LBST), it is
exports will depend on their ability to ramp up liquefaction plants
very likely that world oil production has been at peak since 2005
and export terminals.
as conventional oil production started to decline since then. Only
the inclusion of heavy oil and tars production in Canada and of
1.1.4 gas production in the EU between 1990 and 2010 natural gas liquids (NGL) production from various countries
OIL
and a projection until 2050 helped to keep total production since 2005 constant. Oil
production from tight oil supplies in the US played a minor role,
Based on the analysis the European production development
though it helped to invert the US oil production decline into a
shown in Figure 1.1 (see below) has been calculated. We can see
rise for a few years. However, due to the nature of these oil
that the EU’s own production can satisfy less than half of its
sources, we believe that the impact will be limited to a few years.
current needs. It is worth noting that the EU’s real production
volumes are even lower because imported gas is in many cases Further inclusion of so called refinery gains or processing gains
cheaper than domestic production. (volume and energy gains during the refining process by hydration
of hydrocarbons with hydrogen predominantly produced from
natural gas) and of biofuels (predominantly from Brazil, USA,
figure 1.1: gas-production 1990-2010 and projection until Europe and Indonesia) helped to still increase total production of
2050 for europe “all liquids” according to statistics from the US Energy
Information Administration (EIA) or International Energy
20,000
Agency (IEA).
18,000 LBST sees a plausible scenario in an annual decline of world oil
16,000 production of between 2-3%. This would result in roughly 50%
14,000
decline of world oil availability in 2030 with corresponding
12,000
consequences.
10,000
8,000
6,000 1.2.2 identification of potential regional short falls and
4,000 bottlenecks
2,000
PJ/a 0
The world can be split into oil importing and oil exporting
countries. Oil importing countries are vulnerable to supply deficits
1990
2000
2010
2020
2030
2040
2050
with serious impact on the country’s infrastructure, almost all
GAS-PRODUCTION 1990-2010 AND
forms of transport and – partly as a result – to the economy.
PROJECTION UNTIL 2050 FOR EUROPE Regions with adequately established urban quarters will see
EU GAS DEMAND 2013 advantages over those regions where the daily consumption
pattern highly depends on individual motorized transport.
Therefore short distances between daily destinations and well
established public transport modes will help to soften the impact
of oil scarcity considerably. This holds even more for the transport
and distribution of produced goods. Regions where the GDP
depends by a large share on the production of goods which
strongly depend on oil availability (e.g. inefficient large cars) and
on large goods with low volume specific prices will encounter
larger problems than others.
For instance, economic powerful islands like Japan or South
Korea, but also countries like USA which are used to low almost
tax exempted gasoline prices, might be hit strongest.
11ROADMAP FOR EUROPE
TOWARDS A SUSTAINABLE AND INDEPENDENT ENERGY SUPPLY
1
fossil fuel resource analysis |
1.2.3 analysis of regional oversupply risks towards 2020 1.3 hard coal
The above described situation will be mirrored by oil exporting 1.3.1 qualitative analysis of trends and projections
countries which at a first glance will not have problems with
Compared to hydrocarbons, coal reserves and resources seem to be
rising oil prices – even when the export volumes decline.
ample. However some aspects create serious doubts on this view:
Predominantly this includes the Middle East Opec countries and
Russia. However, oversupply risks cannot be identified even in • World Coal reserves have been downgraded over the last
exporting countries, except when the demand shrinks faster than decades several times and have in reality declined by some
the production capacities due to a recession. 50% since 1987;
HARD COAL
It seems likely that the downturn of world oil production will be • The static Reserve-to-Production ratio, which often is seen as a
characterised by oil price fluctuations induced by variable measure for sufficient reserves declined from 450 years in
economic prosperity whenever declining production volumes set a 1987 to less than 120 years in 2010;
ceiling for economic growth as long as this growth induces a
• Reserve reporting practice casts doubts on the relevance and
rising oil demand.
reliability of these numbers;
• Only about 10% of world coal consumption is imported
1.2.4 oil production in the EU between 1990 and 2010 from abroad;
and a projection until 2050
• The USA, China and India which together are home to more
Based on the analysis the European production development than 50% of global coal reserves are among the largest
shown has been calculated. The figure 1.2 (see below) shows the consumers. China switched from a coal exporting country to
remaining production capacities and the additional production the world’s largest coal importer with almost 200 million
capacities assuming all new projects planned for 2012 till 2020 tonnes in 2011.
will go ahead. Even with new projects, the amount of remaining
Based on this analysis it can be expected that further rising coal
conventional oil is very limited and therefore a transition towards
production probably will come to an end within the next one to
a low oil demand pattern is essential.
two decades, based on geological restrictions and not assuming
voluntary restrictions based on climate change politics.
Lignite, which is also referred to as brown coal, should be
figure 1.2: oil-production 1990-2010 and projection until considered separately. It has not been included in the LBST
2050 for europe
analysis. Due to its low energy and large water content it doesn’t
play a role in export markets. But in Germany, for example,
25,000
lignite has been playing an important role in recent years. The
shutdown of German nuclear power plants in Germany was
20,000 counteracted by rising share of renewable electricity production
in combination with rising contribution from lignite. It could be
15,000 expected that these trends continue when European gas
production declines and imported gas quantities are too small to
10,000 allow gas power plants to play the role of a bridging technology
to compensate for strong power fluctuations, according to LBST.
5,000
PJ/a 0
1990
2000
2010
2020
2030
2040
2050
OIL-PRODUCTION 1990-2010 AND
PROJECTION UNTIL 2050 FOR EUROPE
EU OIL DEMAND 2013
12image PART-MADE WIND TURBINES FOR AN
OFFSHORE WIND FARM AT MIDDELGRUNDEN,
© LANGROCK/ZENIT/GP
CLOSE TO COPENHAGEN, DENMARK
1
fossil fuel resource analysis |
1.3.2 identification of potential regional shortfalls 1.3.3 coal production in the EU between 1990 and 2010
and bottlenecks and a projection until 2050
Probably the most stressed coal supply/demand patterns are in Based on the LBST analysis the European production
Asia, predominantly China and India. Both see a steeply rising development shown in Figure 1.3 (see below) has been
demand while the domestic supply cannot keep pace, requiring calculated. As opposed to the global resource, the EU’s economic
ever larger imports. hard coal resources are in decline and during the last decade coal
has become an import fuel. Even in traditional coal mining areas
Some arguments point on missing internal infrastructure in China
such as Poland, the resource is in decline.
URANIUM
to transport domestic coal to the consumer sites. It was easier to
import coal by ship from abroad to the energy intense industrial
sites in Eastern China along the coast line. However it seems that 1.4 uranium
coal production in China more relies increasingly on three
Under the Euratom Treaty, a common nuclear market was
provinces: Inner Mongolia, Shanxi and Shaanxi.
created. Euratom established the European Supply Agency
Future Chinese import needs will determine whether other Asian (ESA) with the mandate to ensure the security of supply of
coal importers will run into trouble to satisfy their needs of large nuclear fuels to nuclear utilities in the EU. The Euratom Treaty
coal imports which predominantly come from Indonesia (steam requires the ESA to be a party to supply contracts. The ESA also
coal), Australia (largest exporter of metallurgic coal and second monitors all uranium transactions. This common market marks a
largest exporter of steam coal), South Africa (which more and formal distinction with the fossil fuel markets.
more directs its exports from Europe to Asia), Colombia (which
One of ESA’s monitoring functions is to publish an annual report
in 2011 for the first time exported coal to India) and Eastern
which gives an overview of the origins of the uranium used in the
CIS countries.
EU. Its publication from 2012 shows that the EU depends on
South Africa already faces coal supply risks and bottlenecks. 97.3% on imports with 82% of these coming from only five
Most experts assign this to transport and infrastructure countries.5 In those countries, uranium mining has had a
developments. However, it also seems that declining coal supply disruptive impact on local communities and the environment.
quality forced utilities to run their power plants with lower
In 2009, Greenpeace conducted scientific research in the area of
efficiencies as the energetic throughput of the coal was not in line
Arlit in Niger,6 exposing the environmental pollution and
with the plant layout.
radioactive contamination created by the Uranium mining. In the
streets of the local village of Akokan radiation dose rate levels
were found to be up to almost 500 times higher than normal
figure 1.3: coal-production 1990-2010 and projection background levels. A person spending less than one hour a day at
until 2050 for europe that location would be exposed to more than the maximum
allowable annual dose.
18,000
Niger has the lowest human development index on the planet. This
16,000 is in sharp contrast with the profits generated by the French state-
14,000 owned company Areva in Niger over the last 40 years through its
12,000 environmentally destructive uranium mining. Areva’s activities have
10,000 also fueled local unrest and conflicts with the Tuareg population,
8,000 thereby also threatening the supply from the area.
6,000
Uranium mining is also threatening local communities in
4,000
countries such as Canada or Australia, especially endangering the
2,000
health of indigenous peoples.
PJ/a 0
1990
2000
2010
2020
2030
2040
2050
COAL-PRODUCTION 1990-2010 AND
PROJECTION UNTIL 2050 FOR EUROPE
EU COAL DEMAND 2013
references
5 HTTP://EC.EUROPA.EU/EURATOM/AR/LAST.PDF
6 HTTP://WWW.GREENPEACE.ORG/INTERNATIONAL/EN/NEWS/BLOGS/NUCLEAR-REACTION/LEFT-IN-THE-
DUST-AREVAS-URANIUM-MINING-IN-NIG/BLOG/11734/
13ROADMAP FOR EUROPE
TOWARDS A SUSTAINABLE AND INDEPENDENT ENERGY SUPPLY
2
1.5 current supply and demand in europe Since import dependency is a function of net imports and total
fossil fuel resource analysis |
demand any drop in production would result in an increase in
The recent ‘European Energy Security Strategy’ published by the
imports. If this drop in production is faster than the decrease in
European Commission in May 2014 outlines the EU’s fossil fuel
demand, this would result in increasing import dependency
production and the state of energy security for all member states.7
against falling demand. While import dependency points to the
relative share of imports in demand (in %), the net imports –
showing the total energy deficit - denotes the absolute volumes of
1.5.1 EU primary energy production
energy that the European economy needs to import (in energy
According to the report, the EU’s primary energy production terms), that is the difference between total demand and total
decreased by almost a fifth between 1995 and 2012. In this production. Since the peak in 2006-2008, the net imports have
period natural gas production dropped by 30%, production of decreased – largely driven by fall and shift of consumption; still
CURRENT SUPPLY AND DEMAND IN EUROPE
crude oil and petroleum went down by 56% and of solid fuels net imports in 2012 were at 25% above its 1995 levels.
(including coal) by 40%. On the other hand renewable energy
production registered a remarkable growth – 9% in two years
1.5.3 great differences among member states
between 2010-2012 – and has reached a 22% share of primary
energy production. The aggregated EU-level numbers hide a great deal of differences
between Member States. In Member States with indigenous
The Netherlands and the UK are the largest producers of natural
energy production, the share of production to total demand has
gas in the EU and in 2012 respectively accounted for 43% and
decreased – in the case of the UK by half from its peak, in the
26% of gas production in the EU; the third and fourth producers
case of Denmark and Poland by 30-40% and in the case of the
– Germany and Romania – have a 7% and 6.5% share of
Netherlands by more than 15%. Estonia is the only Member
natural gas production in the EU. The UK is the largest producer
State that has seen a stable and significant increase in the share
of crude oil in the EU with a 61% share in 2012; Denmark is
of domestic production in total energy demand against a stable
the second largest producer with a 14% share.
growth in demand. As a result, the net imports of most Member
States have increased. Nowhere is this more visible than in the
1.5.2 imports and energy deficit of the EU UK, which had an energy surplus until 2003 and a steeply
growing deficit ever since. France, Spain and Italy have all seen
Despite the growth in renewable energy production, the EU has energy deficits peak in 2005 and go down ever since, likely driven
been importing growing amounts of energy to compensate for by a combination of weak demand and increased renewables
declining domestic production and meet demand that until 2006 share. The deficit of the largest energy consumers in the EU –
was steadily growing. Overall EU import dependency has Germany – has unsurprisingly been the largest in energy terms
increased, mostly driven by growth in import dependency of and since its peak in 2001 has shown fluctuations in both
natural gas (+6 p.p in the period 1995-2012) and crude oil directions, without a stable trend.
(+3 p.p. in the same period).
The EU relies on 53% of imports for its energy use. Energy
import dependency is most pronounced in relation to crude oil
(almost 90%) and natural gas (66%), and less pronounced in
relation to coal (42%) and nuclear fuel (40%). The EU spends
more than € 1 billion per day (around € 400 billion in 2013) on
energy imports.
reference
7 COMMUNICATION FROM THE COMMISSION TO THE COUNCIL AND THE EUROPEAN PARLIAMENT
EUROPEAN ENERGY SECURITY STRATEGY COM(2014) 330 FINAL}; BRUSSELS/BELGIUM 28TH MAY 2014
HTTP://EC.EUROPA.EU/ENERGY/DOC/20140528_ENERGY_SECURITY_COMMUNICATION.PDF
14energy [r]evolution: the EU energy
independence pathway for europe
ASSUMPTIONS AND METHODOLOGY KEY RESULTS OF THE ENERGY
2
[R]EVOLUTION ENERGY
INDEPENDENCE PATHWAY
2 © JEFF SCHMALTZ, MODIS RAPID RESPONSE TEAM, NASA/GSFC
“ almost
half of
europe’s energy
supply could
come from
renewables
by 2030”
image PROMINENT IN THE CENTER OF THE IMAGE ARE THE CURVING, DARK GREEN CARPATHIAN MOUNTAINS, WHICH START IN THE CZECH REPUBLIC AND CURVE TOWARD
THE SOUTHEAST INTO ROMANIA. IN CENTRAL ROMANIA, THE CARPATHIANS RUN INTO THE EASTERN END OF THE TRANSYLVANIAN ALPS, WHICH RUN HORIZONTALLY ACROSS
THE COUNTRY TO THE SERBIAN BORDER.
15ROADMAP FOR EUROPE
TOWARDS A SUSTAINABLE AND INDEPENDENT ENERGY SUPPLY
2
Moving from principles to action for ensuring energy supply that The most important assumptions were drawn from the PRIMES
the eu energy independence pathway for europe |
achieves all environmental, economic and security objectives scenario model and adjusted to the MESAP/PlaNet model which
requires a long-term perspective. Energy infrastructure takes is used for the calculation of the Energy [R]evolution scenarios.
time to build up; new energy technologies take time to develop. The results of the MESAP model in terms of energy mix, energy
Policy shifts often also need many years to take effect. Any demand developments and CO2 reduction pathways are similar to
analysis that seeks to tackle energy and environmental issues the GHG40 scenario but – due to the different modeling approach
therefore needs to look ahead at least several decades. The energy – not entirely identical.10 However, they are the closest-possible
scenarios described in the following chapter outline how this can representation of the Commission’s GHG40 scenario. Especially
be achieved. the sector specific results can differ from GHG40. In this
publication this scenario – which is used as a reference case of
Scenarios help to describe possible development paths, to give
the Energy [R]evolution – is called “COM”.
decision-makers a broad overview and indicate how far they
can shape the future energy system. Two scenarios are used
here to demonstrate two possible pathways for a future energy 2.1.2 assumptions for the energy [r]evolution scenario
supply system:
This latest edition of the Greenpeace Energy [R]evolution
• A Commission scenario (COM) reflecting the recent proposal by the scenario for the EU includes significant efforts to fully exploit the
European Commission for a 2030 climate and energy framework; large potential for energy efficiency, using currently available best
ASSUMPTIONS AND METHODOLOGY
practice technology. At the same time, all cost-effective
• An updated high efficiency Energy [R]evolution scenario
renewable energy sources are used for heat and electricity
(E[R]) reflecting Greenpeace’s demands for a 2030 climate
generation as well as the production of biofuels.11
and energy targets, including steep cuts in energy-related
carbon emissions to achieve a 95% reduction by 2050, as well In the transport sector, energy demand decreases due to a change
as a complete phase-out of nuclear power. in driving patterns and a rapid uptake of efficient combustion
vehicles and increasing use of electric and plug-in hybrid vehicles
after 2025. The use of biofuels for private vehicles follows the
2.1 assumptions and methodology
latest scientific reports that indicate that biofuels might have
The scenarios in this report were commissioned by Greenpeace higher a greenhouse emission footprint than fossil fuels.
from the Systems Analysis group of the Institute of Technical
The Energy [R]evolution scenario also foresees a shift in the use
Thermodynamics, part of the German Aerospace Center (DLR).
of renewables from power to heat, thanks to the enormous and
The supply scenarios were calculated using the MESAP/PlaNet
diverse potential for renewable power. Assumptions for the heating
simulation model adopted in the previous Energy [R]evolution
sector include a fast expansion of the use of district heat and
studies.8 The future development pathway for car technologies is
more electricity for process heat in the industry sector. The use of
based on a special report produced in 2012 by the Institute of
geothermal heat pumps leads to an increasing overall electricity
Vehicle Concepts, DLR for Greenpeace International.
demand, in combination with a larger share of electric cars in
transport. A faster expansion of solar and geothermal heating
2.1.1 assumptions for the commission scenario (COM) systems is also assumed. Hydrogen generated by electrolysis and
used as a reference scenario renewable electricity serves as third renewable fuel in the
This scenario was calculated on the basis of data published by the transport sector after 2025, complementary to biofuels and direct
European Commission in the Impact Assessment accompanying use of renewable electricity. Hydrogen generation can have high
its Communication on 2030 climate and energy targets.9 energy losses, however the limited potentials of biofuels and
It broadly reflects the Commission’s “GHG40” scenario within probably also battery electric mobility makes it necessary to have
that Impact Assessment, which presents the numbers underlying a third renewable option. Alternatively, this renewable hydrogen
the Commission’s 2030 proposal. could be converted into synthetic methane or liquid fuels
depending on economic benefits (storage costs vs. additional
losses) and technology and market development in the transport
sector (combustion engines vs. fuel cells).
references
8 ‘ENERGY [R]EVOLUTION: A SUSTAINABLE WORLD ENERGY OUTLOOK’, GREENPEACE INTERNATIONAL,
2007 AND 2008.
9 HTTP://EUR-LEX.EUROPA.EU/LEGAL-CONTENT/EN/TXT/PDF/?URI=CELEX:52014SC0015&FROM=EN
10 UNDER GHG40, THE EU’S PRIMARY ENERGY CONSUMPTION (WITHOUT NON-ENERGY USES) IN 2030 IS
1413 MTOE, THE SHARE OF RENEWABLE ENERGY IN FINAL ENERGY CONSUMPTION IS 24.8%. UNDER
COM, PRIMARY ENERGY CONSUMPTION IS 1436 MTOE, THE SHARE OF RENEWABLE ENERGY IS 26.5%.
11 A LOWER RATE OF ENERGY SAVINGS WOULD OBVIOUSLY REQUIRE LARGER PRODUCTION OF
RENEWABLE ENERGY IN ORDER FOR THE EU TO CONTRIBUTE ITS FAIR SHARE OF GLOBAL EMISSION
REDUCTIONS. SEE THE ANNEX FOR A SCENARIO BASED ON HIGHER ENERGY DEMAND AND THEREFORE
A HIGHER EXPANSION OF RENEWABLE TECHNOLOGIES.
16image COWS FROM A FARM WITH A BIOGAS PLANT
IN ITTIGEN BERN, SWITZERLAND. THE FARMER
© GP/EX-PRESS/M. FORTE
PETER WYSS PRODUCES ON HIS FARM WITH A
BIOGAS PLANT, GREEN ELECTRICITY WITH DUNG
FROM COWS, LIQUID MANURE AND WASTE FROM
FOOD PRODUCTION.
2
In all sectors, the latest market development projections of the population development Future population development is an
the eu energy independence pathway for europe |
renewable energy industry12 have been taken into account. The important factor in energy scenario building because population
fast introduction of electric vehicles, combined with the size affects the size and composition of energy demand, directly
implementation of smart grids and fast expansion of super grids and through its impact on economic growth and development.
allows a high share of fluctuating renewable power generation
economic growth Economic growth is a key driver for energy
(photovoltaic and wind) to be employed.
demand. Since 1971, each 1% increase in global Gross Domestic
The efficiency pathway of this latest Energy [R]evolution scenario Product (GDP) has been accompanied by a 0.6% increase in
is based on research from the Fraunhofer Institute for Systems primary energy consumption. The decoupling of energy demand
and Innovation Research (Fraunhofer ISI) published in 2013.13 and GDP growth is therefore a prerequisite for an energy
According to the study, the EU has a 41% cost-effective end-use revolution. Most global energy/economic/environmental models
energy savings potential for 2030. By tapping this potential, the constructed in the past have relied on market exchange rates to
EU would, by 2030, reap the wide-ranging economic, social and place countries in a common currency for estimation and
financial benefits of energy savings, including: calibration. This approach has been the subject of considerable
discussion in recent years, and an alternative has been proposed
• Reducing greenhouse gas (GHG) emissions by between 49-
in the form of purchasing power parity (PPP) exchange rates.
61% compared to 1990 levels, enabling the EU to step up its
Purchasing power parities compare the costs in different
fight against climate change and to keep on track for its 2050
currencies of a fixed basket of traded and non-traded goods and
ASSUMPTIONS AND METHODOLOGY
climate change target of a GHG reduction of 80-95%
services and yield a widely-based measure of the standard of
compared to 1990 levels.
living. This is important in analyzing the main drivers of energy
• Boosting its competitiveness through lower energy costs, demand or for comparing energy intensities among countries.
increased industrial efficiency and a stronger demand for
Prospects for GDP growth have decreased considerably since the
domestic products and services. Households and industry would
previous study, due to the financial crisis at the beginning of
receive net benefits of € 240 billion annually by 2030 and of
2009, although underlying growth trends continue much the
about € 500 billion by 2050 in lower energy bills.
same. GDP growth of the EU has been down scaled from 1.8%
The study concludes that a ‘GHG target’ only approach to 2030 between 2010 and 2050 to 1.1%. GDP projections are based on
would fail to stimulate additional energy savings and neglect an the PRIMES model for the EU 28 and assume a growth by
important opportunity to curb energy waste and excessive around 0.6% between 2010 and 2020 and 1.2% between 2020
spending on energy imports. and 2035.
Compared to the EU27 Energy [R]evolution scenario published
in 2012, higher assumptions for energy savings imply a lower
expansion of renewable energy but achieve a higher level of CO2
emission reductions.
table 2.1: population development in the EU 28 table 2.2: GDP development projections in the EU 28
2010 - 2050 (IN MILLIONS) 2010 - 2050
2010 2015 2020 2025 2030 2040 2050 2010-2020 2020-2035 2035-2050 2010-2050
EU 28 505 511 515 518 520 519 515 EU 28 0.6% 1.2% 1.2% 1.1%
source UNEP WORLD POPULATION PROSPECT 2010. source IEA WORLD ENERGY OUTLOOK 2011.
references
12 SEE EREC, RE-THINKING 2050, GWEC, EPIA ET AL.
13 HTTP://ENERGYCOALITION.EU/SITES/DEFAULT/FILES/FRAUNHOFER%20ISI_
REFERENCETARGETSYSTEMREPORT.PDF
17You can also read