ROBUST GROWTH DELIVERED IN FIRST YEAR OF TRADING AS A PUBLIC COMPANY - FULL YEAR RESULTS TO 31 AUGUST 2016 - MCCARTHY & STONE PLC
←
→
Page content transcription
If your browser does not render page correctly, please read the page content below

Robust growth delivered
in first year of trading as a public company

                 Full year results to 31 August 2016
02 Agenda § Chairman’s introduction John White § Key highlights and current trading Clive Fenton § Financial results Nick Maddock & Rowan Baker § Strategic update and progress with strategic initiatives Clive Fenton § Current trading and outlook Clive Fenton
Chairman’s
introduction
       John White
       Chairman

               Heritage Place, Ickenham,
               Assisted Living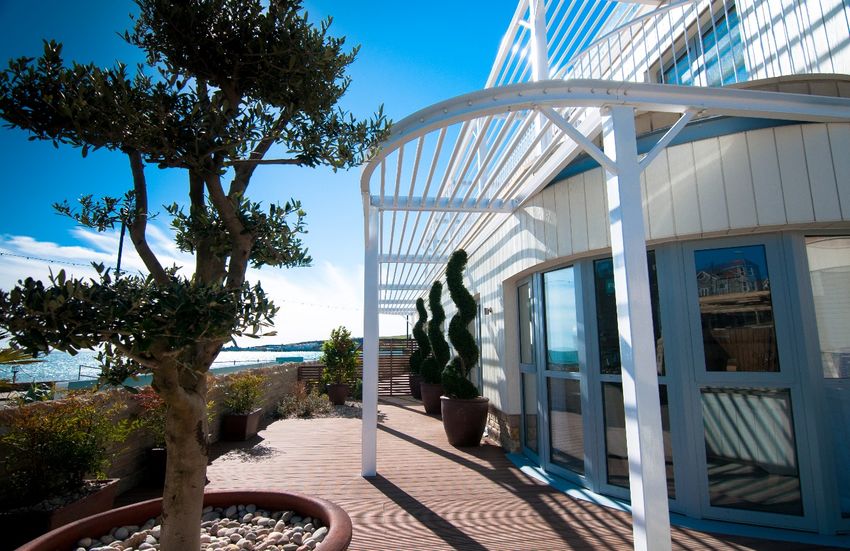
04 Chairman’s introduction § Successful IPO in November 2015 § Record year for revenue § 19% increase in underlying profit before tax § Proposing a final dividend of 3.5p per share, making the total dividend for the year 4.5p per share § Flexibility and resilience shown in response to market uncertainty
Key highlights and
current trading
       Clive Fenton
       Chief Executive Officer

                Wardington Court, Northampton,
                Assisted Living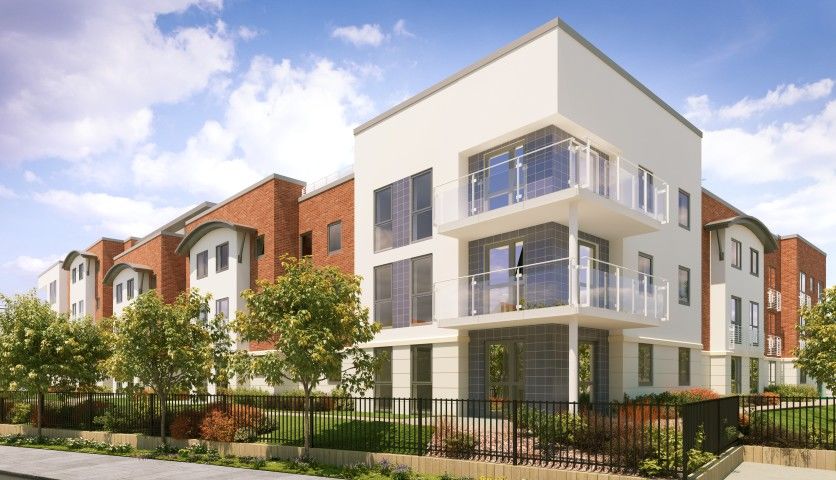
06

Robust growth delivered
in first year of trading as a public company
    Legal                                Net ASP     Revenue   Underlying   Net Cash   EPS2
 completions1                                                    PBT

   +20%                                  +8%         +31%      +19% +£97m              +9%

         2,299                               £259k   £635.9m    £105.0m      £52.8m    16.1p

1. Includes 3 commercial units
2. Adjusted underlying basic earnings per share
07
Market conditions in FY16
§ Net reservations ahead of prior year Q1-Q3 Net reservations per week FY15
50
(+21%) but sharply lower in Q4 (-22%) 45
FY16
§ Significant slowing of secondary housing market 40
35
evident immediately post Brexit 30
§ High cancellation rates immediately post Brexit 25
20
§ McCarthy & Stone customers do not benefit from 15
Help to Buy 10
5
0
Q1-3 June/July August
Q1-3 June/July August
cancellation rate cancellation rate cancellation rate
19% 44% 30%
08
What actions did we take?
Impact
§ Mitigated possible further downside by § Reduction in margin on Q4 legal
monetising existing reservations completions
§ Additional caution in relation to land, § Delayed land and build spend and
build and other spend additional abortive land costs
§ Cash conservation prioritised § Robust year end net cash balance of
£52.8m (FY15: £44.4m net debt)
…demonstrating that we are able to respond quickly and flexibly
to preserve our financial strength
when external market conditions require
09

Current trading

YTD improvement versus FY16                                                 Forward order progress in net revenue (incl. YTD completions)
                                                                                           31 August                                  11 October                       12 November
                                                                                                                                                                                   £250m
                                                                                                                                                              250    £241m
                                                                              250                                        250

Sales leads                   +13%                                            200                                        200
                                                                                                                                  £177m          £173m
                                                                                                                                                              200

                              +14%
                                                                                                                                                              150
Visitors                                                                      150
                                                                                        £131m
                                                                                                       £114m
                                                                                                                         150

                                                                              100                                        100                                  100

Net
reservations                  +13%                                             50
                                                                                      Prior year    Current year
                                                                                                                          50
                                                                                                                                 Prior year    Current year
                                                                                                                                                               50
                                                                                                                                                                    Prior year   Current year

                                                                                    Better sales progress to close gap in forward order book

Forward order book as at 31 August 2016 and 11 October 2016 included revenue after cash discounts, PX top-ups and other incentives.
Forward order book as at 12 November 2016 included revenue after cash discounts and PX top-ups. Other incentives amounted to £5m (FY15 £3m).
10

Current trading: pricing and incentives
Incentives as a percentage of list price

14%
                                                            At completion                                           At reservation
         13%
                        Incentives %         14%                                                     14%
12%                   constant despite
                      impact of Brexit       12%                                                     12%
10%
                                             10%                                                     10%
8%              7%                                                   8%
                      6%           6%         8%                                                     8%                      7%
6%                                                                                 6%
                                              6%       5%                                            6%
4%                                                                                                             4%                          4%
                                              4%                                                     4%
2%
                                              2%                                                     2%
0%
        FY13   FY14   FY15        FY16        0%                                                     0%
                                                   Q1-3 FY16      Q4 FY16      Wk 1-10 FY17                 Q1-3 FY16       Q4 FY16    Wk 1-10 FY17
                                                   completions   completions    completions                reservations   reservations reservations

Completions and forward sales net ASP
          Net ASP            FY16 (full year) £259k     FY17 (week 10) £273k                  + 5%

      Additional incentives in Q4 FY16 to close out chains
                Back to pre-Brexit levels in FY17
11
Current trading: workflow
FY16 Sep/Oct FY17 Sep/Oct
(sites) (sites)
Land Exchanges 1 4 Delivers growth beyond FY19
Planning Consents 4 10 Delivers growth to FY19
Build Starts 4 6 Delivers growth to FY18
Sales Releases 10 13
Delivers FY17 sales
First Occupations 1 2
Continuing to invest cautiously
in the right opportunities12
Outlook for FY17
§ Second hand market transaction levels stabilising, but at a low base
Land bank and
§ Buyers lacking Help to Buy support operational
§ Low demand from investors to facilitate unlocking of chains capability in
place to build
§ Continued caution on investment decisions – renegotiating land and sell more
deals where possible than 3,000 units
per annum
§ Land environment remains benign
Continue to
§ Build cost inflation expected to continue into FY17 target 25% ROCE
over medium
§ FY17 growth likely to be muted with particular impact on H1 due to term
lower forward order book and mix brought into year
§ Continued focus on careful cash management
§ Demand and demographic opportunity remains strong – McCarthy
& Stone uniquely placed to capitalise on this over longer termFinancial
results
Nick Maddock, Chief Financial Officer &
Rowan Baker, Group Financial Controller
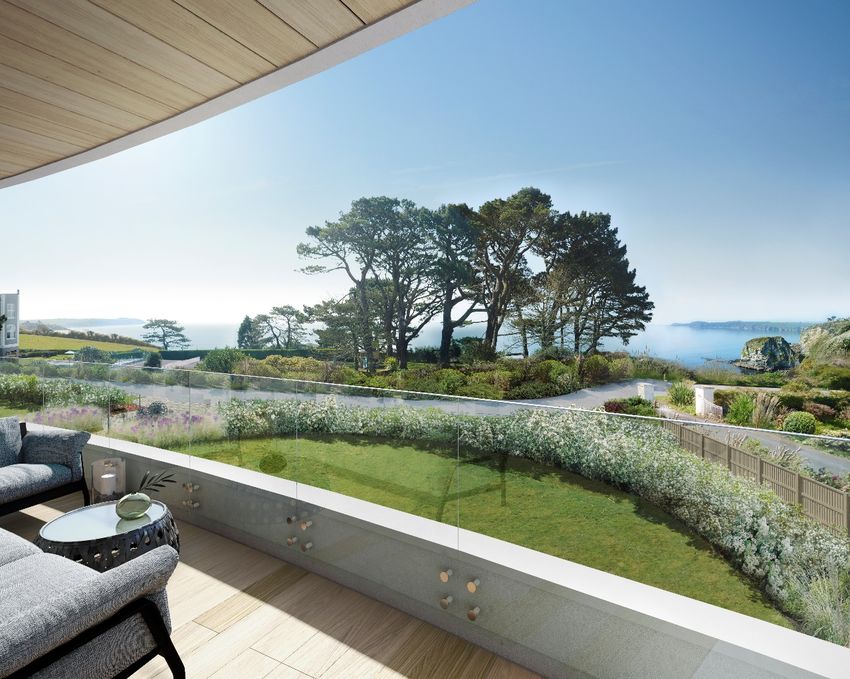
Ocean House, Carlyon Bay,
Ortus Homes14
Financial performance over past 4 years
Legal completions (units) Revenue Net ASP Underlying operating profit
2,299
£259k £107m
£636m
£239k £95m
1,923 £214k
£486m £75m
1,677 £184k
1,527 £388m
£311m £45m
FY13 FY14 FY15 FY16 FY13 FY14 FY15 FY16 FY13 FY14 FY15 FY16 FY13 FY14 FY15 FY16
Strong growth trajectory15
Financial performance over past 4 years
(continued)
Underlying PBT Capital turn Net cash/(debt) ROCE%
£53m 20% 20%
£105m 1.2x
£88m 17%
1.0x
£63m 0.9x
0.8x 12%
£21m
£(44)m
£(49)m
£(63)m
FY13 FY14 FY15 FY16 FY13 FY14 FY15 FY16 FY13 FY14 FY15 FY16 FY13 FY14 FY15 FY16
Strong balance sheet and improved capital discipline
supporting delivery of strategic targets16
Headline FY16 results
1. Underlying operating profit (including underlying
Key financial metrics FY15 FY16 Change operating profit margin and underlying basic
earnings per share) and underlying profit before
tax are calculated by adding amortisation of brand
Revenue £485.7m £635.9m +31% and exceptional administrative expenses to
operating profit and profit before tax respectively
Legal completions 1,923 2,299* +20% 2. Gearing is calculated by dividing net debt by net
assets
Net average selling price £239k £259k +8% 3. Return on capital employed (ROCE) is calculated
by dividing underlying operating profit for the
Underlying operating profit £95.3m £107.2m +12% previous 12 months by the average tangible gross
asset value at the beginning and end of the 12
Underlying operating profit margin 20% 17% -3ppt month period. Tangible gross asset value is
calculated as net assets excluding goodwill and
intangible assets, excluding net (debt)/cash
Underlying profit before tax1 £88.4m £105.0m +19%
* Includes three commercial units
Return on capital employed3 (ROCE) 20% 20% -
Net (debt)/cash £(44.4)m £52.8m +£97.2m
Gearing2 8% -8% +16ppt
Capital turn 1.0x 1.2x +0.2x
Tangible gross asset value (TGAV) £513.5m £574.1m +12%17
Financial performance:
Underlying operating profit bridge
140.0
6.8
120.0 9.0
1.4 0.7
28.4
100.0
80.0
60.0
107.2
95.3
40.0
20.0
0.0
FY15 operating Volume growth Additional Additional Q4 Additional Other FY16 operating
profit operating incentives abortive land profit
investment costs18
Financial performance:
ROCE bridge
24.0%
22.0% 1.9% 1.1%
0.1% 1.5%
0.7%
20.0%
0.2%
18.0%
16.0%
20.7%
19.8% 19.7%
14.0%
12.0%
10.0%
FY15 Capital turn Additional Other Additional Q4 Additional Investment delay FY16
ROCE% operating incentives abortive land ROCE%
investment costs19
Financial performance:
Exceptional items, tax and financing
Exceptional items
§ £10m of exceptional items incurred in FY16, of which:
§ £8.5m relate to IPO advisor fees and other related costs
§ £1.5m relate to Management Incentive Plan charges, other restructuring,
redundancy and refinancing costs
Tax
§ Effective tax rate for the year of 20.9% (FY15: 20.5%)
§ We expect the effective tax rate in future years to reflect the statutory rate
Financing
§ £200m revolving credit facility renegotiated during the year
§ Improved commercial terms
§ Extension until 202120 Other financial highlights § Disciplined cash management resulting in year end net cash of £52.8m (FY15: £44.4m net debt) § Total operating expenses tightly controlled at 5% of revenue (FY15: 7%) § Finance expense reduced to £4.9m (FY15: £8.1m) § Maintained strong balance sheet in support of growth plans
Strategic update and progress
with strategic initiatives
                   Clive Fenton
                   Chief Executive Officer

              Shore House, Swanage,
              Ortus
22
Our strategic growth plan
Quality Operational
Land bank capability
at attractive in place
margins
Demand & Delivering
demographic 3,000
opportunity completions
Robust capital Market-leading
structure brand23
Demand driven by strong fundamentals
UK population: 64.6m people
Of which: 14.9m > 60 years old
Of which: 4.4m with total household wealth
between £250k and £500k
Of which: 3.7m living alone / with spouse
Which is equivalent to 2.6m households
Of which: 0.9m households are in
the ‘sweet spot’ aged over 75
Compares with 141k1 owner occupied
retirement properties in UK
Source: ONS, YouGov, Knight Frank
1. Independent data provided by EAC, April 201624
Capital structure: We have
the investment capability
Target:
£2.5bn investment over 4 years from FY16
c.£500m invested in FY16
Similar levels of investment expected in FY17
Financed through sales revenue with seasonal
working capital supported by revolving credit facility
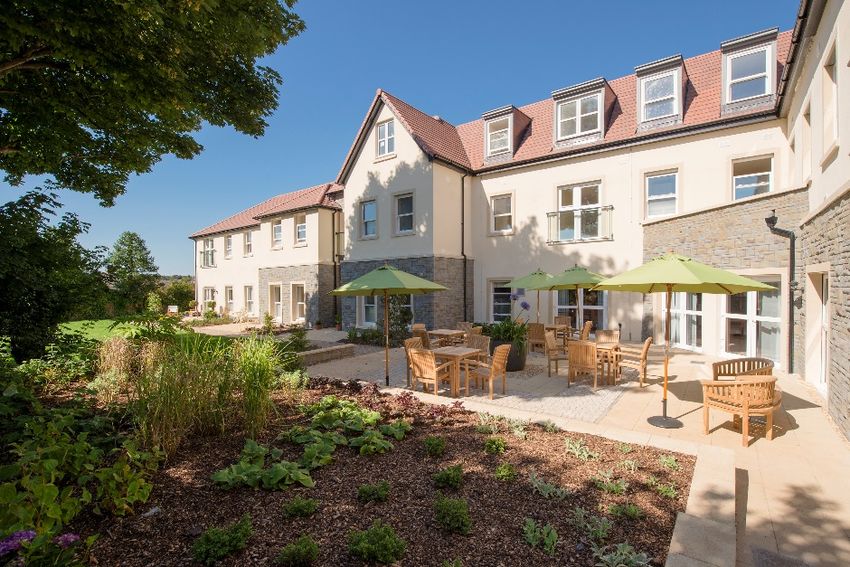
William Page Court, Bristol, Retirement Living25
Land: Quality land bank in place
Land bank provides strong visibility over 100%
medium-term volume, sales and profit and 90%
80%
underpins future expected growth: 70%
§ Current land bank of 10,186 units represents 60%
50%
4.4 years of supply, of which 2.5 years with 40%
detailed planning consent 30%
20%
§ All FY17 targeted sales currently in build or 10%
in stock 0%
FY17 FY18 FY19
§ Sufficient land with detailed planning consent Finished stock Work in progress
to meet FY18 sales targets With planning awaiting build start Exchanged awaiting planning
§ Sufficient land under control to meet sales
targets in FY1926
Capability
Organisational
platform now 1. Glasgow (Scotland)
in place 2. Altrincham (North West) (New)
3. York (North East)
4. Coventry (West Midlands)
5. Kettering (East Midlands) (New)
6. Hatfield (North London)
7. Woking (South East)
8. Ringwood (Southern)
9. Bournemouth (Corporate centre)
High quality, experienced
management teams all in place 10. Taunton (South West) (New)
All regions profitable in FY1627 Market-leading brand § Only national retirement housebuilder § Focused entirely on retirement housing § Clear market leader with c.70% market share of the owner- occupied market1 § Three products spanning the full retirement age range § Brand strength supported by in-house management services § 5 star HBF customer satisfaction rating for 11 consecutive years § Two successes at annual Housebuilder Awards 2016 (Best Retirement Scheme and Customer Satisfaction Initiative) 1. Based on 3,453 registrations of cross-tenure properties specifically designed for the elderly with the NHBC during calendar year 2015, of which 2,672 were registered by McCarthy and Stone
28

Review of operations –
Focus on operational efficiency
Significant management effort continues to be placed
on accelerating the working capital cycle through
3 strategic initiatives

1. Sales initiative: increase in proportion of units
   sold off-plan and reduced time to sell out

2. Development initiative: reduce the time taken
   between securing land and starting on site

3. Build initiative: accelerating timescales and       Blyton House, Bourne End,
   reducing build costs                                Retirement Living

  Improved capital turn in FY16 to 1.2x (FY15: 1.0x)
29
Review of operations – Sales initiative
§ Objective: to deliver off-plan Region Off-plan
reservations of 50% for each reservations
of our developments Kingswood Court, Sidcup SE 100%
Blyton House, Bourne End NL 100%
§ Average of 50% off-plan
Companions Court, Wickerlsey NE 92%
reservation rate achieved in
Lawrence Place, Maldon NL 86%
FY16
Bewick Grange, Harrogate NE 85%
Constance Place, Knebworth NL 85%
Hillier Court, Romsey SO 83%
Orchid Court, Lytham St Annes NW 83%
Sovereign Place, Loughton NL 82%
Two sites have achieved
100% reservations off-plan Valley Court, Holcombe Brook NW 82%
Carrick Court, Drayton SE 81%
Total of 11 sites have
exceeded 80%30
Review of operations – Sales initiative
(continued)
§ Objective: to sell out within Average months to sell out
(sold out sites in year)
average of 12 months
§ Significant further reduction 40.0 38
53% reduction
in the average time to sell 35.0
31
out in FY16 30.0
25.0
20.0 18
12 month
15.0 target
10.0
5.0
0.0
FY14 FY15 FY1631
Review of operations – Sales initiative
(continued)
§ New sales toolkits implemented to support the sales force
§ New national sales training programme in progress
§ Clearer definition of our best prospects developed to
assist focus of local marketing
§ More consistent customer approach supported by a new
partnership with a third party contact centre and the
introduction of a new online visitor booking system
§ Developed web platform to improve web traffic and
customer experience
Justice Court, Cromer,
Retirement Living32
Review of operations – Development initiative
Target 16 months for standard sites
with first time planning consents
§ Objective: to reduce time
between land exchange and FY14 Build Average c.25
Starts* months
build start on standard sites
to 16 months FY15 Build Average c.23
Starts* months
§ Delivery underpinned by a
streamlined and simplified FY16 Build Average c.19
development process from Starts* months
land evaluation through to Land
exchange
to
planning
c onsent Planning
Consent
to
Land
Completion
construction Land
Completion
to
Site
Start Site
Start
to
Build
Start
Significant improvement in time between land exchange and build start,
reduced to an average of c.19 months in FY16
Sites fully developed under development initiative
already delivering against target of 16 months
* Excluding sites put on hold during last recession and sites put on hold for either commercial or complex planning reasons33 Review of operations – Development initiative (continued) § Introduced an information management system § Process and technical innovation to increase the consistency of information from product development through to management services § Ensures a consistent and standardised high quality product § Enables our teams and partners to work more effectively together throughout the development’s lifecycle
34
Review of operations –
Build initiative
§ Structured approach to subcontractor partnerships
§ Site specific value engineering
§ Commercial controls – ‘ways of working’
§ Cost management – streamlined cost coding, improved
reporting and benchmarking
Coppice Gate, Dibden Purlieu, Retirement Living35
Review of operations –
Build initiative (continued)
Build programme and commercial controls
§ c.£55m of material spend addressed by procurement team,
returning savings to the value of £3.3m in relation to
materials used, including more than double the amount of
rebates collected in prior year
§ Increasingly adopting modern methods of construction (c.
25% of sites under construction in FY17) to further reduce
build times
§ An additional c.£12m of cost reductions have also been
identified, which are expected to benefit the Group over the
next four years
Average build time on FY16 first occupations reduced
by c.3 weeks compared to FY15 first occupations
Apprentice Assistant Site Manager – North London36 Summary § Robust growth delivered in FY16 § Fast response to Brexit – demonstrating business flexibility and resilience § Recent improvement in reservation rates provides encouraging signs of market stabilisation § We will continue to invest in our regions and infrastructure as market conditions allow in order to deliver our planned growth § Land bank and operational capability in place to build and sell more than 3,000 units per annum § Continue to target 25% ROCE over medium term
Conclusion

      John White
      Chairman

             Francis Court, Worcester,
             Retirement Living
Questions?
39

Future investor communications

25 Jan 2017 – Trading update and AGM

28 Feb 2017 – Half year close

7 March 2017 – Half year trading update announcement

5 April 2017 – Half year results announcement

31 August 2017 – Financial year end
Appendices

Horizons, Poole,
Assisted Living
41

Financial
                                                                                                                                                             2016      2015
                                                                                                                                                              £m         £m

statements:
                                                                           Continuing operations
                                                                           Revenue                                                                          635.9     485.7
                                                                           Cost of sales                                                                   (499.5)   (362.6)

Statement of                                                               Gross profit
                                                                           Other operating income
                                                                                                                                                            136.4
                                                                                                                                                              8.5
                                                                                                                                                                      123.1
                                                                                                                                                                        9.1

comprehensive
                                                                           Administrative expenses                                                          (44.7)    (39.9)
                                                                           Other operating expenses                                                          (5.1)     (4.5)

income
                                                                           Operating profit                                                                  95.1      87.8
                                                                           Amortisation                                                                      (2.1)     (2.1)
                                                                           Exceptional administrative expenses                                              (10.0)     (5.4)
                                                                           Underlying operating profit1                                                     107.2      95.3
For the year ended                                                         Finance income                                                                     2.7       1.2

31st August 2016                                                           Finance expense                                                                   (4.9)     (8.1)
                                                                           Profit before tax                                                                 92.9      80.9
                                                                           Underlying profit before      tax1                                               105.0      88.4
                                                                           Income tax expense                                                               (19.4)    (16.6)
                                                                           Profit for the year from continuing operations and total comprehensive income     73.5      64.3
                                                                           Profit attributable to:
                                                                           Owners of the Company                                                             73.1      64.1
                                                                           Non-controlling interest                                                           0.4       0.2
                                                                                                                                                             73.5      64.3

1. Underlying operating profit (including underlying operating profit margin and underlying basic earnings per share) and underlying profit before tax
   are calculated by adding amortisation of brand and exceptional administrative expenses to operating profit and profit before tax respectively.
42
Financial
2016 2015
£m £m
Assets
statements:
Non-current assets
Goodwill 41.7 41.7
Intangible assets 29.6 31.7
Statement of
Property, plant & equipment 2.9 2.6
Investments in joint ventures 0.4 0.4
Investment in properties 0.2 0.5
financial
Trade and other receivables 32.7 31.5
Derivative financial assets - 0.3
Total non-current assets 107.5 108.7
Current assets
position Inventories
Trade and other receivables
Cash and cash equivalents
685.8
7.5
119.0
585.8
10.9
56.9
Total current assets 812.3 653.6
Total assets 919.8 762.3
As at 31st August 2016 Equity and liabilities
Capital and reserves
Share capital 43.0 381.1
Share premium 100.8 56.4
Retained earnings 553.5 104.3
Equity attributable to owners of the Company 697.3 541.8
Non-controlling interests 0.8 0.7
Total equity 698.1 542.5
Current liabilities
Trade and other payables 107.1 83.8
Short-term payables 11.3 -
Land payables 49.3 36.5
Total current liabilities 167.7 120.3
Non-current liabilities
Long-term borrowings 52.5 99.2
Deferred tax liability 1.5 0.3
Total liabilities 221.7 219.8
Total equity and liabilities 919.8 762.343
Financial
2016 2015
£m £m
statements:
Net cash inflow from operating activities 18.3 19.7
Investing activities
Consolidated
Purchases of property, plant and equipment (1.5) (2.0)
Purchases of intangible assets (0.4) (1.0)
cash flow Proceeds from sales of property, plant and equipment
Net cash used in investing activities
0.1
(1.8)
1.5
(1.5)
statement Financing activities
Proceeds from issue of share capital 86.0 -
Proceeds from long-term borrowings - 87.9
For the year ended Repayment of long-term borrowings (35.0) (160.0)
31st August 2016 Purchase of interest rate cap - (0.3)
Dividend paid (5.4) -
Net cash from/(used in) financing activities 45.6 (72.4)
Net increase/(decrease) in cash and cash equivalents 62.1 (54.2)
Cash and cash equivalents at beginning of year 56.9 111.1
Cash and cash equivalents at end of year 119.0 56.944
Our products
Retirement Living Assisted Living Ortus Homes
Independence with peace of mind A retirement apartment you own Downsize for the leisure years
with flexible care and support
Minimum age 60 Minimum age 70 Minimum age 55
Average age 79 Average age 83 Average age 73
Typical number of apartments per site 30-50 Typical number of apartments per site 40-60 Typical number of apartments per site 20-40
FY16 completions 1.511 FY16 completions 697 FY16 completions 88
FY16 % Land Bank 62% FY16 % Land Bank 30% FY16 % Land Bank 8%
Pavilion Court, Heritage Place, Azaleas,
Felixtowe, Ickenham, Poole,
Retirement Living Assisted Living Ortus Homes
Three core products delivered to the same
Source: Annual Report outstanding quality and target return metrics45
Our competitive positioning
Limited competitive threat
Ortus Homes Retirement Living Assisted Living Residential
Generalist full-time
housebuilder Late middle-age living For the physically For those in need of Nursing/
for the fully independent independent increased support Care Homes
Lack intellectual Fundamentally
capital and appetite different business
model
Retirement village Other retirement Rental
market housebuilders market
Not prevalent in the UK Lack scale, national UK predominantly an
coverage and more limited owner-occupied market
access to financing46
Demonstrable barriers to entry
Previously entered Currently operating in
Custo retirement housing retirement housing
mers
market1 market1
ü O
O O
O O1
Constr
Sales
process
ü O
uction
O O
ü O
O O
nt
Land na geme
Ma vices ü O
Ser
1. Previous entry or current entry refers to significant retirement housing operations47 Shrinking the working capital cycle
48 Dividend policy § Progressive dividend policy targeting an initial payout of c.30% of profit after tax excluding certain exceptional items § Company expects to pay an interim dividend and a final dividend in respect of each financial year in the approximate proportions of one-third and two-thirds, respectively, of the total annual dividend § The first interim dividend of 1.0p was pro rata from Admission to 29 February 2016 and was paid in Q3 FY16
49

Disclaimer

THIS DOCUMENT IS BEING MADE AVAILABLE TO THE RECIPIENT ONLY ON A STRICTLY CONFIDENTIAL BASIS. THIS DOCUMENT AND ITS CONTENTS
MAY NOT BE DISTRIBUTED TO ANY OTHER PERSON, REPRODUCED, PUBLISHED OR USED IN WHOLE OR IN PART FOR ANY OTHER PURPOSE.

The information in this document, which does not purport to be comprehensive, is for information only and has not been independently verified by McCarthy &
Stone plc or any other person. Neither McCarthy & Stone plc, its affiliates or any of their respective directors, officers, employees, advisers or agents accepts any
responsibility or liability whatsoever for/or makes any representation or warranty, express or implied, as to, and no reliance should be placed on, the fairness,
accuracy, completeness or correctness of this information or opinions contained herein or for any loss howsoever arising from any use of this document or its
contents. In particular, but without prejudice to the generality of the foregoing, no representation or warranty is given as to the achievement or reasonableness of
any future strategy, projections, targets, estimates or forecasts contained in this document.

Certain statements contained in this document are, or may be deemed to be, statements of future plans, targets and expectations and other forward looking
statements that are based on management‘s current intentions, beliefs, expectations and assumptions and involve known and unknown risks and uncertainties
that could cause actual results, performance or events to differ materially from those expressed or implied in such statements. Forward-looking statements are not
guarantees of future performance and the actual results of operations, financial condition and liquidity, and the development of the industry in which McCarthy &
Stone plc operates, may differ materially from those made in or suggested by the forward-looking statements set out in this document. As a result, you are
cautioned not to place any undue reliance on such forward-looking statements.

To the extent available, the industry and market data contained in this document has come from official or third party sources. There is no guarantee of the
accuracy or completeness of such data. In addition, certain of the industry and market data comes from McCarthy & Stone plc’s own internal research and
estimates. While McCarthy & Stone plc believes that such research and estimates are reasonable, they, and their underlying methodology and assumptions, have
not been verified by any independent source. Accordingly, undue reliance should not be placed on any of the industry or market data contained in this document.

The information and opinions in this document (including forward-looking statements) are provided as at the date of this document and are subject to change
without notice. McCarthy & Stone plc expressly disclaims any obligation to update or revise any information or opinions in this document.

This document does not constitute an offer or invitation to purchase or subscribe for any shares and neither it nor any part of it shall form the basis of or be relied
upon in connection with any contract or commitment whatsoever. Nor does this document purport to give legal, tax or financial advice.

You are not to construe the content of this presentation as investment, legal or tax advice and you should make your own evaluation of McCarthy & Stone plc and
the market. If you are in any doubt about the contents of this presentation or the action you should take, you should consult a person authorised under the
Financial Services and Markets Act 2000 (as amended) (or if you are a person outside the UK, otherwise duly qualified in your jurisdiction).
You can also read