Room air constituent concentrations from use of electronic nicotine delivery systems and cigarettes using different ventilation conditions - Nature
←
→
Page content transcription
If your browser does not render page correctly, please read the page content below
www.nature.com/scientificreports
OPEN Room air constituent
concentrations from use
of electronic nicotine delivery
systems and cigarettes using
different ventilation conditions
Michael J. Oldham*, Anil Sehgal, Gal Cohen, Joey Chen, Blair Evans & Daniel Heraldez
To assess potential exposure of non-users to exhaled constituents from pod and cartridge electronic
nicotine delivery systems (ENDS) products, an environmental clinical study was conducted with
(n = 43) healthy adult smokers. Room air concentrations of 34 selected constituents (nicotine,
propylene glycol, glycerin, 15 carbonyls, 12 volatile organic compounds, and 4 trace metals) and
particle number concentration (0.3 to 25 µm) were compared from use of two ENDS products
and conventional cigarettes using room ventilations representative of a residential, an office or a
hospitality setting over a 4-h. exposure period. Products used were JUUL ENDS, Virginia Tobacco
flavor (Group I), VUSE Solo, Original flavor (Group II) (5.0 and 4.8% nicotine by weight, respectively)
and subjects’ own conventional cigarettes (Group III). Cumulative 4-h room air sampling and particle
counting were performed during prescribed (Groups I and II) and ad libitum product use (all Groups).
Conventional cigarette use resulted in significantly more constituents detected and higher 4-h
cumulative constituent concentrations compared to use of the ENDS products tested, except for the
predominant ENDS ingredients, propylene glycol and glycerin. Use of conventional cigarettes also
resulted in greater total particle number concentration than either prescribed or ad libitum use of
either of the ENDS used in this study.
Electronic nicotine delivery systems (ENDS; also called e-cigarettes) have been gaining popularity in the United
States, especially closed system ENDS using pods or cartridges. Concern has been raised about potential expo-
sure of non-users to exhaled constituents from these E NDS1. Initial reports of room constituent concentrations
were from puffing machine generated ENDS aerosols that assumed 100% percent of what was generated was
released into room air2–5. These machine-based studies used constant puffing parameters and neglected aerosol
deposition in the respiratory tract of the user prior to some fraction being exhaled. From this initial work, two
assessment approaches of potential non-user exposure to exhaled constituents from ENDS have evolved. One
assessment approach has been to measure air constituent concentrations in locations where ENDS are or have
been used. Sampled locations include shops selling ENDS6–8 and homes where one or more occupants report
using ENDS8–10. In some cases, this assessment approach includes measuring biomarkers of exposure in saliva,
plasma or u rine11–15. The second assessment approach has used more controlled situations where ENDS users
are confined to a room with prescribed or ad libitum product u se3,4,16–23 and/or have included exhaled breath
analysis24–28. Results from both approaches are consistent in that compared to inhaled constituent concentra-
tions, low concentrations of constituents (nicotine, propylene glycol, glycerin and formaldehyde) have been
measured in exhaled b reath19,24,26,27 and in environmental sampling during prescribed or ad libitum ENDS use.
Both approaches have shown that exposure of non-users is possible, but most studies have demonstrated this
exposure is significantly less than exposure to secondhand smoke from combustible cigarettes 10,13,19,24,25,28–30. In
large part because unlike cigarettes, which generate sidestream smoke continuously between puffs, there are no
emissions from ENDS between puffs. There are also more chemicals and larger amount of chemicals (except for
glycerin and propylene glycol, primary E-vapor product ingredients) in the exhaled breath of cigarette smokers
compared to ENDS users24,25,28, which also contributes to potential exposure of non-users.
JUUL Labs, Inc., 560 20th Street, San Francisco, USA. *email: Michael.Oldham@juul.com
Scientific Reports | (2021) 11:1736 | https://doi.org/10.1038/s41598-021-80963-9 1
Vol.:(0123456789)
www.nature.com/scientificreports/
Total airflow Fresh air
Minimum air exchanges/ Minimum flow rate Minimum air Minimum flow rate
Ventilation condition hr (cubic feet/min) exchanges/h (cubic feet/min)
Residential 4.5 345 1.1 85
Office 7.5 575 1.57 121
Hospitality 15.0 1150 3.3 255
Table 1. American Society of Heating, Refrigeration and Air-Conditioning Engineers Inc. ventilation
standards.
Although potential differences have been identified between types of E NDS19 (cig-a-like vs. tanks), few if any
of these studies have quantified the potential non-product user exposure using popular pod- or cartridge-based
ENDS, especially JUUL ENDS. Additionally, when subjects have been confined within a room, all previous stud-
ies have utilized only a single room ventilation rate, which has limited extrapolation of the results. Therefore, we
conducted an environmental clinical study comparing room air concentrations of selected constituents from
smokers using a JUUL ENDS containing 5.0% nicotine by weight, VUSE Solo ENDS containing 4.8% nicotine
by weight or conventional cigarettes (participants usual brand) using three different room ventilations rates that
are representative of a residential, an office or a hospitality setting. The three different ventilation conditions
were anticipated to result in a range of concentrations producing a dose response for the measured constituents
because different amounts of fresh air that were used. The different ventilation rates and amounts of fresh air
used were consistent with standards by the American Society of Heating, Refrigeration and Air-Conditioning
Engineers Inc31. for living spaces (Table 1; approximately 30% less for the office and approximately 67% less for
the hospitality ventilation conditions compared to the residential ventilation condition).
Results
Study participants. A total of 43 study participants (25 males and 18 females) were enrolled. The mean
age was 43.8 years and ranged from 24 to 63 years. The mean number of reported cigarettes smoked per day was
15.2 with a range of 10–25 cigarettes per day. The mean duration of cigarette smoking reported was 22.4 years
with a range of 0.6 to 48 years.
Group I participants consisted of 4 males and 6 females with an average age of 46.2 years who reported using
a mean of 13.1 cigarettes per day and had smoked for an average of 22.7 years. Group II participants consisted
of 6 males and 4 females with an average age of 42.3 years who reported using a mean of 15.1 cigarettes per day
and had smoked for an average of 19.9 years. Group III participants consisted of 7 males and 3 females with an
average age of 42.2 years who reported using a mean of 14.4 cigarettes per day and had smoked for an average
of 22.5 years.
Three study participants in Group I reported a total of four adverse events (3 of moderate severity) and
fourteen adverse events (3 of moderate severity) were reported by six study participants in Group II. No adverse
effects were reported from participants in Group III. No adverse events were judged to be serious and related
to product use by the principal investigator or resulted in withdrawal from the study. Seventeen adverse events
were judged by the principal investigator to be possibly related to product use including: 8 reports of headache;
2 reports of nasal congestion; 2 reports of rhinorrhea; 2 reports of sore/throat irritation; 1 report of viral upper
respiratory tract infection, 1 report of flu like symptoms and 1 report of back pain. One study participant from
Group I withdrew due to a family emergency. Two study participants from Group II withdrew from the study,
one withdrew due to a family emergency and the second participant was discontinued from the office and
hospitality conditions due to study procedure non-compliance. All remaining study participants completed the
study according to the protocol.
Product use. The amount of e-liquid used by Groups I and II with prescribed and ad libitum product use
is shown in Table 2. For Groups I and II, the average amount of e-liquid used during prescribed product use
was relatively consistent between the different ventilation conditions, however Group II consistently used more
e-liquid than Group I during prescribed product use. For Group II, the average amount of e-liquid used during
ad libitum product use was similar to the amount used during prescribed product use and was also relatively
consistent between the different ventilation condition. There were differences in the average amount of e-liquid
used between prescribed and ad libitum product use in Group I for the residential and hospitality ventilation
conditions, but not the office ventilation condition.
Selected constituent concentrations. The mean cumulative 4-h concentration of each constituent that
was measured above the limit of quantification for Groups I, II and III are provided in Tables 3, 4, and 5. To
determine which of the 34 measured constituents were related to product use, five criteria were used to sort the
mean cumulative 4-h constituent concentration data (Table 6). Constituents were removed from consideration
if : (1) They were never found above limit of quantification (LOQ); (2) Were not statistically different from base-
line concentrations in any Group; (3) Were not statistically different from the baseline concentration measured
prior to product use; (4) There was no dose response as a function of amount of fresh air supplied in the dif-
ferent ventilation conditions (i.e., approximately 30% less for office ventilation and approximately 67% less for
the hospitality ventilation) for prescribed product use for Groups I and II and ad libitum product use for Group
Scientific Reports | (2021) 11:1736 | https://doi.org/10.1038/s41598-021-80963-9 2
Vol:.(1234567890)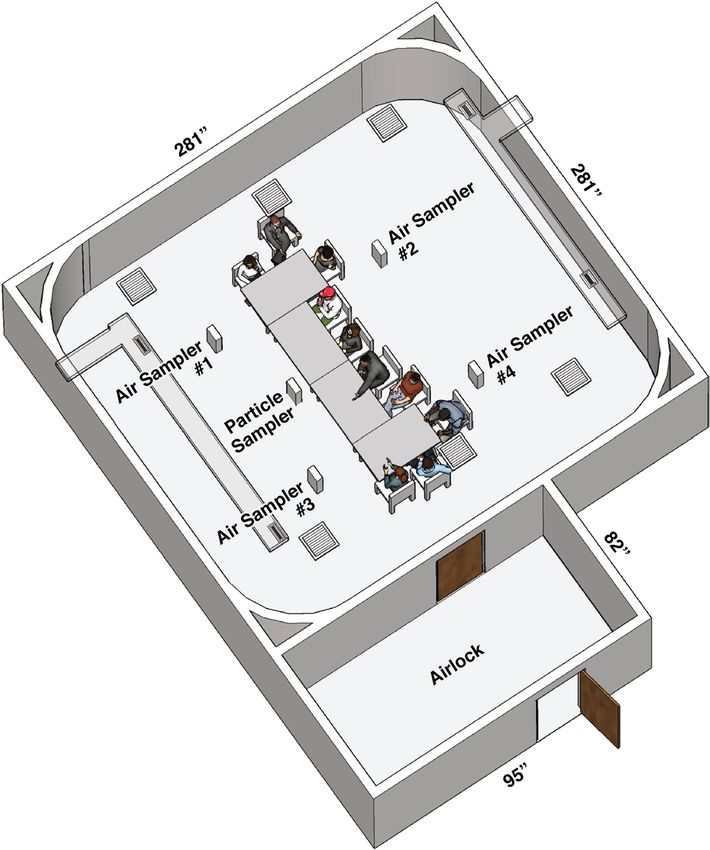
www.nature.com/scientificreports/
Residential Office Hospitality
Parameter Prescribed* Ad libitum Prescribed* Ad libitum Prescribed* Ad libitum
Group I E-liquid used (mg)
Mean ± SD 136.8 ± 60.2 205.1 ± 119.5 124.2 ± 29.0 137.6 ± 124.1 117.8 ± 55.2 151.4 ± 142.3
Median 124.0 226.5 117.0 127.0 107.5 93.0
Range 65.0–286.0 53.0–385.0 95.0–186.0 22.0–443.0 25.0–183.0 43.0–428
N 10 10 9 9 10 9
Group II E-liquid used (mg)
Mean ± SD 191.9 ± 79.8 189.3 ± 109.6 215.5 ± 107.8 212.4 ± 175.5 192.3 ± 94.6 168.2 ± 195.7
Median 186.0 206.5 237.5 159.0 227.0 84.0
Range 37.0–299.0 10.0–394.0 25.0–364 14.0–573.0 17.0–334.0 13.0–606.0
N 10 10 8 8 9 9
Table 2. E-liquid used during prescribed and ad libitum product use for Groups I and II. *In addition to the
80 puffs taken during prescribed use, an additional 20 puffs were taken prior to weighing the pods, so values
represent 100 puffs.
Group I
Residential (µg/m3) Office (µg/m3) Hospitality (µg/m3)
Constituent LOQ (µg/m3) Prescribed Ad libitum Prescribed Ad libitum Prescribed Ad libitum
Nicotine* 1.87 4.01 ± 1.63 6.14 ± 1.31 1.37 ± 0.37 1.95 ± 0.46 0.75 ± 0.20 1.91 ± 0.42
Propylene Glycol 31.93 38.54 ± 14.05 51.17 ± 10.03 8.52 ± 21.71 7.45 ± 23.66 5.88 ± 11.03 9.51 ± 11.94
Glycerin 33.66 70.85 ± 27.95 77.50 ± 24.25 33.12 ± 13.76 48.60 ± 17.82 17.78 ± 5.06 32.30 ± 5.41
Acetaldehyde 24.82 BBV 0.52 ± 2.97 0.60 ± 0.18 BBV 0.14 ± 0.31 BBV
Acetone* 24.71 2.78 ± 2.61 BBV 10.85 ± 4.17 5.10 ± 6.53 6.40 ± 2.58 6.55 ± 5.31
Acrolein 24.82 BBV BBV BBV BBV 0.05 ± 0.17 0.55 ± 0.64
Benzaldehyde 28.82 BBV BBV BBV BBV 0.05 ± 0.19 0.63 ± 0.74
Butyraldehyde 25.03 BBV BBV BBV BBV 0.09 ± 0.31 1.09 ± 1.27
Crotonaldehyde 25.03 BBV BBV BBV BBV 0.03 ± 0.09 0.31 ± 0.36
Formaldehyde 24.71 0.05 ± 2.10 0.03 ± 1.45 1.65 ± 0.24 1.13 ± 1.18 BBV BBV
Hexanaldehyde 24.82 BBV BBV BBV BBV 0.07 ± 0.27 0.78 ± 0.94
Isovaleraldehyde 24.82 BBV BBV BBV BBV 0.04 ± 0.13 0.43 ± 0.50
Methyl ethyl ketone 24.189 BBV 0.93 ± 2.30 BBV BBV BBV BBV
m&p tolualdehyde 49.64 BBV BBV BBV BBV 0.04 ± 0.14 0.45 ± 0.53
o-Tolualdehyde 25.03 BBV BBV BBV BBV 0.04 ± 0.15 0.49 ± 0.57
Propionaldehyde 24.82 1.47 ± 3.00 5.11 ± 1.65 0.82 ± 0.94 BBV 0.03 ± 0.43 0.82 ± 0.84
Valeraldehyde 24.82 BBV BBV BBV BBV 0.04 ± 0.12 0.40 ± 0.46
2,5-Dimethylbenzal-
25.03 BBV BBV BBV BBV 0.11 ± 0.42 1.35 ± 1.58
dehyde
1,3-Butadiene* 0.3 BBV BBV 0.00 ± 0.08 0.03 ± 0.05 0.03 ± 0.05 0.03 ± 0.05
2-Nitropropane 0.7 0.0 ± 0.0 0.0 ± 0.0 0.0 ± 0.0 0.0 ± 0.0 0.0 ± 0.0 0.0 ± 0.0
Benzene* 0.3 0.25 ± 0.06 0.35 ± 0.06 0.13 ± 0.13 0.35 ± 0.06 BBV 0.28 ± 0.15
Ethylbenzene* 0.3 0.15 ± 0.13 0.05 ± 0.06 0.60 ± 0.22 0.25 ± 0.06 BBV 0.48 ± 0.05
Ethylene oxide 3.4 0.00 ± 0.08 0.03 ± 0.10 0.03 ± 0.05 BBV 0.05 ± 0.06 0.03 ± 0.05
Furan 0.7 1.40 ± 0.14 0.90 ± 0.56 0.0 ± 0.0 0.0 ± 0.0 0.0 ± 0.0 0.0 ± 0.0
Isoprene* 0.3 0.55 ± 0.42 BBV 0.05 ± 1.11 BBV BBV 0.73 ± 0.51
Nitromethane 0.7 0.0 ± 0.0 0.0 ± 0.0 0.0 ± 0.0 0.0 ± 0.0 0.0 ± 0.0 0.0 ± 0.0
Propylene oxide 3.4 0.00 ± 0.08 0.03 ± 0.10 0.03 ± 0.05 BBV 0.05 ± 0.06 0.03 ± 0.05
Toluene* 0.3 0.95 ± 0.13 0.58 ± 0.05 0.65 ± 0.29 1.13 ± 0.05 BBV 1.13 ± 0.05
Vinyl acetate 0.7 0.0 ± 0.0 0.0 ± 0.0 0.0 ± 0.0 0.0 ± 0.0 0.0 ± 0.0 0.0 ± 0.0
Table 3. Mean (± SD; N = 4) cumulative (4-h) constituent concentrations changes from baseline values for
Group I for any constituent detected above LOQ for at least one puffing regimen for any group. Statistically
significant constituent values from baseline (p < 0.05) are in bold. Statistically significant differences (p < 0.05)
found in baseline concentrations (N = 4) between ventilation conditions are denoted with an asterisk. BBV
Below baseline value, LOQ Limit of Quantification is based upon the amount of air sampled and is a composite
average from all 4 air samplers used in the six runs.
Scientific Reports | (2021) 11:1736 | https://doi.org/10.1038/s41598-021-80963-9 3
Vol.:(0123456789)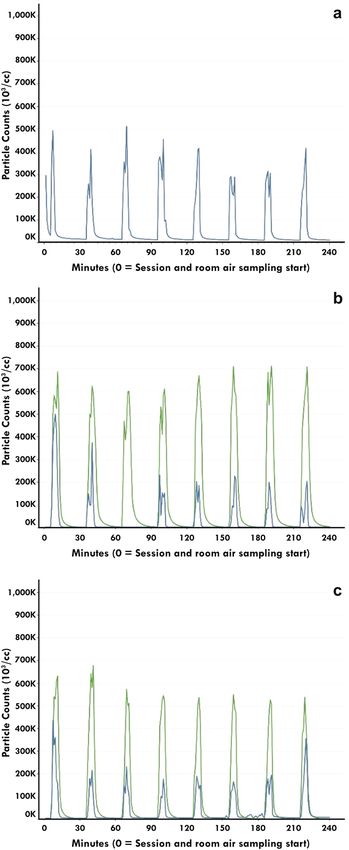
www.nature.com/scientificreports/
Group II
Residential (µg/m3) Office (µg/m3) Hospitality (µg/m3)
Constituent LOQ (µg/m )
3
Prescribed Ad libitum Prescribed Ad libitum Prescribed Ad libitum
Nicotine* 1.87 3.45 ± 3.95 6.23 ± 4.31 5.77 ± 1.64 6.11 ± 1.12 2.77 ± 2.75 1.87 ± 2.56
Propylene glycol 31.93 30.34 ± 5.08 37.12 ± 5.40 36.13 ± 5.49 32.95 ± 6.12 0.25 ± 28.01 BBV
Glycerin 33.66 81.80 ± 4.58 110.55 ± 18.82 69.20 ± 23.88 69.63 ± 17.33 2.77 ± 2.75 1.87 ± 2.56
Acetaldehyde 24.82 BBV 0.40 ± 1.10 0.13 ± 1.09 BBV 0.68 ± 0.27 0.01 ± 0.25
Acetone* 24.71 2.53 ± 5.97 BBV 9.75 ± 6.05 3.28 ± 12.49 3.20 ± 5.62 BBV
Acrolein 24.82 0.04 ± 0.19 BBV 0.06 ± 0.13 BBV BBV 0.03 ± 0.04
Benzaldehyde 28.82 0.05 ± 0.22 0.00 ± 0.24 0.06 ± 0.15 BBV BBV 0.03 ± 0.07
Butyraldehyde 25.03 0.08 ± 0.36 BBV 0.10 ± 0.26 BBV BBV 0.06 ± 0.06
Crotonaldehyde 25.03 0.02 ± 0.11 0.00 ± 0.12 0.03 ± 0.07 BBV BBV 0.02 ± 0.02
Formaldehyde 24.71 BBV BBV BBV 0.13 ± 1.88 0.09 ± 0.33 BBV
Hexanaldehyde 24.82 0.08 ± 0.26 0.03 ± 0.31 0.09 ± 0.20 BBV BBV 0.05 ± 0.06
Isovaleraldehyde 24.82 0.03 ± 0.15 BBV 0.04 ± 0.10 BBV BBV 0.02 ± 0.03
Methyl ethyl ketone 24.189 BBV 0.41 ± 0.95 BBV 0.33 ± 0.80 BBV BBV
m&p tolualdehyde 49.64 0.04 ± 0.16 BBV 0.05 ± 0.11 BBV BBV 0.03 ± 0.03
o-Tolualdehyde 25.03 0.04 ± 0.17 BBV 0.05 ± 0.11 BBV BBV 0.03 ± 0.03
Propionaldehyde 24.82 12.89 ± 3.64 BBV 62.09 ± 9.13 0.39 ± 0.72 BBV BBV
Valeraldehyde 24.82 0.03 ± 0.14 BBV 0.04 ± 0.09 BBV BBV 0.02 ± 0.03
2,5-Dimethylbenzaldehyde 25.03 0.11 ± 0.47 0.00 ± 0.52 0.15 ± 0.30 BBV BBV 0.09 ± 0.08
1,3-Butadiene 0.3 0.20 ± 0.08 0.15 ± 0.06 0.05 ± 0.06 BBV 0.0 ± 0.0 0.0 ± 0.0
2-Nitropropane 0.7 0.03 ± 0.05 0.0 ± 0.0 0.0 ± 0.0 0.0 ± 0.0 0.0 ± 0.0 0.0 ± 0.0
Benzene 0.3 0.05 ± 0.06 0.03 ± 0.05 0.08 ± 0.10 0.03 ± 0.05 0.00 ± 0.14 0.05 ± 0.17
Ethylbenzene* 0.3 BBV BBV 0.05 ± 0.10 0.0 ± 0.0 0.48 ± 0.21 BBV
Ethylene oxide 3.4 0.15 ± 0.24 0.00 ± 0.08 0.05 ± 0.06 0.00 ± 0.08 0.03 ± 0.05 0.0 ± 0.0
Furan 0.7 0.03 ± 0.05 0.0 ± 0.0 0.0 ± 0.0 0.0 ± 0.0 0.0 ± 0.0 0.0 ± 0.0
Isoprene* 0.3 1.10 ± 0.68 BBV 0.13 ± 0.99 0.65 ± 0.59 BBV BBV
Nitromethane 0.7 BBV BBV 0.0 ± 0.0 0.0 ± 0.0 0.0 ± 0.0 0.0 ± 0.0
Propylene oxide 3.4 0.15 ± 0.24 0.00 ± 0.08 0.05 ± 0.06 0.00 ± 0.08 0.03 ± 0.05 0.0 ± 0.0
Toluene* 0.3 BBV BBV 0.13 ± 0.05 0.58 ± 0.10 2.43 ± 0.22 BBV
Vinyl acetate 0.7 0.03 ± 0.05 0.0 ± 0.0 0.0 ± 0.0 0.0 ± 0.0 0.0 ± 0.0 0.0 ± 0.0
Table 4. Mean (± SD; N = 4) cumulative (4-h) constituent concentrations changes from baseline values for
Group II for any constituent detected above LOQ for at least one puffing regimen for any group. Statistically
significant constituent values from baseline (p < 0.05) are in bold. Statistically significant differences (p < 0.05)
found in baseline concentrations (N = 4) between ventilation conditions are denoted with an asterisk. BBV
Below baseline value, LOQ Limit of Quantification is based upon the amount of air sampled and is a composite
average from all 4 air samplers used in the six runs.
III; and (5) Did not correlate with the difference in amount of e-liquid used (Table 2) between prescribed vs.
ad libitum product use. For each ENDS three constituents/Group met all five criteria, nicotine, propylene glycol,
and glycerin (Group I) and glycerin, 1,3-butadiene, and isoprene (Group II) (Table 6). In comparison, for Group
III there were eleven constituents (nicotine, glycerin, acetaldehyde, acetone, formaldehyde, propionaldehyde,
1,3-butadiene, benzene, ethylbenzene, furan, and isoprene) that met all five criteria, (Table 6). For Group III,
not only were there significantly more constituents that met the five criteria, but also their measured concentra-
tions were significantly greater, except for the main ENDS ingredients, propylene glycol and glycerin (Tables 3,
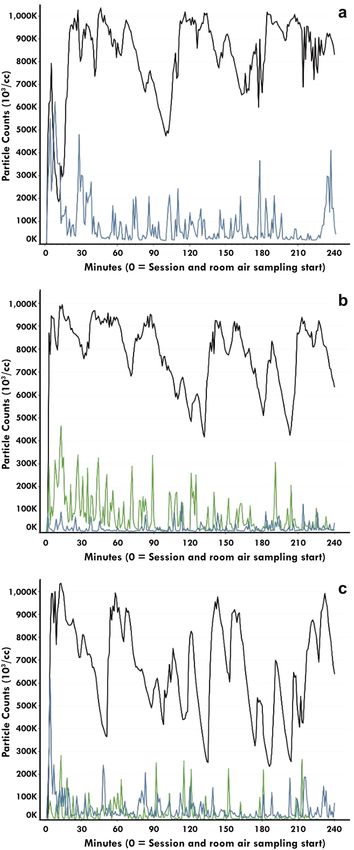
4, 5). For example, the mean 4-h cumulative nicotine and formaldehyde concentrations from ad libitum use of
ENDS were over 84% and 95% less than the nicotine and formaldehyde concentrations from ad libitum use of
conventional cigarettes, respectively, when comparing within ventilation conditions (Fig. 1). For the main ENDS
ingredients, propylene glycol and glycerin, ad libitum use of ENDS resulted in concentrations that were several
fold higher than concentrations measured from ad libitum use of conventional cigarettes (Fig. 1).
The 4-h cumulative concentrations of constituents during ad libitum use were generally higher than during
prescribed use in Groups I and II. There were also 4-h cumulative concentrations of one constituent in Group
I (acetone) and two in Group II (ethylbenzene and toluene) that increased as a function of the amount of fresh
air dilution (Tables 3, 4).
Baseline measurements were performed with the participants in the exposure chamber without any product
use on Day 1 for each ventilation condition. For some constituents, there was substantial variability in baseline
concentrations measured between ventilation conditions within a group (Tables 3, 4, 5) and between groups
(Supplemental Table S4). Comparing mean baseline constituent concentrations, measured from all three groups
and ventilation conditions (N = 12), to baseline concentrations obtained prior to product use in the residential
Scientific Reports | (2021) 11:1736 | https://doi.org/10.1038/s41598-021-80963-9 4
Vol:.(1234567890)www.nature.com/scientificreports/
Group III Ad libitum (µg/m3)
Constituent LOQ (µg/m )
3
Residential Office Hospitality
Nicotine* 1.87 56.68 ± 8.28 39.02 ± 1.59 28.49 ± 1.76
Propylene glycol* 31.93 BBV 3.43 ± 9.62 2.63 ± 8.62
Glycerin* 33.66 20.38 ± 4.05 16.60 ± 4.22 BBV
Acetaldehyde 24.82 58.45 ± 8.87 37.28 ± 2.26 28.98 ± 1.70
Acetone* 24.71 21.43 ± 4.97 6.83 ± 11.12 5.13 ± 7.35
Acrolein 24.82 0.32 ± 0.18 0.03 ± 0.03 0.10 ± 0.05
Benzaldehyde 28.82 0.38 ± 0.23 BBV 0.11 ± 0.05
Butyraldehyde 25.03 0.65 ± 0.38 BBV 0.18 ± 0.08
Crotonaldehyde 25.03 0.18 ± 0.10 BBV 0.05 ± 0.03
Formaldehyde 24.71 41.53 ± 4.61 24.48 ± 1.39 20.16 ± 1.27
Hexanaldehyde 24.82 0.46 ± 0.26 BBV 0.13 ± 0.09
Isovaleraldehyde 24.82 0.26 ± 0.14 BBV 0.07 ± 0.04
Methyl ethyl ketone 24.189 2.79 ± 1.84 3.72 ± 0.66 3.36 ± 2.33
m&p tolualdehyde 49.64 0.27 ± 0.15 BBV 0.08 ± 0.04
o-Tolualdehyde 25.03 0.29 ± 0.16 BBV 0.08 ± 0.04
Propionaldehyde 24.82 1.25 ± 0.55 0.84 ± 2.41 BBV
Valeraldehyde 24.82 0.24 ± 0.13 BBV 0.07 ± 0.04
2,5-Dimethylbenzaldehyde 25.03 0.80 ± 0.43 BBV 0.24 ± 0.13
1,3-Butadiene* 0.3 9.58 ± 0.78 4.85 ± 0.33 3.98 ± 1.01
2-Nitropropane 0.7 BBV 0.0 ± 0.0 0.0 ± 0.0
Benzene* 0.3 8.38 ± 0.67 3.73 ± 0.39 2.95 ± 0.17
Ethylbenzene* 0.3 3.10 ± 0.29 1.15 ± 0.06 1.05 ± 0.06
Ethylene oxide 3.4 BBV 0.0 ± 0.0 0.00 ± 0.08
Furan* 0.7 6.30 ± 1.87 4.93 ± 0.28 3.50 ± 0.54
Isoprene* 0.3 55.63 ± 5.27 30.13 ± 4.04 25.08 ± 4.86
Nitromethane 0.7 BBV 0.0 ± 0.0 0.0 ± 0.0
Propylene oxide 3.4 BBV 0.0 ± 0.0 0.0 ± 0.08
Toluene* 0.3 13.75 ± 1.35 5.10 ± 0.27 5.45 ± 0.48
Vinyl acetate 0.7 BBV 0.0 ± 0.0 0.0 ± 0.0
Table 5. Mean (± SD; N = 4) cumulative (4-h) constituent concentrations changes from baseline values for
Group III for any constituent detected above LOQ for at least one puffing regimen for any group. Statistically
significant constituent values from baseline (p < 0.05) are in bold. Statistically significant differences (p < 0.05)
found in baseline concentrations (N = 4) between ventilation conditions are denoted with an asterisk. BBV
Below baseline value, LOQ Limit of Quantification is based upon the amount of air sampled and is a composite
average from all 4 air samplers used in the three runs.
ventilation condition (N = 4), resulted in statistically significant differences (p < 0.05) in 11 of the 34 constituent
concentrations (nicotine, propylene glycol, glycerin, acetone, 1,3-butadiene, benzene, ethyl benzene, furan, iso-
prene, nickel, and toluene). Performing the same comparison for baseline measurements obtained prior to the
office and hospitality ventilation conditions resulted in statistically significant differences (p < 0.05) for 7 of the
34 constituent concentrations (nicotine, acetone, 1,3-butadiene, benzene, ethyl benzene, nickel, and toluene) and
3 of the constituent concentrations (acetone, ethyl benzene, and toluene), respectively. Reduction of the number
of significant differences in baseline constituent concentrations as a function of increasing fresh air dilution,
suggests that these constituents were from participants and not increased amounts of high-efficiency particulate
air (HEPA) filter fresh air. Since the different ventilation conditions within and between Groups were conducted
on different days, another potential source of variability are daily variations in background concentrations of
constituents. Background carbonyl measurements were performed without participants in the exposure chamber
prior to and after baseline measurements, prescribed and ad libitum product use. Differences in background
concentrations (> 20% between measurements) were found between ventilation conditions within a group and
between groups for acetaldehyde, acetone, and propionaldehyde (Supplemental Figs. S1–S45).
Particle concentration. Temporally, the particle number concentration for Groups I and II mirrored the
prescribed puffing regimen for each ventilation condition (Fig. 2). Particle number concentration for the resi-
dential condition with Group II were not obtained (Fig. 2A) because the particle sampler was set up incorrectly.
An instrument error also occurred for four minutes in the office ventilation condition for Group I (Fig. 2B). In
the office and hospitality ventilation condition, total particle number concentration during product use were less
for Group I compared with Group II (Fig. 2B,C). Total particle number concentration under ad libitum condi-
tions were generally lower than those from the prescribed puffing regimen for Groups I and II, however there
Scientific Reports | (2021) 11:1736 | https://doi.org/10.1038/s41598-021-80963-9 5
Vol.:(0123456789)www.nature.com/scientificreports/
Table 6. Criteria used for deciding which measured constituents are a function of product use.
were instances when the total particle number concentrations were roughly equivalent (Figs. 2 and 3). Total
particle number concentration during ad libitum product use were substantially higher for Group III compared
to Groups I and II in the residential (Fig. 3A) and office (Fig. 3B) ventilation conditions. In the hospitality ven-
tilation condition, there was evidence of reduced total particle number concentration that were most prominent
in Group III with some overlap in total particle number concentration with Groups I and II (Fig. 3C).
Discussion
The use of multiple ventilation conditions enabled use of a dose response (Criteria #4) to help determine which
of the measured constituents were correlated to product use. For ENDS used in Groups I and II only three of
the 34 constituents measured were correlated to product use while eleven of the 34 constituents were correlated
to use of conventional cigarettes (met all five criteria). Cumulative concentration of constituents after ENDS
and conventional cigarette use were consistent with previously published environmental studies3,16,18,19. Differ-
ences in specific constituents detected and their cumulative concentration between our results and the previ-
ous environmental studies, are not only due to the different ENDS tested, different puffing regimens, different
subject populations, but also different room sizes and ventilation rates used in the current study. For example,
one study16 placed nine occasional smokers (< 10 cigarettes/week) in a smaller room (18 m2 & 45 m 3) with 0.56
air exchanges/hour and reported a range of nicotine (< 0.04–4.6 µg/m3), propylene glycol (< 0.04–395.0 µg/m3),
glycerin (< 0.04–81.0 µg/m3), formaldehyde (21.0–55.0 µg/m3) and acetaldehyde (16.0–162.0 m3) concentrations
among other constituents from use of different e-liquid formulations. Considering the differences in participant
population (occasional smokers vs. smokers of greater than or equal to 10 cigarettes/day) room size (18 m 2 vs 51.9
m2 and 45 m 3 vs 136 m
3) ventilation (0.56 vs 7.5 air exchanges/hour), and products studied, the average four-hour
Scientific Reports | (2021) 11:1736 | https://doi.org/10.1038/s41598-021-80963-9 6
Vol:.(1234567890)www.nature.com/scientificreports/
Figure 1. Comparison of mean cumulative (± SD) nicotine, propylene glycol, glycerin and formaldehyde
concentrations measured after 4-h of ad libitum product use for all Groups. Group I—Blue bars, Group II—
Orange bars, and Group III gray bars. Missing bars indicate that the cumulative mean concentrations were
below baseline values.
cumulative concentrations for prescribed or ad libitum ENDS use from the current study are remarkably consist-
ent for propylene glycol (30.34–51.17 µg/m3), glycerin (70.85–110.55 µg/m3), and nicotine (3.45–6.14 µg/m3).
Measured concentrations of formaldehyde (below baseline value—0.03 μg/m3) and acetaldehyde (below baseline
value—0.52 µg/m3) were substantially lower than reported by one s tudy16 likely due to the different products used
in the two studies and our use of ventilation rates compliant with American Society of Heating, Refrigerating
and Air-Conditioning Engineers (ASHRAE)/ANSI standards31 for the room size used. When similar ventilation
rates are used19, results are more consistent with the current study. This study19 used experienced ENDS users
and cigarette smokers and compared concentrations of selected air constituents in a slightly smaller room (38 m 2
vs 51.9 m2 and 114 m3 vs 136 m3) using the same office ventilation rate as the current study. For prescribed and
ad libitum product use19 the reported a range of nicotine (0.38–2.83 µg/m3), propylene glycol (33.06–211.51 µg/
m3), glycerin (67.89–126.75 µg/m2), and formaldehyde (below baseline values) concentrations are more consist-
ent with concentrations measured in the current study than those of16.
Use of conventional cigarettes resulted in greater particle number concentration than either prescribed or
ad libitum use of ENDS. This was expected since conventional cigarettes generate side stream smoke between
puffs, which ENDS do not. Using the prescribed puffing regimen, Group II participants exhaled a higher particle
number concentration than Group I participants, which might be a function of the amount of e-liquid used.
Consistent with previous conclusions o f32, ENDS aerosols have a high proportion of volatile and semi-volatile
Scientific Reports | (2021) 11:1736 | https://doi.org/10.1038/s41598-021-80963-9 7
Vol.:(0123456789)www.nature.com/scientificreports/
Figure 2. Comparison of the particle number concentration measured from prescribed product use in Groups I
(blue line) and II (green line) in each ventilation condition (A = residential; B = Office; C = Hospitality). Note that
for Group II in the residential ventilation condition there was no particle number concentration due incorrect
device setup.
ingredients and are temporally dynamic, making comparisons with previous studies measuring particle num-
ber concentration, tenuous at best. Combined with differences in measurement equipment, puffing regimens
and products tested, our results are in general agreement with the particle number concentrations previously
reported18 (up to 220,000 particles/cm3) even though a larger room with office ventilation was used, as well as20,
(50,000 particles/cm3 peak and approximately 9,000 particles/cc between peaks) when a smaller room with lower
ventilation rate (0.67 air exhanges/h) and four participants were used.
The statistically significant differences in measured baseline concentrations between ventilation conditions
within Groups and between Groups complicated the comparisons within and between Groups. The importance
of measuring amount of product used was highlighted in Group I. In Group I, during prescribed product use
Scientific Reports | (2021) 11:1736 | https://doi.org/10.1038/s41598-021-80963-9 8
Vol:.(1234567890)www.nature.com/scientificreports/
Figure 3. Comparison of the particle number concentration measured from ad libitum product use in Groups
I, II and III (blue, green and black lines respectively) in each ventilation condition (A = residential; B = Office;
C = Hospitality).
an average of 136.8 mg of e-liquid was used compared to ad libitum product use when an average of 205.1 mg
of e-liquid was used. In both cases cumulative 4-h measured concentrations of furan and toluene were statisti-
cally significantly different from baseline values. Contrary to the amount of e-liquid consumed, 1.40 µg/m3 of
furan was measured during prescribed product use and only 0.9 µg/m3 of furan was measured with ad libitum
product use. A similar pattern occurred for toluene, with 0.95 µg/m3 measured during prescribed product use
and 0.58 µg/m3 measured during ad libitum product use.
The results of this study should be interpreted in the context of some of its’ limitations. Comparison of
constituent levels between products during ad libitum product use not only includes the inherent differences in
product use, but also includes any differences between the groups. This study did not measure surface levels of any
constituents so comparison of dilution and dispersion vs. absorption to surfaces was not performed. Consistent
Scientific Reports | (2021) 11:1736 | https://doi.org/10.1038/s41598-021-80963-9 9
Vol.:(0123456789)www.nature.com/scientificreports/
with previous studies, this study was only conducted in a single room, however different ventilation conditions
were utilized, resulting in a range of aerosol mixing and distribution; it is not known how our results would
be generalizable to uniquely configured rooms (non-rectangular or excessively rectangular) or other enclosed
spaces (e.g., vehicles, etc.). Although multiple ventilation conditions were used, it is not practical to perform these
studies for every ENDS product, therefore, we agree with previous w ork19 that data from these types of studies
should be used to verify different modeling approaches. Once the modeling approaches are verified, they can be
used to investigate different scenarios with minimal experimental verification. Finally, the low concentrations
measured for some constituents should be interpreted with caution due to the inherent variability in: (1) their
background concentrations in fresh air; and (2) variability in baseline concentrations that incorporate amounts
in normal human exhaled breath33. Even when considering the average amount of e-liquid consumed, small
concentration changes of some constituents could not be explained meaning there are other confounding fac-
tors that were not controlled in this study. This might be due to baseline measurements not incorporating the
prescribed or ad libitum puffing regimen.
In summary, our findings support the importance of baseline measurements that include participants in the
room, measurement of the amount of product used, and use of different ventilation levels, which were impor-
tant in the interpretation of our results. Our findings indicate that under the various study conditions, use of
conventional cigarettes resulted in significantly more constituents (e.g., acetaldehyde, acetone, formaldehyde,
propionaldehyde, 1,3-butadiene, benzene, ethylbenzene, furan, and isoprene) and higher 4-h cumulative con-
centrations of measured constituents in comparison to the two ENDS tested (JL ENDS, Virginia Tobacco 5.0%
nicotine by weight and VUSE Solo Original Flavor 4.8% nicotine by weight), except for propylene glycol and
glycerin, which are the predominate ENDS ingredients. ENDS use resulted in as much as a 95% reduction in
some measured constituents. Additionally, use of conventional cigarettes resulted in greater particle number
concentrations than either prescribed or ad libitum use of either of the ENDS used in this study.
Material and methods
The Advarra, Canada Institutional Review Board (IRB#00000971) reviewed and approved all pertinent study
documents, including the experimental study protocol and informed consent document. All Study participants
provided their informed consent and the study was conducted in accordance the principles and requirements of
Good Clinical Practice as defined by the U.S. Food and Drug A dministration34 and the Declaration of Helsinki.
The study was listed on clinicaltrials.gov web site with the NCT number: NCT03605641.
Study design and procedure. This study was designed as an open-label, single center, three-arm obser-
vational study to compare concentrations of selected air constituents (chemicals) during four-hours of product
use of two ENDS and conventional cigarette products using three different room ventilation conditions (resi-
dential, office and hospitality). The overall study design and scheduling is shown in Fig. 4. Following informed
consent, potential participants were screened (Day − 60 to − 2) according to inclusion and exclusion criteria
(Supplemental Tables S1 and S2). A total of 43 participants were enrolled in the study with 10 assigned to each
of three groups (Groups I, II and III), 9 participants were unassigned and 4 failed to meet all study inclusion
criteria. All enrolled participants were offered the opportunity to quit use of all tobacco products with a referral
to the STOP program (Smoking Treatment for Ontario Patients). Participants in Groups I and II used a pod- or
cartridge-based ENDS, respectively, under prescribed and ad libitum use conditions in each of the three ventila-
tion conditions. Participants in Group III used their own brand of conventional cigarette only under ad libitum
use conditions in each of the three ventilation conditions. Study groups were scheduled sequentially on separate
days and in numerical order with the different ventilation conditions separated by at least 5 days.
All study procedures were conducted in a dedicated exposure chamber (Inflamax Research, dba Cliantha
Research, Mississauga, On, Canada). The exposure chamber was validated to provide consistent environmental
conditions consistent with the ASHRAE standards31 for residential, office, and hospitality environments. Analysis
of constituents from sampling of room air was performed under 4 different conditions: (1) Background condi-
tion – sampling was performed for only carbonyls after a 2-h air wash of the exposure chamber without any
study participants in the exposure chamber and was performed on all study days to account for the variable
concentration of constituents in fresh air that occur throughout the day; (2) Baseline condition—sampling for all
constituents was performed for four hours with participants in the exposure chamber without any product use to
account for concentrations of exhaled constituents from p articipants33; (3) Prescribed product use (only Groups
I and II)—sampling was performed for four hours with participants using the assigned ENDS every 30 min.
Each product use consisted of 10 puffs each of 3 s. duration with an interpuff interval of 30 s.; (4) ad libitum
product use (all groups)—sampling was performed for four hours with participants using their assigned product
as desired. For Groups I and II product use consisted of at least 40 puffs without restrictions on puff volume or
frequency. For Group III a minimum of one cigarette/hour was required.
All subjects within each group entered the exposure chamber at the same time for all baseline, prescribed
and ad libitum product use. They were requested to remain seated and alert. Only drinking water was provided
within the exposure chamber on an ad libitum basis. Exit and re-entry from the exposure chamber was limited to
minimize airflow disruption. The post screening study schedule for each ventilation condition (second, third and
fourth visit) is shown in Fig. 4. All participants returned to the clinic the evening prior to Day 1 for an overnight
stay with confirmed abstinence from any tobacco or nicotine products for 10 h.
Study participants. The study plan was to enroll approximately 30 healthy male and female conventional
cigarette smokers (10 participants per group) between the ages of 21 and 65 years old. Study participants had
to have a self-reported minimum daily conventional cigarette consumption rate of 10 cigarettes/day for the
Scientific Reports | (2021) 11:1736 | https://doi.org/10.1038/s41598-021-80963-9 10
Vol:.(1234567890)www.nature.com/scientificreports/
Figure 4. Study schedule for all groups.
past 3 months, a urinary cotinine result at the Screening Visit of > 200 ng/ml and be in good general health as
documented by their medical history, physical examination, assessment of vital signs and general observation.
Scientific Reports | (2021) 11:1736 | https://doi.org/10.1038/s41598-021-80963-9 11
Vol.:(0123456789)www.nature.com/scientificreports/
Figure 5. Exposure Chamber and Airlock showing air and particle sampler locations.
Products used. Participants in Group I were assigned to use a pod-based ENDS (JUUL Labs, Inc. San
Francisco, CA, USA). The Virginia Tobacco flavored product (JL ENDS) contained 5.0% (by weight) United
States Pharmacopeia Grade nicotine and a mixture of propylene glycol, glycerin, benzoic acid, and flavors. Par-
ticipants in Group II were assigned to use a replaceable cartridge-based ENDS, VUSE Solo (Reynolds American
International, Winston-Salem, NC, USA). The Original Flavor VUSE Solo e-liquid consisted of 4.8% (by weight)
nicotine, propylene glycol, vegetable glycerin, flavors and water. Participants in Group III used their own store
bought conventional (not hand-rolled) Canadian full-flavored cigarette product. For Groups I and II, the weight
of each pod or cartridge was measured prior to and after use to measure the amount e-liquid that was used.
Study endpoints. Room air samples were analyzed for 34 constituents (Table 2). These constituents
were selected because they are typically measured for indoor air sampling, have been measured in previous
studies19,34–38 and have validated aerosol collection and analytical methods. Additionally, 29 of the 34 constitu-
ents are listed as or are proposed for addition to the list of harmful and potentially harmful constituents in
tobacco products by the U.S. Food and Drug Administration39,40. Primary study endpoints were changes in the
concentration of the 34 constituents from baseline (no product use in exposure chamber) to product use con-
ditions for the three study products using three different ventilation conditions (background corrected where
applicable).
Environmental chamber and air sampling. The environmental chamber used in this study was 51.9 m2
with a volume of 136 m3. To minimize airflow disruption in the environmental chamber due to door opening
and closing, an airlock room (5.1 m2 and 13.4 m 3 in volume) was directly attached to the environmental cham-
ber and was used to control access to the environmental chamber. A schematic diagram of the airlock room and
exposure chamber showing the position of study participants at tables, four room air samplers and the particle
sampler is shown in Fig. 5. For each of the ventilation conditions used in this study (residential, office and hospi-
tality), ASHRAE standards31 for living spaces were used (Table 1). All fresh air supplied was HEPA filtered prior
to entering the exposure chamber. Temperature in the exposure chamber was maintained at 22 ± 1 °C and rela-
tive humidity (RH) was maintained at 50% ± 30% RH. Air sampler placement was specifically not designed to
investigate impact of a “proximity or source effect”, but rather to provide an overall average of potential non-user
exposure to exhaled aerosols in a room that was compliant with building codes31 at three ventilation conditions.
Based upon a previous study19, the exposure chamber volume and ventilation, room air was collected continu-
ously during background (2 h), baseline (4 h) and product use conditions (4 h) for cumulative samples to ensure
adequate detection levels. Measurement of particle number concentration was also performed continuously
with data collected for averaging every minute. Only carbonyls were measured during background conditions.
Scientific Reports | (2021) 11:1736 | https://doi.org/10.1038/s41598-021-80963-9 12
Vol:.(1234567890)www.nature.com/scientificreports/
For the baseline and product use conditions, sampling and particle counting started when all study participants
were seated. The sampling methods and analytical analysis have been previously published19,41 with details
provided in the Supplemental Methods. A total of four air samplers (labelled Air Sampler #1–4) were placed
117 cm above the floor, in the general breathing zone of seated participants, to sample the room air (Fig. 5). The
particle sampler was placed 81.3 cm above the floor. Particle number concentrations were obtained on a minute
by minute basis from an AeroTrak model 9306 airborne particle counter (0.3 to 25 µm) (TSI, Shoreview, MN)
with an isokinetic sampling inlet (Fig. 5; labeled as Particle Counter). Results are provided as particle number
concentration per c m3.
Statistical analysis. Descriptive statistics were provided for absolute change from baseline for each selected
constituent by study group and product use condition (prescribed use and ad libitum use). Paired t-tests were
used to test for the difference in constituent concentration between baseline and during product use, for all
groups. All values found below the limit of detection (LOD) were analyzed at LOD. For comparison of baseline
concentrations of constituents between ventilation concentrations within a group and between groups ANOVA
was used. Significance for the difference in constituent concentration (baseline and during product use) was set
at p < 0.05. For particle number concentration, p-values and 2-sided 90% confidence intervals (Cis) for the mean
treatment difference were provided, in addition to descriptive statistics. All analyses were performed with SAS
9.4 (SAS Institute, Cary, NC, USA).
Received: 20 August 2020; Accepted: 23 December 2020
References
1. Bam, T.S. et al. 2014. Position statement on electronic cigarettes or electronic nicotine delivery systems. Int J Tuberc Lung Dis. 18:
5–7 (2014).
2. McAuley, T. R., Hopke, P. K., Zhao, J. & Babaian, S. Comparison of the effects of e-cigarette vapor and cigarette smoke on indoor
air quality. Inhal Toxicol. 24, 850–857 (2012).
3. Schripp, T., Markewitz, D., Uhde, E., Salthammer, T. 2013. Does e-cigarette consumption cause passive vaping? Indoor Air. 23,
25–31 (2013).
4. Czogala, J. et al. Secondhand exposure to vapors from electronic cigarettes. Nicotine Tob Res. 16, 655–662 (2014).
5. Geiss, O., Bianchi, I., Barahona, F. & Barrero-Moreno, J. Characterisation of mainstream and passive vapours emitted by selected
electronic cigarettes. Int J Hyg Environ Health. 218, 169–180 (2015).
6. Zwack, L.M. , Stefaniak, A. B., LeBouf, R. F. 2017. Evaluation of chemical exposures at a vape shop. U.S. Department of Health
and Human Services, Centers for Disease Control and Prevention, National Institute for Occupational Safety and Health. pp.
2015–0107–3279 (2017).
7. Nguyen, C., Li, L., Sen, C. A., Ronquillo, E. & Zhu, Y. Fine and ultrafine particles concentration in vape shops. Atmos Environ. 211,
159–169 (2019).
8. Khachatoorian, C. et al. Identification and quantification of electronic cigarette exhaled aerosol residue chemicals in field sites.
Environ Res. 170, 351–358 (2019).
9. Balbe, M, et al. 2014. Cigarettes vs. e-cigarettes: Passive exposure at home measured by means of airborne marker and biomarkers.
Environ Res. 135:76–80 (2014). https://doi.org/10.1016/j.envres.2014.09.005.
10. Fernández, E. et al. Particulate matter from electronic cigarettes and conventional cigarettes: a systematic review and observational
study. Curr Environ Health Rpt. 2, 423–429 (2015).
11. Chorti, M. S. et al. Effects of active and passive electronic and tobacco cigarette smoking on lung function. Toxicol Lett. 211, S64
(2012).
12. Kouretas, D. et al. Effects of electronic cigarette and tobacco cigarette smoking on complete blood count. Toxicol Lett. 211, S64
(2012).
13. Flouris, A. D. et al. Acute effects of electronic and tobacco cigarette smoking on complete blood count. Food Chem Toxicol. 50,
3600–3603 (2012).
14. Flouris, A. D. et al. Acute impact of active and passive electronic cigarette smoking on serum cotinine and lung function. Inhal
Toxicol. 25, 91–101 (2013).
15. Johnson, J. M. et al. A biomonitoring assessment of secondhand exposures to electronic cigarette emissions. Int J Hyg Environ
Hlth. 222, 816–823 (2019).
16. Schober, W. et al. Use of electronic cigarettes (e-cigarettes) impairs indoor air quality and increases FeNO levels of e-cigarette
consumers. Int J Hyg Environ Hlth. 217, 628–637 (2014).
17. O’Connell, G., Colard, S., Cahours, X. & Pritchard, J. D. An assessment of indoor air quality before, during and after unrestricted
use of e-cigarettes in a small room. Int J Environ Res Pub Hlth. 12, 4889–4907 (2015).
18. Maloney, J. C. et al. Insights from two industrial hygiene pilot e-cigarette passive vaping studies. J Occup Environ Hyg. 13, 275–283
(2016).
19. Liu, J. et al. 2017. Determination of selected chemical levels in room air and on surfaces after the use of cartridge- and tank-based
e-vapor products or conventional cigarettes. Int J Environ Res Pub Hlth. 4:969 (2017).
20. Protano, C., Manigrasso, M., Avino, P. & Vitali, M. Second-hand smoke generated by combustion and electronic smoking devices
used in real scenarios: ultrafine particle pollution and age-related dose assessment. Environ Int. 107, 190–195 (2017).
21. Protano, C. et al. Environmental electronic vape exposure from four different generations of electronic cigarettes: airborne par-
ticulate matter levels. Int J Environ Res Pub Hlth. 15, 2172 (2018).
22. Lampos, S. et al. 2019. Real-time assessment of e-cigarettes and conventional cigarettes emissions: aerosol size distributions, mass
and number concentrations. Toxics. 7,45 (2019).
23. Van Drooge, B. L., Marco, E., Perez, N., Grimalt, J. O. 2019. Influence of electronic cigarette vaping on the composition of indoor
organic pollutants, particles, and exhaled breath of bystanders. Env Sci Pol Res. 26:4654–4666 (2019).
24. Long, G. A. Comparison of select analytes in exhaled aerosol from e-cigarettes with exhaled smoke from a conventional cigarette
and exhaled breaths. Int J Environ Res Pub Hlth. 11, 11177–11191 (2014).
25. Marco, E. & Grimalt, J. O. A rapid method for the chromatographic analysis of volatile organic compounds in exhaled breath of
tobacco cigarette and electronic cigarette smokers. J Chromat A. 1410, 51–59 (2015).
Scientific Reports | (2021) 11:1736 | https://doi.org/10.1038/s41598-021-80963-9 13
Vol.:(0123456789)www.nature.com/scientificreports/
26. St Helen, G., Havel, C., Dempsey, D.A., Jacob, P. 3 rd, Benowitz, N.L. Nicotine delivery, retention and pharmacokinetics from various
electronic cigarettes. Addiction 111, 535–544 (2016).
27. Samburova, V. et al. Aldehydes in exhaled breath during e-cigarette vaping: pilot study results. Toxics. 6(3), 46 (2018).
28. Papaefstathiou, E., Bezantakos, S., Stylianou, M., Biskos, G., Agapiou, A. 2020. Comparison of particle size distributions and volatile
organic compounds exhaled by e-cigarette and cigarette users. J Aerosol Sci. 141:105487 (2020).
29. Hess, I. M. R., Lachireddy, K. & Capon, A. A systematic review of the health risks from passive exposure to electronic cigarette
vapour. Public Health Res. Pract. 26, 1–9 (2016).
30. Tzatzarakis, M. N. et al. Acute and short term impact of active and passive tobacco and electronic cigarette smoking on inflam-
matory markers. Toxicol Lett. 221, S86 (2013).
31. ASHRAE/ANSI Standard 62.1–2016. 2016. Ventilation for Acceptable Indoor Air Quality. American Society of Heating, Refrig-
erating and Air-Conditioning Engineers, Inc. ISSN 1041–2336.
32. Ingebrethsen, B. J., Cole, S. K. & Alderman, S. I. Electronic cigarette aerosol particle concentration and size distribution in the
mainstream of e-cigarettes. Inhal Toxicol. 24, 976–984 (2012).
33. Costello, B. de Lacy. et al. A review of the volatiles from the healthy human body. J Breath Res. 8:014001 (2014).
34. ICH. International Conference on Harmonisation. Guidance for Industry E6 Good Clinical Practice: Consolidated Guidance.
https://www.fda.gov/downloads/drugs/guidances/ucm073122. (2018).
35. Williams, M., Villarreal, A., Bozhilov, K., Lin, S. & Talbot, P. Metal and silicate particles including nanoparticles are present in
electronic cigarette cartomizer fluid and aerosol. PLoS ONE 8, e57987 (2013).
36. Goniewicz, M. L. et al. Levels of selected carcinogens and toxicants in vapour from electronic cigarettes. Tob Control. 23, 133–139
(2014).
37. Kosmider, L. et al. Carbonyl compounds in electronic cigarette vapors: Effects of nicotine solvent and battery output voltage.
Nicotine Tob Res. 16, 1319–1326 (2014).
38. Tayyarah, R. & Long, G. A. Comparison of select analytes in aerosol from e-cigarettes with smoke from conventional cigarettes
and with ambient air. Regul Toxicol Pharmacol. 70, 704–710 (2014).
39. U.S. Food and Drug Administration. Harmful and potentially harmful constituents in tobacco products and tobacco smoke:
Established list. Fed Reg. 77 (No 64), 20034–20037 (2012).
40. U. S. Food and Drug Administration. Harmful and potentially harmful constituents in tobacco products: Established list; proposed
additions; request for comments. Fed Reg. 84 (No. 150), 38032–38035 (2019).
41. Oldham, M. J. Development/verification of methods for measurement of exhaled breath and environmental e-cigarette vapor.
Regul Toxicol Pharmacol. 85, 55–63 (2017).
Acknowledgements
The authors would like to thank the staff at Inflamax Research Limited (Mississauga, ON, Canada; DBA Cliantha
Research) and Enthalpy Analytical Inc. (Durham, NC, USA) for clinical conduct and sample analysis, respectively.
Author contributions
MJO analyzed/interpreted the data and drafted the manuscript. AS helped analyzed the data and draft the
manuscript. JC helped design the study, developed the statistical analysis plan, and analyzed the data. GC helped
design the study, analyzed and interpreted the data. BE, and DH help design the study and monitored the study
conduct. All authors critically edited and approved the final manuscript.
Competing interests
All authors were either employees or consultants to JUUL Labs., Inc. which produces and markets JL ENDS
products when the study conducted. This study was funded by JUUL Labs., Inc.
Additional information
Supplementary Information The online version contains supplementary material available at https://doi.
org/10.1038/s41598-021-80963-9.
Correspondence and requests for materials should be addressed to M.J.O.
Reprints and permissions information is available at www.nature.com/reprints.
Publisher’s note Springer Nature remains neutral with regard to jurisdictional claims in published maps and
institutional affiliations.
Open Access This article is licensed under a Creative Commons Attribution 4.0 International
License, which permits use, sharing, adaptation, distribution and reproduction in any medium or
format, as long as you give appropriate credit to the original author(s) and the source, provide a link to the
Creative Commons licence, and indicate if changes were made. The images or other third party material in this
article are included in the article’s Creative Commons licence, unless indicated otherwise in a credit line to the
material. If material is not included in the article’s Creative Commons licence and your intended use is not
permitted by statutory regulation or exceeds the permitted use, you will need to obtain permission directly from
the copyright holder. To view a copy of this licence, visit http://creativecommons.org/licenses/by/4.0/.
© The Author(s) 2021
Scientific Reports | (2021) 11:1736 | https://doi.org/10.1038/s41598-021-80963-9 14
Vol:.(1234567890)You can also read