Royal Bank of Canada Investor Presentation - RBC

Page created by Elizabeth Griffith
 
CONTINUE READING
Royal Bank of Canada Investor Presentation - RBC
Royal Bank of Canada
Investor Presentation
Q1/2021

All amounts are in Canadian dollars unless otherwise indicated and are based on financial statements prepared
in compliance with International Accounting Standard 34 Interim Financial Reporting, unless otherwise noted.
Our Q1 2021 Report to Shareholders and Supplementary Financial Information are available on our website at:
http://www.rbc.com/investorrelations.
Royal Bank of Canada Investor Presentation - RBC
Caution regarding forward-looking statements

From time to time, we make written or oral forward-looking statements within the meaning of certain securities laws, including the “safe harbour” provisions of the
United States Private Securities Litigation Reform Act of 1995 and any applicable Canadian securities legislation. We may make forward-looking statements in this
presentation, in other filings with Canadian regulators or the SEC, in reports to shareholders, and in other communications, including statements by our President
and Chief Executive Officer. Forward-looking statements in this presentation include, but are not limited to, statements relating to our financial performance
objectives, vision and strategic goals, investment activity in the oil & gas sector, and the potential continued impacts of the coronavirus (COVID-19) pandemic on our
business operations, financial results and financial condition, and on the global economy and financial market conditions, including projected economic indicators for
2020 with respect to Canada, the United States and the Euro Area. The forward-looking information contained in this presentation is presented for the purpose of
assisting the holders of our securities and financial analysts in understanding our financial position and results of operations as at and for the periods ended on the
dates presented, as well as our financial performance objectives, vision and strategic goals, and may not be appropriate for other purposes. Forward-looking
statements are typically identified by words such as “believe”, “expect”, “foresee”, “forecast”, “anticipate”, “intend”, “estimate”, “goal”, “plan” and “project” and similar
expressions of future or conditional verbs such as “will”, “may”, “should”, “could” or “would”.
By their very nature, forward-looking statements require us to make assumptions and are subject to inherent risks and uncertainties, which give rise to the possibility
that our predictions, forecasts, projections, expectations or conclusions will not prove to be accurate, that our assumptions may not be correct and that our financial
performance objectives, vision and strategic goals will not be achieved. We caution readers not to place undue reliance on these statements as a number of risk
factors could cause our actual results to differ materially from the expectations expressed in such forward-looking statements. These factors – many of which are
beyond our control and the effects of which can be difficult to predict – include: credit, market, liquidity and funding, insurance, operational, regulatory compliance
(which could lead to us being subject to various legal and regulatory proceedings, the potential outcome of which could include regulatory restrictions, penalties and
fines), strategic, reputation, legal and regulatory environment, competitive and systemic risks and other risks discussed in the risk sections and Significant
developments: COVID-19 section of our annual report for the fiscal year ended October 31, 2020 (the 2020 Annual Report) and the Risk management and Impact of
COVID-19 pandemic sections of our Q1 2021 Report to Shareholders; including business and economic conditions, information technology and cyber risks,
Canadian housing and household indebtedness, geopolitical uncertainty, privacy, data and third party related risks, regulatory changes, environmental and social
risk (including climate change), and digital disruption and innovation, culture and conduct , the business and economic conditions in the geographic regions in which
we operate, the effects of changes in government fiscal, monetary and other policies, tax risk and transparency, environmental and social risk, and the emergence of
widespread health emergencies or public health crises such as pandemics and epidemics, including the COVID-19 pandemic and its impact on the global economy
and financial market conditions and our business operations, and financial results, condition and objectives.
We caution that the foregoing list of risk factors is not exhaustive and other factors could also adversely affect our results. When relying on our forward-looking
statements to make decisions with respect to us, investors and others should carefully consider the foregoing factors and other uncertainties and potential events.
Material economic assumptions underlying the forward looking-statements contained in this presentation are set out in the Economic, market and regulatory review
and outlook section and for each business segment under the Strategic priorities and Outlook headings in our 2020 Annual Report, as updated by the Economic,
market and regulatory review and outlook and Impact of COVID-19 pandemic sections of our Q1 2021 Report to Shareholders. Except as required by law, we do not
undertake to update any forward-looking statement, whether written or oral, that may be made from time to time by us or on our behalf.
Additional information about these and other factors can be found in the risk sections and Significant developments: COVID-19 section of our 2020 Annual Report
and the Risk management and Impact of COVID-19 pandemic sections of our Q1 2021 Report to Shareholders.
Information contained in or otherwise accessible through the websites mentioned does not form part of this presentation. All references in this presentation to
websites are inactive textual references and are for your information only.

1                                                                                                                                                                       RBC
Royal Bank of Canada Investor Presentation - RBC
About RBC
Royal Bank of Canada Investor Presentation - RBC
The RBC story
          Diversified business  Well-diversified across businesses, geographies and client segments
          model, scale and      Able to capitalize on opportunities created by changing market dynamics and economic conditions
          leading client        Wide breadth of products and capabilities to meet our clients’ financial needs and build deep, long-term
          franchises             relationships
          Market leader with a  Market leader in Canada and one of the largest financial institutions globally(1)
          focused growth
                                Clear strategy for continued long-term growth in Canada, the U.S. and select global markets
          strategy
          Financial strength                               Track record of earnings and dividend growth while maintaining a disciplined approach to risk and cost
          underpinned by                                    management
          prudent risk and                                 Credit ratings amongst the highest globally
          cost management                                  Strong capital position and a high-quality liquid balance sheet
                                                           Long history of innovation and proven ability to adapt to industry trends
          Innovation is in our                             Investments in technology allow us to drive efficiencies and deliver an exceptional client experience
          DNA                                              Focused on simplifying, digitizing and personalizing our products to make it easier for clients and
                                                            employees to do business, and to lower costs
                                                           Delivering signature programs with measurable social and environmental outcomes
                                                           Committed to accelerating clean economic growth – contributed $25.9 billion(2) of our $100 billion
                                                            sustainable financing target by 2025 to help support a transition to a low-carbon economy
                                                           Expanded ESG reporting suite: RBC’s inaugural 2019 Enterprise D&I(3) Report, first stand-alone TCFD(4)
                                                            Report, our first Human Rights Position Statement and first SASB(5) Index.
          Leading corporate                                Powered by our technology partner, FutureFit AI, RBC Upskill will now assist youth in self-discovering
                                                            their career possibilities and potential. It will do so by providing tailored advice/recommendations on an
          citizen
                                                            ongoing basis, aligned to their confidentially-inputted skills, interests, and experiences. The value it
                                                            provides is more efficient, continuous, and effective ‘upskilling’ for a young person’s next job opportunity
                                                           $142 million given globally through cash donations and community investments, including support to
                                                            mitigate the economic impact of COVID-19.
                                                           Our annual Employee Giving campaign went virtual this year with 82% of employees participating in
                                                            raising $23 million for over 5,000 charities across

(1) Based on market capitalization as of January 29, 2021. (2) 2019 ESG (Environment, Social and Governance) Report. (3) Diversity & Inclusion. (4) Task Force on Climate-related Financial Disclosures. (5) Sustainability Accounting Standards Board.

3    | ABOUT RBC                                                                                                                                                                                                                                          RBC
Royal Bank of Canada Investor Presentation - RBC
Market leader with a focused strategy for growth

      Largest in Canada(1)                                   Top 15 Globally(1)                   17 Million Clients
       A market leader across all key                        One of the 15 largest global banks   Served by 86,000+ employees
       businesses                                            by market capitalization with        worldwide
                                                             operations in 36 countries

        Purpose
        Help clients thrive and communities prosper

        Vision
        To be among the world’s most trusted and successful financial institutions
        Strategic Goals

                              In Canada: To be the undisputed leader in financial services

                              In the United States: To be the preferred partner to corporate, institutional and high
                              net worth clients and their businesses

                              In Select Global Financial Centres: To be a leading financial services partner
                              valued for our expertise

(1) Based on market capitalization as at January 29, 2021.

4    | ABOUT RBC                                                                                                                RBC
Royal Bank of Canada Investor Presentation - RBC
Diversified business and geographic model with client-leading franchises

Earnings by Business Segment(1)                                                                                  Revenue by Geography
Latest twelve months ended January 31, 2021                                                                      Latest twelve months ended January 31, 2021

                        Investor &
                         Treasury
                         Services
                            4%
                                Insurance
                                   7%
                                                                                                                                           International
                                                                                                                                                17%
                                                                Personal &
                       Wealth                                   Commercial
                                                                    Personal &
                     Management                                  Banking
                                                                    Commercial
                        19%                                               Banking
                                                                           45%                                                          U.S.
                                 Capital                                                                                                                                         Canada
                                                                                                                                                                                 Canada
                                 Markets                                                                                              U.S.                                        58%
                                                                                                                                      25%

                                          Capital
                                          Markets
                                           25%

(1) Amounts exclude Corporate Support. These are non-GAAP measures. For more information, refer to Results by business segment section of our 2020 Annual Report and slide 58.

5   | ABOUT RBC                                                                                                                                                                           RBC
Royal Bank of Canada Investor Presentation - RBC
Strong financial profile
                                                   Maintaining a strong capital position with a disciplined approach to risk

Resilient Earnings                                                                                                      Premium Return on Equity(1)
Net income ($ billions)                                                                                             PCL (2) 0.23%                 0.31%             0.63%                              0.26%               0.07%
                                                                                                                    NIM    (3)   1.64%            1.61%             1.55%                              1.59%               1.50%
                        12.9
      12.4                                                                                                                                                                                                                  18.6%
                                         11.4                                                                                    17.6%                                                                    17.6%
                                                                                                                                                   16.8%

                                                                                                                                                                      14.2%

                                                                              3.5               3.8

     2018              2019              2020                               Q1/20             Q1/21                               2018              2019               2020                               Q1/20             Q1/21

Strong Capital Position                                                                                                 Strong Leverage and Liquidity Ratios
                                                                                                                                 Leverage Ratio                                                                          4.8%
                                                  15.3%                 15.5%                15.5%
      14.9%                 14.6%                                                                                                Liquidity Coverage Ratio                                                               141%
      12.0%                                       12.0%                 12.5%                12.5%
                            11.7%
                                                                                                                         Credit Ratings Amongst the Highest Globally

                                                                                                                                                              Moody’s                S&P               DBRS                 Fitch
                                                                                                                          Legacy senior
                                                                                                                                                                 Aa2                 AA-            AA (high)               AA+
                                                                                                                          long-term debt(4)
                                                                                                                          Senior long-term
                                                                                                                                                                  A2                   A                 AA                  AA
                                                                                                                          debt(5)
      Q1/20               Q2/20                   Q3/20         Q4/20          Q1/21
                                                                                                                          Outlook                               Stable             Stable              Stable            Negative
                    Total Capital                  Common Equity Tier 1 (CET1)

(1) Return on Equity (ROE). This measure does not have a standardized meaning under GAAP. For further information, refer to the Key performance and non-GAAP measures section of Q1 2021 Report to Shareholders. (2) Provision
for credit losses (PCL) on loans as a % of average net loans and acceptances. (3) Net interest margin (NIM) (average earning assets, net). (4) Ratings (as at February 23, 2021) for senior long-term debt issued prior to September 23,
2018 and senior long-term debt issued on or after September 23, 2018, which is excluded from the Canadian Bank Recapitalization (Bail-in) regime. (5) Ratings (as at February 23, 2021) for senior long-term debt issued on or after
September 23, 2018 which is subject to conversion under the Bail-in regime.

6    | ABOUT RBC                                                                                                                                                                                                                   RBC
Royal Bank of Canada Investor Presentation - RBC
Strong volume growth and market share gains in our largest businesses
    Canadian Banking average loans                                                 Canadian Banking average                                                    Wealth Management (non-U.S.)
    ($ billions) (1)                                                               deposits ($ billions)                                                       AUM and AUA ($ billions)
                                                 6%                                                                          19%                                                                  $155 BN
                                                             488                                                                          472
           431                      459
                                                              88                                                 396
                                     88                                                  364                                                                                                                                      696
             81
                                                                                                                                          220                                                            620
                                                                                                                 176                                                             541            528                     557
                                                                                         161                                                                           485
                                                             400                                                                          252
            350                      371                                                                         220
                                                                                         203
                                                                                                                                                                       $22BN GAM Canadian retail mutual
               $57BN growth over 2 years                                                   $108BN growth over 2 years                                                         fund net sales over 2 years(2)

         Q1/2019                Q1/2020        Q1/2021                                Q1/2019              Q1/2020                     Q1/2021                          Q1/2019                 Q1/2020                   Q1/2021
                         Retail      Wholesale                                                       Personal   Business                                                                       AUA     AUM

    City National (CNB) average                                                  U.S. Wealth Management AUM                                                    Capital Markets equity and debt
    loans and deposits (US$ billions)                                            and AUA (US$ billions)                                                        issuance volumes (US$ billions) (3)
                                                  30%                                                   $109 BN                                                                            $94 BN
                                                             120                                                                                                                                                          22
                                     92                                                                                               487                                                        39
                                                                                                              437
             77                                               68                     378
                                     50                                             $40BN+ AUA from hiring experienced                                                   4
             42                                                                                                                                                                                                          142
                                                                                       Financial Advisors over 2 years                                                                          112
                                     42                       52                                                       131                      152                     66
             35                                                                                107

         Q1/2019       Q1/2020       Q1/2021                                          Q1/2019                  Q1/2020                  Q1/2021                     Q1/2019              Q1/2020                      Q1/2021
               CNB Loans   CNB Deposits                                                                        AUA     AUM                                                             DCM                   ECM
(1) Wholesale includes small business. (2) Investment Funds Institute of Canada (IFIC). January 2021 and RBC reporting. Comprised of long-term and money market prospective qualified mutual funds sold to Retail and Institutional
clients. (3) Dealogic.

7    | ABOUT RBC                                                                                                                                                                                                                 RBC
Royal Bank of Canada Investor Presentation - RBC
Solid results from our U.S. operations
Net Income (US$ millions)                                                                                           U.S. Operations Revenue (US$ billions)(2)
                                                                                                                    Last 12 months ended Q1/2021
                                                  22%
                                                                   33%                                                                                       CNB Net
                                                                                       652                                                                   Interest
                                                                                                                                                             Income
                                                                                                                                                               19%
               536
                                                   489                                                                                                                                     RBC CM
                                                                                                                                                                       Total U.S.           45%
                                                                                       490                                                          RBC WM            $9.0 billion
               345                                                                                                                                  (ex-CNB
                                                   373                                                                                                 NII)
                                                                                                                                                      35%

               104
                                                    55                                 103
                87                                  61                                 59
                                                                                                                                                                                         Other(3)
           Q1/2020                             Q4/2020                             Q1/2021                                                                                                 1%
                             (1)
     RBC CM & Other                CNB          U.S. Wealth Management (excl. CNB)
                                                                                                                    Q1/2021 Highlights
US$ millions (unless otherwise stated)                 Q1/21 YoY       QoQ
                                                                                                                       The U.S. represented 20% or over $2 billion of total bank net
Revenue                                                2,520 10%       14%
                                (4)
                                                                                                                        income over the last 12 months(2)(7)
Pre-Provision, Pre-Tax Earnings                         706   10%      12%
                                                                  (5)                                                       Q1/2021 U.S. earnings were up 22% YoY, driven by Capital
Provisions for Credit Losses (PCL)                      (42) n.m.     n.m.(5)
                                                                                                                             Markets
Net Income                                              652   22%      33%
                                     (4)(6)                                                                            The U.S. represented 25% of total bank revenue in the last 12
Adj. Pre-Provision, Pre-Tax Earnings                    742   10%      11%
                (6)
                                                                                                                        months(2)(7)
Adj. Net Income                                         678   20%      31%
                                            (4)                                                                             Q1/2021 U.S. revenue was up 10% YoY, driven by Capital
Pre-Provision, Pre-Tax Earnings (C$MM)                  907   8%       9%
                                                                                                                             Markets and Wealth Management
Net Income (C$MM)                                       837   19%      29%
                                                (4)(6)                                                                 U.S. PCL on loans ratio of (19 bps), down from 30 bps last
Adj. Pre-Provision, Pre-Tax Earnings (C$MM)             953   7%       8%
                         (6)                                                                                            quarter
Adj. Net Income (C$MM)                                  871   18%      27%

(1) RBC CM & Other net income includes U.S. portions of U.S. Banking, Capital Markets, Wealth Management excluding U.S. Wealth Management (including CNB), Insurance and I&TS. (2) Excludes Corporate Support. Revenue is on
a Tax Equivalent Basis (TEB). These are non-GAAP measures. For more information, see slide 58. (3) Other revenue includes U.S. portions of U.S. Banking, Insurance and I&TS. (4) Pre-provision, pre-tax earnings is revenue net of
policyholder benefits, claims & acquisition expense (PBCAE) and non-interest expenses. This is a non-GAAP measure. For more information, see slide 58. (5) Not meaningful. (6) Adjusted net income and adjusted pre-provision, pre-
tax earnings for every quarter excludes CNB’s amortization of intangibles and integration costs, which were US$26MM/C$34MM after-tax (US$36MM/C$46MM before-tax) in Q1/2021. This is a non-GAAP measure. For more
X
information, see slide 58. (7) Based on C$ figures.

8    | ABOUT RBC                                                                                                                                                                                                              RBC
Royal Bank of Canada Investor Presentation - RBC
Track-record of delivering value to our shareholders
           Financial performance objectives measure our performance against our goal of maximizing total shareholder returns
                                                                                                                                                                                                                        Average(1)
                                                          Medium-Term Objectives
                                                                                                                                                                                                                  3 Years      5 Years

     Profitability
                                                       Diluted EPS growth                                                                7%+                                                                         1%                           3%

                                                                   ROE(2)                                                               16%+                                                                      16.2%                        16.4%

      Capital                                    Capital ratios (CET1 ratio)                                                           Strong                                                                     12.0%                        11.6%
    Management                                        Dividend payout ratio                                                        40% – 50%                                                                        49%                          48%

Dividend(3) and Earnings(4) per Share ($): 2010-20 CAGR ↑8%                                                                           Tangible Book Value & Book Value Per Share ($)(4)
                                                                                            8.36        8.75
                                                                                7.56                              7.82
                                                          6.73       6.78
                                               6.00
                                   5.49                                                                                                                                                                                                        43.3       45.5
                        4.91                                        2010-20 Average Dividend                                                                                                                                       40.1
             4.19                                                                                                                                                                                           32.7        35.8
                                                                    Payout ratio of 47%                                                                                                          31.1
    3.46
                                                                                                                                                                                      25.8
                                                                                                       4.07       4.29                                                    22.2
                                                                                            3.77                                        18.1       17.5        19.5
                                                                     3.24       3.48                                                                                                                                               51.1        54.4       56.8
                                               2.84       3.08                                                                                                                                              43.3        46.4
                        2.28       2.53                                                                                                                                               33.7       39.5
    2.00     2.08                                                                                                                       24.0       24.3        26.5       29.9

 2010 2011 2012 2013 2014 2015 2016 2017 2018 2019 2020                                                                                2010 2011 2012 2013 2014 2015 2016 2017 2018 2019 2020
                      Earnings per share (diluted)                         Dividend per share                                                           Book value per share                  Tangible book value per share

                                           Achieved Solid TSR(5) Performance

                                                                                                         3 Year                     5 Year                              10 Year                         20 Year
                                             RBC                                                             4%                            12%                             11%                             12%
                                             Peer Average                                                  (1)%                             8%                              9%                              8%
(1) Diluted EPS growth is calculated using a Compound Annual Growth Rate (CAGR). ROE, CET1 and dividend payout ratio are calculated using an average. (2) Return on Equity (ROE). This measure does not have a standardized meaning under GAAP. For further
information, refer to the Key performance and non-GAAP measures section of Q1 2021 Report to Shareholders. (3) Dividends declared per common share. Our current quarterly dividend is $1.08. (4) EPS, TBVPS and BVPS for 2010 were determined under Canadian
Generally Accepted Accounting Policies (CGAAP) framework. (5) Annualized TSR is calculated based on the TSX common share price appreciation plus reinvested dividend income. Source: Bloomberg, as at January 29, 2021. RBC is compared to our global peer group.
The peer group average excludes RBC; for the list of peers, please refer to our 2020 Annual Report.

9    | ABOUT RBC                                                                                                                                                                                                                                             RBC
Business Segments
Personal & Commercial Banking
 The financial services leader in Canada                                                                           Q1/2021 Highlights
      #1 or #2 market share in all key product categories
                                                                                                                    Clients (MM)                                                  14+
      Most branches and one of the largest mobile sales networks
       across Canada                                                                                                Branches                                                     1,253
      Superior cross-sell ability                                                                                  ATMs                                                         4,446
 In 16 countries and territories in the Caribbean                                                                  Active Digital (Online and Mobile) Users(2) (MM)               7.8
        3rd largest      bank by       assets(1) in       English Caribbean                                        Employees (FTE)                                            36,000+
 Innovative direct banking to U.S. cross-border clients                                                            Net Loans & Acceptances(1) ($BN)                             493.5
 Ongoing investments to digitize our banking channels
                                                                                                                    Deposits(1) ($BN)                                            490.1
                                                                                                                    AUA(1) ($BN)                                                 315.9

Net Income ($ millions)                                                                                             Revenue by Business Line(3)

                       6,402                                                                                                      Canadian
       6,028                    234                                                                                               Banking
                168                                                                                                                 95%
                                       5,087
                       6,168
      5,860                                       10
                                       5,077                                                                                                 Personal
                                                                                                                                             Banking
                                                                                                                                               72%              Business
                                                                                                                                                                Banking
                                                                                                                                                                  23%

                                                                        1,686           1,793
                                                                                 62              39
                                                                                        1,754
                                                                       1,624
                                                                                                                                                                   Caribbean
                                                                                                                                                                     & U.S.
                                                                                                                                                                    Banking
      2018           2019      2020                             Q1/20      Q1/21                                                                                      5%
                  Canadian Banking                 Caribbean & U.S. Banking

(1) Based on average balances. (2) This figure represents the 90-day active customers in Canadian Banking only. (3) For the quarter ended January 31, 2021.

11 | BUSINESS SEGMENTS                                                                                                                                                             RBC
Personal & Commercial Banking
Strategic Priorities – Building A Digitally-Enabled Relationship Bank™
                                                  Make it easier for clients to access products and services digitally
 Transform How We
                                                  Create capacity and capability to focus on advice, complex servicing and sales, and problem resolution
 Serve Our Clients
                                                  Focus on innovating our branch network

                                                  Grow commercial market share through industry-specific credit strategies
 Accelerate Client                                Target high-growth retirement segment and business succession planning
 Growth                                           Continue to increase client acquisitions including key segments: high net worth, newcomers and students
                                                   and young adults while deepening existing client relationships

                                                  Continue to deliver leading digital capabilities and functionality through our award-winning mobile app
 Rapidly Deliver Digital
                                                  Create partnerships to innovate, making it easier to bank with RBC
 Solutions
                                                  Invest in research and development to understand and meet rapidly changing client expectations

 Innovate to Become                               Accelerate investments to simplify, digitize and automate for clients and employees
 a More Agile and                                 Change or eliminate products and processes that do not add economic or client value
 Efficient Bank                                   Invest in employees to enhance digital, agile and change capabilities

Recent Awards

  North American Retail Bank of the                           Highest in Customer Satisfaction                RBC won 10 out of 11 Ipsos     Awarded ‘Celent Model Bank of the
  year for the 3rd consecutive year;                         Among the Big Five Retail Banks, a               Financial Service Excellence    Year 2020’ in recognition of RBC's
  Best Latin/Caribbean Bank of the                            position RBC has now held for 4                Awards among the Big 5 Banks,   digital strategy and capabilities; it is
   Year; Best Loyalty and Rewards                                 out of the past 5 years(2)                  including Customer Service      the top global award bestowed by
   Strategy for the 2nd consecutive                                                                                   Excellence(3)                         Celent(4)
                 year(1)

(1) Retail Banker International, 2020. (2) J.D. Power, 2020. (3) Ipsos, 2020. (4) Celent Model Bank, 2020.

12 | BUSINESS SEGMENTS                                                                                                                                                          RBC
Personal & Commercial Banking – Canadian Banking
Solid Volume Growth ($ millions)(1)                                                                                                   Superior Cross-Sell Ability
                                                                                                                                       Percent of clients with transaction accounts, investments and
                                                                                                                                       borrowing products(2)

                                                                                                               472                                                       19%
                                                     429                                   396
                                 375
              343

                                                                                                                                                                                                                             13%

                                 440                 467                                   459                 488
              417

             2018               2019               2020                                  Q1/20              Q1/21
                                                                                                                                                                        RBC                                          Peer Average
                                Loans and Acceptances                                  Deposits
#1 or #2 Market Share in All Key Categories(3)                                                                                        Continue to Improve Our Efficiency Ratio(9)

                                                                                        Market
    Product                                                                                                      Rank
                                                                                        share
    Personal Lending(4)                                                                  24.6%                       1
                                                                                                                                                                                                                                                     Peer
    Personal Core Deposits + GICs                                                        20.2%                       2                                                        47.7%                     47.4%                                      Average(10)
                                                                                                                                                   46.4%
    Credit Cards(5)                                                                      28.2%                       1

    Long-Term Mutual Funds(6)                                                            32.3%                       1                                                                                   43.2%
                                                                                                                                                    42.5%
                                                                                                                                                                              41.8%                                                41.9%
    Business Loans ($0-$25MM)(7)                                                         26.9%                       1

    Business Deposits(8)                                                                 24.5%                       1                               2018                      2019                       2020                  YTD 2021
(1) Based on average balances. (2) Canadian Financial Monitor by Ipsos – 18,000 Canadian individuals – data based on Financial Group results for the 12-month period ending January 2021; Cross-sell calculation methodology has been updated from previous quarters
since Q2/19.TFSA is considered an Investment. Peers include BMO, BNS, CIBC and TD. (3) Market share is calculated using most current data available from OSFI (M4), Investment Funds Institute of Canada (IFIC) and Canadian Bankers Association (CBA), and is at
October 2020 and August 2020 except where noted. Market share is of total Chartered Banks except where noted. (4) Personal Lending market share of 6 banks (RBC, BMO, BNS, CIBC, TD and NA) and includes residential mortgages (excl. acquired portfolios) and
personal loans as at August 2020, excludes Credit Cards. (5) Credit cards market share is based on 6 banks (RBC, BMO, BNS, CIBC, TD and NA) as at August 2020. (6) Long-term mutual fund market share is compared to 7 banks (RBC, BMO, BNS, CIBC, TD, NA, and
HSBC) and is at October 2020. (7) Business Loans market share is of 6 Chartered Banks (RBC, BMO, BNS, CIBC, TD and NA) on a quarterly basis and is as of September 2020. (8) Business Deposits market share excludes Fixed Term, Government and Deposit Taking
Institution balances. (9) Effective Q4/2017, service fees and other costs incurred in association with certain commissions and fees earned are presented on a gross basis in non-interest expense. Comparative amounts have been reclassified to conform with this
presentation. (10) Peers include BMO, BNS, CIBC and TD; 2017 through 2020 reflects annual numbers.

13 | BUSINESS SEGMENTS                                                                                                                                                                                                                                          RBC
Wealth Management
Strategic Priorities                                                                                                                        Recent Awards
 Global Asset Management: Deliver investment performance and                                                                                Best Private Banking Services Overall – North America and
  extend leadership position in Canada, while continuing to build and                                                                        Canada
  grow in the U.S. and other key global markets                                                                                              (Euromoney Private Banking and WM Survey, 2021)
 Canadian Wealth Management: Continue to deepen client                                                                                      Best in Serving Business Owners – North America and Canada
  relationships and deliver a differentiated client experience that is                                                                       (Euromoney Private Banking and WM Survey, 2021)
  increasingly digitally-enabled and supported by data-driven                                                                                Best ESG / Impact Investing Services – Canada
  insights                                                                                                                                   (Euromoney Private Banking and WM Survey, 2021)
 U.S. Wealth Management: Leverage the combined strengths of                                                                                 Outstanding Global Private Bank - North America
  City National Bank, RBC Wealth Management U.S. and Capital                                                                                 (Private Banker International Global Wealth Awards, 2020)
  Markets to accelerate growth in the U.S.
                                                                                                                                             Best Private Bank in Canada
 International Wealth Management: In the British Isles,                                                                                     (PWM / The Banker Global Private Banking Awards, 2020)
  accelerate organic market share growth to be a top-tier wealth
  manager, providing solutions and insight to successful wealth                                                                              Best Institutional Trust or Fiduciary Company
  creators. In Asia, continue to drive growth in Asia’s global families                                                                      (WealthBriefing European Awards, 2020)
  by leveraging the global strengths and capabilities of RBC                                                                                 Best Private Bank for Digitally Empowering Relationship
                                                                                                                                             Managers, North America
                                                                                                                                             (PWM’s Global Wealth Tech Awards, 2020)

Cash Earnings ($ millions)(1) (2)                                                                                                           AUA and AUM ($ billions) (3)
                            2,736
         2,458               186
          193                                  2,327
                                                172                                                                                                                                                                                                              1,180
                                                                                                                                                                                            1,100                                         1,107
                                                                                                                                                                     1,062
                                                                                                                                                971
                                                                                                                                                                                                                                                                            890
                            2,550                                                                                                                                                                      836                                           793
         2,265                                                                                                                                                                  756
                                              2,155                                                                                                      665

                                                                                      665                688
                                                                                                42               39
                                                                                     623                649

         2018               2019              2020                                 Q1/20              Q1/21
                                                                                                                                                   2018                   2019                   2020                                         Q1/20                  Q1/21
                                   Net income                              Amortization                                                                                                              AUA            AUM
(1) Cash earnings exclude the after-tax effect of amortization of intangibles. This is a non-GAAP measure. For more information see slide 58. (2) 2019 net income includes the gain on sale of the private debt business of BlueBay ($134 million after-tax). (3) Spot Balances.

14 | BUSINESS SEGMENTS                                                                                                                                                                                                                                                      RBC
Wealth Management – Global Asset Management
                                                          Building a high-performing global asset management business
  Driving top-tier profitability in our largest Wealth Management business
    $547.8BN in client assets
    Investor asset mix of 51% Retail / 49% Institutional client assets
  Extending our lead in Canada
    Largest retail fund company in Canada, ranked #1 in market share capturing 32.5% amongst banks and 16.2% all-in(1)
    Strategic alliance between RBC Global Asset Management and BlackRock Canada connects clients to the largest and broadest
     ETF lineup in Canada
    3rd largest institutional manager of Canadian pension assets(2)
  Delivering strong investment capabilities to support growth
    Top performing investment firm with ~83% of AUM outperforming the benchmark on a 3-year basis(3)
    Continued growth of investment capabilities and innovative solutions for both institutional clients and retail investors

Canadian Retail Mutual Fund AUM ($ billions)                                                                            Diversified Asset Mix
       15.6%      15.8%         15.8%         16.1%        16.1%         16.1%        16.1%         16.2%
                                                                                                                                   Q1/2021 AUM by Client Segment ($ billions)(4)
 320

 300

                                                                                       286.5         288.0      15.0%

 280

                                258.1                       257.6        268.3
 260
       244.2       250.3
 240
                                              232.5                                                             12.0%

 220
                                                                                                                                            17%
 200
                                                                                                                                                                                        Canadian Retail
 180                                                                                                            9.0%

 160

                                                                                                                                                                                        Canadian Institutional
 140

                                                                                                                                    12%
 120                                                                                                            6.0%
                                                                                                                                                $547.8BN               51%
 100

 80
                                                                                                                                                                                        U.S. Institutional
 60                                                                                                             3.0%

 40
                                                                                                                                                                                        International Institutional
 20
                                                                                                                                          20%
  0                                                                                                             0.0%

       Jun-19     Sep-19       Dec-19        Mar-20        Jun-20       Sep-20        Dec-20        Jan-21

                Canadian Mutual Fund Balance(1)                        All-In Market Share(1)

(1) Investment Funds Institute of Canada (IFIC) in January 2021 and RBC reporting. Comprised of long-term funds and money market prospective qualified mutual funds sold to Retail and Institutional clients. (2) Benefits Canada as at
November 2020. (3) As at December 2020, gross of fees. (4) RBC GAM, based on period-end spot balances.

15 | BUSINESS SEGMENTS                                                                                                                                                                                                            RBC
Wealth Management
Canadian Wealth Management                                                                                                               Fee-based Assets per Advisor(1)
                                                                                                                                                   ($ millions)
   Maintain profitable growth with strong pre-tax margin
   #1 High Net Worth and Ultra High Net Worth market share in Canada(1)                                                                             1.7x the Peer
   Canadian leader in fee-based assets per advisor(1)                                                                                                 Average
   Consistently driving revenue per advisor of over $1.6MM per year, 27% above
    Canadian industry average(1)                                                                                                            118
   Strong asset growth complemented by favourable market conditions                                                                                                 71
   Leveraging enterprise linkages to extend market share gains

                                                                                                                                            RBC             Cdn Peer Average
U.S. Wealth Management (including City National)
 RBC Wealth Management U.S.
  7th largest full-service wealth advisory firm in the U.S. as measured by number of financial advisors and 6th largest by assets under
   administration(2)
  Enhancing the client-advisor experience through a digitally-enabled, goals-based planning approach, and strengthening the range of advisory
   solutions and product offerings
  Continuing to attract and onboard new advisors, and clearing relationships while improving advisory productivity and operational efficiency
 City National
  A premier U.S. private and commercial bank that creates a platform for long-term growth in the U.S.
  Operates with a high-touch, branch-light client service model in selected high-growth markets, including: Los Angeles, the San Francisco Bay
   area, Orange County, San Diego, New York, Boston, and Washington DC
  Expanding the CNB business model to selected high-growth markets

International Wealth Management
  Growing market share in target markets
  Enhancing “One RBC” cross-platform connectivity
  Focusing on client service excellence
  Increasing business effectiveness and talent capabilities

(1) Strategic Insight (formerly Investor Economics), October 2020. (2) Source: U.S. wealth advisory firms quarterly earnings releases (10-Q).

16 | BUSINESS SEGMENTS                                                                                                                                                         RBC
Insurance
Strategic Priorities                                                                                                Highlights
 Improve Distribution Effectiveness and Efficiency: By                                                              Among the largest Canadian bank-owned insurance organizations, serving
  enhancing our proprietary distribution channels, growing strategic                                                 more than five million clients globally
  partnerships, and focusing on the delivery of technology and
  operational solutions                                                                                              #1 in individual disability (inforce business) with 32%(1) market share
 Deepen Client Relationships: By continuing to be an innovative,                                                    #2 in individual disability net new sales with 27%(1) market share
  client-focused provider of a full suite of insurance solutions for
  mass underserved, mass affluent and high net worth clients                                                         #2 in sales in the Canadian group annuity market(1)
 Simplify. Agile. Innovate.: By accelerating our digital initiatives’
  time-to-market, improving quality and cost effectiveness                                                           #2 in Segregated fund net sales(2)
 Pursue Select International Opportunities: By continuing to                                                        RBC Guaranteed Investment Funds continue to be one of the fastest
  grow our Longevity business within our risk tolerance                                                              growing segregated fund providers in Canada with YoY growth of 21.6%(2)

Net Income ($ millions)                                                                                             Premiums and Deposits ($ millions)

                                                                                                                                   4,647   4,604    4,950
                       806             831
       775

                                                                                                                                   2,063             2,457
                                                                                                                                            2,189

                                                                                                                                                                           1,542     1,444
                                                                                                                                   2,584    2,415    2,493                  625
                                                                                      201                                                                                              628
                                                                       181
                                                                                                                                                                            917        816

      2018            2019            2020                           Q1/20           Q1/21                                         2018     2019     2020                  Q1/20     Q1/21
                                                                                                                                                Canadian         International

(1) LIMRA Canadian Insurance Survey, 4th Quarter, 2020. (2) Strategic Insights, Insurance Advisory Service Report, January 2021.

17 | BUSINESS SEGMENTS                                                                                                                                                                         RBC
Investor & Treasury Services
   Specialist provider of asset services, a leader                               Strategic Priorities
    in Canadian cash management and
    transaction banking services, and a provider                                   Grow income and market share among Canadian asset managers, investment counsellors,
    of treasury services to institutional clients                                  pension funds, insurance companies, and transaction banking clients
    worldwide
                                                                                   Compete in segments and markets which offer the highest risk-adjusted returns
       Ranked #1 Fund Administrator Overall(1)
       Ranked #1 Asset Servicer in North
                                                                                   Provide our clients seamless digital journeys and secure, robust and continuous service
        America(2) for the second consecutive year
       Named Best Trade Finance Bank in
                                                                                   Design and re-engineer our services to improve client satisfaction, efficiency and risk controls
        Canada for the ninth consecutive year(3)
   Short-term funding and liquidity management
                                                                                   Use technology and data insights to solve our clients’ current and future challenges
    for RBC

Net Income ($ millions)                                                  Average Deposits ($ billions)(4)                                                Efficiency Ratio
                                                                                                                                          204
  741                                                                                                  188                                                             74%
                                                                                161         175                               175                                                    71%
                                                                                                                                                                              69%
                         536                                                                            125                                141                  62%
              475                                                               103         116                               117

                                                                                 59          59         63                     58          63
                                                143        123
 2018        2019       2020                  Q1/20 Q1/21                      2018        2019       2020                   Q1/20      Q1/21                   2018   2019   2020   Q1/21
                                                                                      Client deposits           Wholesale funding deposits

(1) R&M Fund Accounting & Administration Survey, 2020. (2) R&M Investor Services Survey, 2020. (3) Global Finance, 2021. (4) Totals may not add up due to rounding.

18 | BUSINESS SEGMENTS                                                                                                                                                                  RBC
Capital Markets
 A premier global investment bank with core operations across Canada, the U.S., the U.K./Europe, and APAC
     11th largest global investment bank by fees(1)

 Strategically positioned in the largest financial centres, focused on the world’s largest and most mature capital markets encompassing ~80% of the
  global investment banking fee pool(1)

 Recognized by the most significant corporations, institutional investors, asset managers, private equity firms, and governments around the globe
  as an innovative, trusted partner with in-depth expertise in capital markets, banking and finance

Revenue by Business ($ millions)(2)                                         Revenue by Geography(3)                                          Net Income ($ millions)
                                                                                                                                              2,777             2,776
                                   411                                                                                                                 2,666
     312                                                        433                       5%                        Canada
                    325            370           355            315
     378                                                                          16%                25%
                    535                          322                                                                U.S.
                                  573                           531
     542
                                                 606
                    554           507                           581                                                 U.K. & Europe
     599
                    168                          482
                    834            993                          878                                                 Australia, Asia &                                                     1,067
     760                                         656                                                                Other                                                         882
                                                                                          54%
   Q1/20          Q2/20          Q3/20          Q4/20         Q1/21

    Global Equities                      Repo & Secured Financing
    Lending & Other                      Investment Banking
    FICC                                                                                                                                      2018 2019 2020                     Q1/20 Q1/21

(1) Dealogic – fiscal Q1 2021. (2) Global Markets segment revenue has been restated to align select portfolios previously disclosed in Repo and Secured Financing to FICC and Global Equities. Revenue
by business only includes Corporate & Investment Banking and Global Markets, excluding CM Other. (3) For three months ended January 31, 2021.

19 | BUSINESS SEGMENTS                                                                                                                                                                             RBC
Capital Markets
Strategic Priorities
                                                  Be recognized by our clients as an innovative, trusted partner with best-in-class capabilities and expertise
Deepen client relationships as an
innovative, trusted partner        In our Investment Banking business, gain market share across all products by focusing on our top corporate clients and largest
                                                     private capital firms, while continuing to deepen relationships and lead with differentiated content
                                                  Provide clients with strategic advisory & origination and client trading products and services, while supporting them using the
Lead with ideas, advice and                        strength of our lending capabilities
innovation
                                                  Deliver innovative trading solutions by investing in technology, machine learning and artificial intelligence
                                                  Continue to encourage cross-platform and cross-geography collaboration and convergence across businesses and asset
Drive cross platform                               classes
collaboration and convergence
                                                  Continue to strengthen our senior coverage teams

Simplify our business and                         Focus on reviewing our cost base and funding strategy to drive efficiencies
optimize our financial resources                  Optimizing our balance sheet and reallocating resources to businesses that will support higher returns on capital
                                                  Maintain our leadership position in Canada and our position as the Canadian leader in the U.S., our largest market with the
                                                   best opportunity for growth
                                     Continue to be a leader in targeted areas in the U.K., Europe and Australia, Asia & other regions aligned with our global
Invest in talent, culture and brand   expertise
                                     Focus on strengthening our global diversity and inclusion strategy
                                                  Continue to provide Environmental, Social and Governance-related and sustainability advice to clients, including through
                                                   RBC’s commitment to achieve $100 billion in sustainable financing by 2025

Recent Awards                                                                                                     Recent Big Deals

                                                                                                                     RBC Capital Markets acts           RBC Capital Markets acts
                                                                                                                       as Exclusive Financial            as Exclusive Financial
     Best Investment Bank in                    Top 10 in the All-                                                    Advisor to Lone Star on              Advisor and Joint
                                                                              Most Innovative Trading                                                     Bookrunner on Bain
           Canada - 13th                       American Research                                                     the sale of American Bath
                                                                               System for AMOS(3)                                                       Capital’s $2.8 Billion LBO
       consecutive year(1)                         Survey(2)                                                           Group to Centerbridge
                                                                                                                                                                of US LBM

(1) Euromoney, 2020 (2) Institutional Investor, 2020. (3) The Banker, 2020.

20 | BUSINESS SEGMENTS                                                                                                                                                           RBC
Capital Markets
Capital Markets Total Average Assets                                                                               Geographic Diversification Across Loan Book
($ billions)                                                                                                       Average Loans Outstanding by Region ($ billions)(1)

                                                                                                                                                 1,017

                                                                                                                             79                                          78                    65                   (23)
                              821
                                                    777
        716                                                                                     743
                                                                          709
                                                                                                                                                  100                   101
                                                                                                                             83                                                                87                     81
                                                                                                                                                   18                    20
                                                                                                                             16                                                                19                     17
                                                                                                                                                   52                    51
                                                                                                                             41                                                                42                     38

                                                                                                                             26                    30                    30                    26                     26

     Q1/2020               Q2/2020               Q3/2020               Q4/2020               Q1/2021                    Q1/2020               Q2/2020               Q3/2020                Q4/2020               Q1/2021
                                                                                                                            Canada             U.S.          Other International              Total          PCL ($ millions)

                                                                                                                   Earnings Volatility vs. Canadian and U.S. Peers (Standard
Risk-Weighted Assets, Spot ($ billions)                                                                            Deviation / Avg Earnings)(2)

                                                                                                                                                                                                          28.2%
                                                                                                                                                                     24.9%
                              225                   217
        205                                                               209                   212
                                                                                                                                  18.5%

    Q1/2020               Q2/2020               Q3/2020               Q4/2020               Q1/2021                               RBC                          Canadian Peers                          U.S. Peers
(1) Average loans outstanding includes wholesale loans, acceptances, and off balance sheet letters of credit and guarantees for our Capital Markets portfolio, on single name basis. Excludes mortgage investments, securitized
mortgages and other non-core items. This chart has been restated to exclude certain intergroup exposures that are not part of the corporate lending business. This is a non-GAAP measure. For more information see slide 58. (2)
Reflects pre-provision, pre-tax earnings, which is revenue net of PBCAE and non-interest expenses. This is a non-GAAP measure. For more information, please refer to slide 58. Canadian peers include BMO, TD, CIBC, BNS and NA,
US peers include JPM, GS, BAC, Citi and MS.

21 | BUSINESS SEGMENTS                                                                                                                                                                                                      RBC
Risk Review
Prudent risk management
                                          A disciplined approach and diversification have underpinned credit quality

Loan Book Diversified by Portfolio(1)                                                                    PCL Ratio on Impaired Loans (bps)

                 Credit Cards                             Small
                     2%                                  Business                                            45
                                                           1%
                                                                                                             40                                                                                             37
                                                                                                                                                                        Average historical actual
                                                                                                             35                                                         loss rate(2) = 32 bps
                                                                                                                                                    28        29
                                                                                                             30                                                                        27
                                                                                                                                                                           25
                                                                                                             25     22                                                                                                23
                          Wholesale                                                                                                                                                               21
                                                                                                                                          20
                            33%                        Residential                                                              17
                                                                                                             20
                                                       Mortgages                                                                                                                                                                15
                                                                                                             15     PCL ratio on                                                                                                          13
                                                          51%
                                                                                                                    impaired loans
                                                                                                             10

                                                                                                                    Q2/2018

                                                                                                                                Q3/2018

                                                                                                                                          Q4/2018

                                                                                                                                                    Q1/2019

                                                                                                                                                              Q2/2019

                                                                                                                                                                            Q3/2019

                                                                                                                                                                                        Q4/2019

                                                                                                                                                                                                  Q1/2020

                                                                                                                                                                                                            Q2/2020

                                                                                                                                                                                                                      Q3/2020

                                                                                                                                                                                                                                Q4/2020

                                                                                                                                                                                                                                          Q1/2021
                                  Personal
                                   Loans
                                    13%

Breakdown by Region of Total Loans and Acceptances(1)                                                    Breakdown of Canadian Total Loans and Acceptances(1)
                  Other                                                                                                                                                               Atlantic
              International                                                                                                                                                             5%
                                                                                                                              Manitoba/
                   6%
                                                                                                                               Sask.
                                 U.S.                                                                                           6%
                                 16%
                                                                                                                                             Quebec
                                                                                                                                              12%
                                                                                                                                                                                      Ontario
                                                                                                                                                                                       47%
                                                    Canada                                                                                  Alberta
                                                     78%                                                                                     13%

                                                                                                                                                     B.C. and
                                                                                                                                                    Territories
                                                                                                                                                       17%

(1) Loans and acceptances outstanding as at January 31, 2021. Does not include letters of credit or guarantees. (2) Average annual actual loss rate from fiscal 2003 through to the most recent full year.
The information is updated on an annual basis and is based on consolidated results. The Average historical actual loss rate on a continuing operations basis is 0.31%.

23 | RISK REVIEW                                                                                                                                                                                                                                    RBC
ACL reflects our prudent approach to provisioning

Movement in Allowance for Credit Losses on Loans(1) ($ millions)

                                                                  -
                                                                               (97)                                          -
                0.89%
                                                   218
                ACL to
                 L&A                                                     61% P&CB (primarily
                                                                           Retail) and 38%
                                                                           Capital Markets                (322)
                                                                                                                                  0.85%
                                                                                                                                  ACL to
                                                                                                                                   L&A
                   6,115

                                                                                                                                    5,914

               ACL (Q4/20)                PCL on Impaired Loans       PCL on Performing Loans   Net write-offs, FX & Other       ACL (Q1/21)

   ACL as a percentage of loans and acceptances of 0.85% was down 4 bps QoQ, but remains elevated relative to 0.53% at Q1/2020
    reflecting the ongoing uncertainty related to COVID-19
   The $97 million release of reserves on performing loans in Q1/2021 reflects improvements in our credit quality outlook, and
    represents less than 4% of the FY2020 reserve build on performing loans
       The release was primarily due to favourable changes in our credit quality outlook in Canadian Banking Retail and Capital Markets
   Changes in macroeconomic variables and the level of uncertainty related to COVID-19 will continue to impact ACL

(1) Totals may not add due to rounding.

24 | RISK REVIEW                                                                                                                               RBC
Muted wholesale formations partially offset by rising retail formations
Gross Impaired Loans (GIL) ($ millions, bps)                                                                               Key Drivers of GIL (QoQ)

                                                        57                                                                    Total GIL decreased $323 million (down 6 bps QoQ)
                                                                                                                                   New formations were down $21 million QoQ
                                  51
                                                                               47                                            Canadian Banking
            45
                                                                                                     41                       GIL increased $95 million, with higher new formations QoQ in
                                                                                                                               residential mortgages and personal lending, partially reflecting the
                                                                                                                               impact of the roll-off of deferral programs
                                                                                                                             Capital Markets
                                                      $3,857                                                                  GIL decreased $348 million, reflecting resolution of previously
                               $3,529
                                                                            $3,195                                             impaired loans, mainly in the Oil & Gas and Automotive sectors
         $2,936                                                                                   $2,872
                                                                                                                             Wealth Management (including CNB)
                                                                                                                              GIL decreased $56 million, on lower new formations, as well as
                                                                                                                               repayments on previously impaired loans at CNB, primarily in the
                                                                                                                               Consumer Discretionary and Consumer Staples sectors
         Q1/20                 Q2/20                  Q3/20                 Q4/20                 Q1/21

New Formations ($ millions) (1)                                                                                                Net Formations ($ millions)
                                 1,308                 1,265
                                  35                                                                                                                                  (208)
                                                        230                                                                                             530
                                                                                                                                                                                      (206) -

            713                   840
                                                        511                                                                                                                                           (314)       -
                                                                                                    530
            124                                                                551
                                                                                                      21
            137                                          63                     53                                                                                                                                    (125)
            39                                                                                        70
                                   35                                          226                    56                               3,195

            413                   398                   461                    90                    383                                                                                                              2,872            2,872
                                                                               182

          Q1/20                 Q2/20                 Q3/20                  Q4/20                 Q1/21                            Q4/20 GIL         New     Returning to Repayments Write-Offs                      Other        Q1/21 GIL
                                                                                                                                                   Formations Performing
              Canadian Banking                                       Caribbean & U.S. Banking
              Capital Markets                                        Wealth Management
(1) New formations for collectively assessed portfolios in Canadian Banking and Caribbean Banking are net of amounts returned to performing, repayments, sales, FX, and other movements, as amounts are not reasonably determinable.

25 | RISK REVIEW                                                                                                                                                                                                                               RBC
PCL on impaired loans remains below pre-pandemic levels
Total RBC ($ millions, bps)                                          Wealth Management ($ millions, bps)
                    37
                                                                                                      21
                                                                                         8
                                23                                          -1                                     0
       21                                                                                            $43
                                             15                                         $15                        $-          -13
                   $613                                  13
                               $398                                        $(1)
      $338                                                                                                                     $(27)
                                            $251         $218

     Q1/20         Q2/20      Q3/20        Q4/20        Q1/21
                                                                          Q1/20        Q2/20        Q3/20        Q4/20        Q1/21
  Lower provisions QoQ in Capital Markets and Wealth                  Lower provisions QoQ, largely due to recoveries on
   Management, partially offset by higher provisions in Canadian        previously impaired loans in City National Bank mainly in the
   Banking                                                              Consumer Discretionary and Consumer Staples sectors

Canadian Banking ($ millions, bps)                                   Capital Markets ($ millions, bps)
                    30                                                                   94
       26
                                23
                                                         18
                                             14
                                                                            24                        25           27
                                                                                        $272                                    7
                   $339
      $300
                               $264
                                                         $217
                                            $169
                                                                            $61                       $73         $68          $18

     Q1/20         Q2/20      Q3/20        Q4/20        Q1/21              Q1/20       Q2/20        Q3/20        Q4/20        Q1/21
  Retail: Higher provisions QoQ, primarily in personal lending        Lower provisions QoQ, largely due to fewer new impairments
   due to the roll-off of deferral programs. Cards write-offs were      and recoveries on previously impaired loans in the Oil & Gas
   lower QoQ, noting that delinquent cards balances are written         sector
   off after 180 days past due
  Commercial: Higher QoQ, mainly due to a provision on an
   Other Services account

26 | RISK REVIEW                                                                                                                       RBC
Strong underlying credit quality in Canadian Banking (CB)
Canadian Banking PCL on Impaired Loans and Gross Impaired Loans                                                                                                                     CB Retail FICO Score Distribution (Q1/21)
                                                                                                                                                                                                                            720
  Total                                      484.3             26            14             18            29            26              28               784                                                         80%

 PCL on impaired loans increased 4 bps QoQ, but remains below pre-pandemic levels                                                                                                   Credit quality remains high with just 3% of the
 Clients who took deferrals accounted for ~35% of PCL on impaired loans in Q1/21                                                                                                     portfolio with a FICO score below 620

CB Delinquencies By Days Past Due (bps) (3)                                                                                           CB 30-89 Day Delinquencies by Product (bps) (3)
40                                                                                                                                      180                         Q1/20           Q2/20           Q3/20           Q4/20          Q1/21
                                            30-59 Days                60-89 Days
35                                                                                                                                      160
30                                                                                                                                      140
                                                                                                                   9
                                                                                                                                        120
25               10                      11                                                                                             100
20                                                                                         7                                             80
15                                                                                                                                       60
                                                                  5
                                                                                                                  25                     40
10               20                      19                                               17                                             20
 5                                                               11                                                                       0
                                                                                                                                                   Residential         HELOCs             Personal             Cards             Small           Commercial
 0                                                                                                                                                 Mortgages                              Lending                               Business
              Q1/20                   Q2/20                   Q3/20                    Q4/20                    Q1/21                                                                    (Excluding
 30-89 day delinquencies of 34 bps increased 10 bps QoQ, with 30-59 day                                                                                                                  HELOCs)
  delinquencies up 8 bps QoQ
 Greater than 97% of expired deferral balances have resumed payments as  30-89 day delinquencies increased QoQ in all retail products, partially
  performing loans (97% in retail and 99% in commercial and small business) offset by a decrease in the commercial portfolio
(1) Calculated using average net of allowance on impaired loans. (2) Commercial excludes Small Business. (3) Includes restrained accounts, where loans 30-59 days past due result from administrative processes, such as mortgage loans where payments have been
restricted pending payout due to sale or refinancing.

27 | RISK REVIEW                                                                                                                                                                                                                                                   RBC
Canadian residential portfolio has strong underlying credit quality
Q1/2021 Highlights                                                                                    Canadian Banking Residential Lending Portfolio(1)
 Strong underlying quality of uninsured residential mortgage                                                                                  Total ($335.8BN)             Uninsured ($261BN)
  portfolio(1)                                                                                        Mortgage                                     $300.0BN                       $225.2BN
     53% of uninsured portfolio have a FICO score >800                                               HELOC                                         $35.8BN                       $35.8BN
 Greater Toronto Area and Greater Vancouver Area average                                             LTV   (2)                                       51%                            50%
  FICO scores remain above the Canadian average                                                           GVA                                          47%                           46%
 Only 2% of our residential lending portfolio has an LTV >80%                                            GTA                                          48%                           48%
  and FICO score of 720 or lower, and is predominantly all                                            Average FICO Score(1)                            799                           805
  insured
                                                                                                      90+ Days Past Due(1)(3)                        18 bps                        14 bps
 Condominium outstanding balance is 11% of our Canadian                                                  GVA                                        11 bps                         11 bps
  residential lending portfolio
                                                                                                          GTA                                         9 bps                         10 bps

Canadian Residential Mortgage Portfolio(2) ($ billions)                                               Canadian Banking Residential Lending Portfolio(1)
                                             LTV(1)                                                         LTV (2)                                                           FICO Scores
       49%             48%            61%              53%           55%           55%                                          5%
                                                                                                            >80%                                                                   >720
     $154.1
                                       Insured        Uninsured                                                                                                                    681-720
                                       $103.8           $225.2                                                                                                20%
      76%                              (32%)            (68%)                                         65%-80%                                                                      620-680
IFRS 9 range of macroeconomic scenario assumptions (as of January 31)

        Canada Real GDP ($ Trillions)(1)                                                                        Canada Unemployment Rate (%)(3)
 2.4                                                                                                          11

 2.3
                                                                                                               9

 2.2
                                                                                                               7
 2.1

                                                                                                               5
 2.0

 1.9                                                                                                           3

        U.S. Real GDP (US$ Trillions)(2)                                                                        U.S. Unemployment Rate (%)(3)
21.5                                                                                                           11

21.0
                                                                                                                9
20.5

20.0
                                                                                                                7
19.5

19.0
                                                                                                                5
18.5

18.0                                                                                                            3

        Oil price (West Texas Intermediate in US$)                                                              Canadian housing price index
   In our base forecast, we expect oil prices to recover from trough prices in                                In our base forecast, we expect housing prices to increase by 4.9% over
   April 2020 to an average price of $50 per barrel over the next 12 months                                   the next 12 months, with a compound annual growth rate of 4.5% for the
   and $51 per barrel in the following 2 to 5 years. The range of average prices                              following 2 to 5 years. The range of annual housing price growth (contraction)
   in our alternative downside and upside scenarios is $24 to $59 per barrel for                              in our alternative downside and upside scenarios is (29.6)% to 8.0% over the
   the next 12 months and $35 to $52 per barrel for the following 2 to 5 years.                               next 12 months and 4.5% to 11.1% for the following 2 to 5 years.
       For further details, refer to Note 5 of our Q1 2021 Report to Shareholders. (1) Represents the seasonally-adjusted annual rate indexed to 2012 Canadian dollars over the calendar quarters presented. (2)
       Represents the seasonally-adjusted annual rate indexed to 2012 U.S. dollars over the calendar quarters presented. (3) Represents the average quarterly unemployment level over the period.

       29 | RISK REVIEW                                                                                                                                                                                      RBC
Exposure to wholesale sectors most vulnerable to COVID-19 impacts

 Our most vulnerable wholesale exposure represents $36.5 billion or 5% of total loans & acceptances outstanding

                                             Sector Group Information (Q1/21)                                         Sector Exposure Most Vulnerable to COVID-19 (Q1/21)

                                   Loans &
                                                         PCL on Impaired                                          Loans & Acceptances
Select Wholesale                 Acceptances                                                GIL
                                                             Loans                                                    Outstanding
Sectors                          Outstanding
                                                                                                                                                        Select Vulnerable Segments
                                             QoQ                                                                          QoQ         % of Sector
                              $BN(3)                      $MM         bps(1)       $MM            bps         $BN
                                            Growth                                                                       Growth         Group

Commercial Real
                               $60.2          +4%         $11 (2)     7 bps      $361 (2)      60 bps        $10.5         0%            17%        Retail
Estate (CRE)

                                                                                                                                                    Restaurants; Recreation; Hotels; Retail
Consumer
                               $16.4          (1)%          $0            -        $276       168 bps        $10.4         0%            63%        (excluding grocery and home goods);
Discretionary
                                                                                                                                                    Jewelry; certain Textiles & Apparel

Oil & Gas                       $7.4          (2)%        $(11)      (58) bps      $333       449 bps         $7.4        (2)%          100%        All segments

                                                                                                                                                    Aircraft; Airlines; Airports; Passenger-
Transportation                  $7.5          (3)%         $12        63 bps       $142       191 bps         $3.7        (10)%          50%        related Marine Transport; Transit-
                                                                                                                                                    related Ground Transport

                                                                                                                                                    Dental; certain Retail Services; certain
Other Services                 $22.7          (2)%         $29        50 bps       $273       120 bps         $3.1         +4%           14%
                                                                                                                                                    Business Services

Telecommunications
                                $5.2          +3%           $0           -          $6         12 bps         $1.4        (6)%           26%        Film & TV Production; Theaters
& Media

Total                         $119.4          +2%          $41       14 bps       $1,391      117 bps        $36.5        (1)%           31%

(1) Q1/21 PCL annualized. (2) Represents data for the Real Estate and Related sector group. (3) Totals may not add due to rounding.

30 | RISK REVIEW                                                                                                                                                                         RBC
ACL coverage: Lower-risk residential mortgages a large part of our balance sheet
 Allocation of ACL by Product
                                                             Q4 / 2020                                                                       Q1 / 2021

                                                 % of Loans & Acceptances                                                        % of Loans & Acceptances

         Product                Stage 1        Stage 2      Stage 1 & 2      Stage 3          Total             Stage 1        Stage 2      Stage 1 & 2         Stage 3      Total
                          (1)
Residential mortgages             0.1%           1.9%           0.1%          23.8%          0.15%               0.1%            1.9%           0.1%            23.3%       0.15%
Other Retail                      0.9%          12.5%           2.2%          42.7%          2.34%               0.9%           13.9%           2.2%            46.4%       2.36%
    Personal                      0.6%           9.1%           1.3%          45.3%          1.42%               0.6%            9.6%           1.3%            48.8%       1.45%
    Credit cards                  2.6%          24.6%           7.1%             -           7.07%               2.7%           27.3%           7.3%               -        7.33%
    Small business                1.9%           1.9%           1.9%          36.7%          2.44%               1.6%            3.6%           1.9%            40.0%       2.48%
Retail                           0.3%           8.3%            0.6%          29.9%          0.70%               0.2%           8.7%            0.6%            30.9%       0.68%
               (1)
Wholesale                        0.6%           4.1%            1.0%          29.6%          1.33%               0.5%           4.6%            1.0%            31.3%       1.24%
Total ACL                        0.4%           5.9%            0.8%          29.7%          0.89%               0.3%           6.4%            0.7%            31.1%       0.85%

 Allocation of Loans By Product Within Each IFRS 9 Stage
                                                             Q4 / 2020                                                                       Q1 / 2021

                                                  % of Loans & Acceptances                                                       % of Loans & Acceptances

         Product                Stage 1        Stage 2      Stage 1 & 2      Stage 3      Total ($BN)          Stage 1         Stage 2     Stage 1 & 2          Stage 3   Total ($BN)
                          (1)
Residential mortgages            97.3%           2.5%          99.8%           0.2%           342.3             97.3%           2.5%          99.8%              0.2%       351.7
Other Retail                     88.3%          11.4%          99.7%           0.3%           115.3             89.5%           10.2%         99.7%              0.3%       112.6
    Personal                     91.0%           8.8%          99.8%           0.2%           92.0              91.5%           8.3%          99.7%              0.3%        90.5
    Credit cards                 79.7%          20.3%         100.0%           0.0%           17.6              81.1%           18.9%         100.0%             0.0%        16.4
    Small business               72.2%          26.2%          98.4%           1.6%            5.7              82.7%           15.8%         98.4%              1.6%         5.8
Retail                           95.1%           4.7%          99.8%           0.2%           457.7             95.4%           4.3%          99.8%              0.2%       464.3
               (1)
Wholesale                        85.9%          13.0%          99.0%           1.0%           218.7             87.4%          11.8%          99.2%              0.8%       221.9
Total Loans                      92.1%           7.4%          99.5%           0.5%           676.4             92.8%           6.7%          99.6%              0.4%       686.3

(1) Items not subject to impairment are loans held at FVTPL: Residential mortgages (Q1/21: $255MM, Q4/20: $253MM); Wholesale (Q1/21: $10.4BN, Q4/20: $8.6BN).
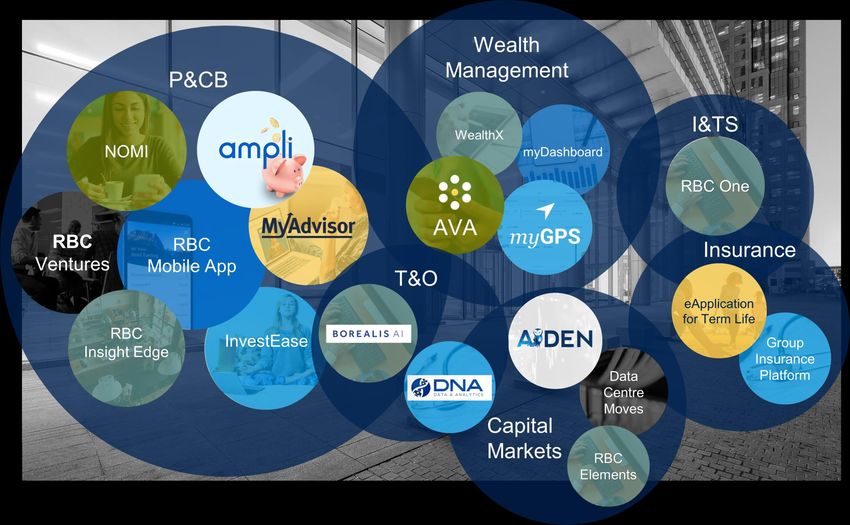
31 | RISK REVIEW                                                                                                                                                                        RBC
Technology @ RBC
Investors value RBC for its industry-leading franchises and innovative approach

                                                 7.8MM active digital users(1)                                                          Data
                                                                                                                                                                                4 Borealis AI labs connected
   Creating More                                                                                                                           &
                                                 2.3MM clients on-boarded                                                                                                         with top universities across
       Value                                         onto MyAdvisor with a                                                             Artificial                                  Canada, with 40+ PhDs
    for Clients                                      personalized plan                                                               Intelligence                               1.5BN+ insights read by
                                                 5.2MM active mobile                        clients(1)                                Insights                                    clients on NOMI in the RBC
                                                     on the RBC Mobile app
                                                                                                                                                                                   Mobile app(2)

        Driving
                                                                                                                                     Innovation
       Efficiency
            &                                    632MM client transactions                                                          Ecosystem                                    6 innovation labs globally
                                                     daily(3)                                                                            &                                        14 RBC Ventures in market
      Operational
                                                                                                                                    Partnerships                                  Top 3 for places to Work in
      Excellence
                                                                                                                                                                                      Tech in Toronto(4)

(1) These figures (in 000s) represent the 90-Day Active customers in Canadian Banking only and are spot values. (2) Insights read on a launch to date basis. (3) Daily average number of transactions. (4) Based on HIRED’s 2019
Global Brand report

33 | TECHNOLOGY @ RBC                                                                                                                                                                                                              RBC
Our technology platforms are enabling all businesses to exceed client expectations

34 | TECHNOLOGY @ RBC                                                          RBC
We have developed a rich innovative ecosystem that attracts top talent

                          Unique Partnerships
                          (FinTech, Big Tech)

  6 Innovation Labs                                  Research
  around the world                                  Institutions

  Fostering Engineering                         RBC Ventures,
   & Innovation Culture                         Incubators and
                                                 Accelerators

                           Digital RBC

35 | TECHNOLOGY @ RBC                                                    RBC
Our 14MM+ Canadian Banking clients are increasingly using our digital channels
          Active Digital Users (000s)(1)                                                      Digital Adoption Rate(2)                                                Active Mobile Users (000s)(1)

                                   5%                                                                           350 bps                                                                           12%

                                                          7,755                                                                                                                                                         5,171
                                   7,601                                                                                                  56.0%                                                   5,031
           7,354                                                                                                   54.0%
                                                                                                                                                                           4,619
                                                                                            52.5%

          Q1/20                   Q4/20                  Q1/21                              Q1/20                  Q4/20                  Q1/21                           Q1/20                  Q4/20                  Q1/21

              Mobile Sessions (000s)(3)                                                    Self-Serve Transactions(4)                                                                      Branches

                                  40%                                                                          500 bps
                                                      107,378                                                                                                                                      0%
                                                                                                                  93.4%                  93.8%
                                99,543
                                                                                                                                                                           1,206
                                                                                                                                                                                                   1,201                  1,200

         76,633                                                                            88.8%
                                                                                                                                                                                                                         33,716
                                                                                                                                                                                                  33,417
                                                                                                                                                                           32,783

          Q1/20                  Q4/20                 Q1/21                              Q1/20                   Q4/20                  Q1/21                             Q1/20                  Q4/20                  Q1/21
                                                                                                                                                                                                   FTE
(1) These figures (in 000s) represent the 90-Day Active customers in Canadian Banking only and are spot values. (2) Digital Adoption rate calculated using 90-day active users. (3) These figures (in 000s) represents the total number of
application logins using a mobile device. (4) Financial transactions only.

36 | TECHNOLOGY @ RBC                                                                                                                                                                                                                RBC
RBC Ventures
Ventures moves RBC
beyond traditional
banking to deliver
unique value for all
Canadians                                                            Helping retirees make
                                                                          connections
                                                                                                          Helping doctors with their billing
                                                                                                                      needs

                                 Public transit arrival times and                                                                        Helps entrepreneurs start their
                                            locations                                                                                              business

                                                             Mobility                     INNOVATIVE
                                                                                                                              Health
                                                                                        PRODUCT LEADER                      & Wellness

                      Connecting consumers to                                                                                                               Helping newcomers be
                        trusted contractors                                                                                                                 successful in Canada
                                                                    PROPRIETARY                                    STRATEGIC
                                                                      REWARDS                                     PARTNERSHIPS

                                                    Home                                                                                  B2B

                  New home searching                                                                                                                         Finding dream jobs for recent
                      made easy                                                                                                                                       graduates
                                                                     DATA AND
                                                                                                                   DIVERSIFIED
                                                                    TECHNOLOGY
                                                                                                                  DISTRIBUTION
                                                                       SCALE

                                                                                         PERSONALIZED
                          Keeping you in the know                                           ADVICE                               B2C
                                                         U.S. Ventures                                                                           Financial literacy for kids and
                             on the little things
                                                                                                                                                             parents

                                                         Making moving                                                           Earning cashback at
                                                          hassle free                                                              local merchants

                                                                                   Amplifying cash back across national
                                                                                                 brands

  38 | RBC VENTURES                                                                                                                                                                          RBC
Environment, Social & Governance (ESG)
ESG performance highlights: Putting our Purpose into practice
                                                      Royal Bank of Canada is a purpose-driven, principles-led organization

          How we deliver value

   Building & attracting talent                                 Sustainable finance and                                Climate change: accelerating                                    Preparing youth for the
    and driving a diverse &                                     responsible investment                                    clean economic growth                                            future of work
        inclusive culture

  • 46% women executives(1) and                           • $8.8 billion in financing for                                                                                         • Through RBC Future Launch,
                                                                                                                  • Enterprise climate change strategy,
    47% women(1) on RBC’s Board                             sustainable bonds and loans,                                                                                            we are dedicating $500 million
                                                                                                                    RBC Climate Blueprint, aims to support
    of Directors                                            representing 64% growth over                                                                                            over 10 years to help young
                                                                                                                    clients in the low-carbon transition
                                                            2019                                                                                                                    people gain meaningful
  • 21% of executives(1)(2) are                                                                                                                                                     employment through work
                                                                                              •                        Joined pilot project on climate risk
    Black, Indigenous and People                          • Focused strategy to integrate ESG                                                                                       experience, skills development
                                                                                                                       scenarios led by the Bank of Canada
    of Colour (BIPOC)                                       across all businesses in Capital                                                                                        and networking; we have
                                                                                                                       and OSFI
                                                            Markets led by a dedicated                                                                                              reached over 2.5 million
  • #4 globally in the Refinitiv                                                                                                                                                    Canadian youth through 500+
                                                            Sustainable Finance Group         •                        Annual TCFD(3) aligned disclosures
    Diversity & Inclusion Index,                                                                                                                                                    partner programs since 2017
    ranking over 9,000 listed                             • Total value of socially responsible • Carbon neutral in our global operations
    companies                                               investments and impact assets                                                 • Committing to invest $50 million
                                                                                                  since 2017
                                                            under management grew to $10.4                                                  from 2020 to 2025 to create
  • Increasing our staffing goals for                               (5)                                                                     meaningful and transformative
                                                            billion                             • 124 organizations supported with over
    BIPOC executives from 20% to                                                                                                            pathways to prosperity for
                                                                                                  $19 million in funding through RBC
    30% with a focus on increasing                        • Published policy restrictions on                                                25,000 BIPOC youth(4)
                                                                                                  Tech for Nature ‒ a multi-year
    Black and Indigenous                                    lending to sensitive sectors,
                                                                                                  commitment by the RBC Foundation to
    representation(4)                                       including coal and the Arctic
                                                                                                  accelerate tech-based sustainability
                                                                                                  solutions
   RBC is recognized as an “Outperformer” or “Leader” by our top tier ESG rating agencies(5) and indices, including:

                                                                                                                                                                                                 ‘A-’ score for our
  Banking industry ranking                              ESG Risk Rating of                                                                            Overall score 78
                                                                                                             “A” Rating                                                                            2020 Climate
     in 98th percentile                                   16.9 (low risk)                                                                             90th percentile                            Change response
(1) Represents data as at October 30, 2020 for our businesses in Canada governed by the Employment Equity Act (Canada); Board composition is reflective as of October 30, 2020. (2) Based on employee self-identification and aligned
to the definitions of the Employment Equity Act in Canada; (3) Task Force on Climate-related Financial Disclosures (TCFD); (4) RBC’s Actions Against Systemic Racism. (5) As of F2020

40 | ESG                                                                                                                                                                                                                       RBC
Our suite of ESG disclosures
Annual voluntary and regulatory ESG performance disclosures

  ESG Performance Report           SASB Index               Public Accountability Statement
                                                                        (PAS)                   City National CSR     Corporate Governance and
                                                                                                      Report      Responsible Investment Annual Report

     RBC Green Bond               RBC Enterprise                                                                 TCFD Report                    Modern Slavery Act
         Report                 Diversity & Inclusion        A Chosen Journey        Employment                                                    Statement
                                       Report                     Report             Equity Report

Position statements and policy and program “backgrounders”

                           RBC Human Rights Position           About Corporate Citizenship suite of policy and     Policy Guidelines for Sensitive Sectors
RBC Climate Blueprint            Statement                              program “backgrounders”                        and Activities (Coal and Arctic)

                             For more details, see our suite of ESG disclosures on our Corporate Citizenship Reporting website.

41 | ESG                                                                                                                                                        RBC
Economic Backdrop
Canada’s fiscal position strong
 Strong rating as a result of fiscal prudence, conservative bank lending practices and a solid economy
 Lowest net debt-to-GDP ratio among G7 peers(1)

Net Debt as % of GDP(1)                                                                                         Canadian GDP by Industry(2)
(2020)                                                                                                          (November 2020)

                                                                                                                                                                           Finance, Insurance & Real
                                                                                                                                                                           Estate
                                                                                                                               12%
                                                                                                                                                                           Manufacturing
                                                                                      177.1                                                                   21%
                                                                                                                     4%                                                    Wholesale and Retail Trade
                                                                             148.8

                                                                                                                8%                                                         Scientific, Technical &
                                                                                                                                                                           Educational Services
                                             106.8     109.7     110.0
                                                                                                                                                                           Public Administration and
                                     98.1
                                                                                                                                                                     10%   Utilities
                                                                                                              7%                                                           Mining, Oil & Gas Extractions

                          54.1
               46.4                                                                                                5%                                                      Construction

                                                                                                                                                               11%         Health Care
                                                                                                                          10%
                                               U.S.
                                      U.K.
                 Canada

                                                                    France

                                                                              Italy
                           Germany

                                                       Average

                                                                                        Japan

                                                                                                                                              12%                          Transportation, Warehousing
                                                         G7

                                                                                                                                                                           Other

(1) Net debt refers to General Government net debt. International Monetary Fund October 2020 Fiscal Monitor. (2) Statistics Canada, RBC Economics Research.

43 | ECONOMIC BACKDROP                                                                                                                                                                                 RBC
You can also read