RPM, Junos Script and STRM integration - Combining three key technologies to provide network assurance
←
→
Page content transcription
If your browser does not render page correctly, please read the page content below
RPM, Junos Script and STRM integration.
Combining three key technologies to provide network assurance
By utilising the capabilities of Junos we can monitor network reliability and centrally report using integrated capability of
Junos scripting.

                                                                                                          © Juniper Networks, Inc.   1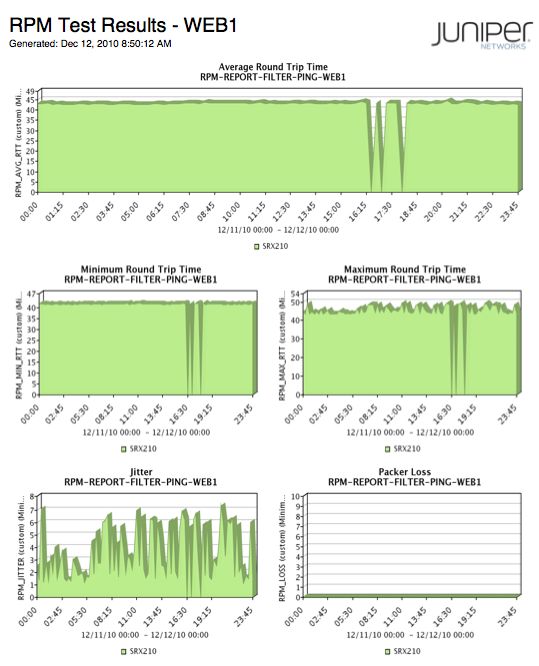
RPM to SYSLOG reporting

Table of Contents
Executive Summary ................................................................................................................................................................ 3
Introduction.............................................................................................................................................................................. 3
Test network topology ............................................................................................................................................................. 4
Real-time Performance Monitor (RPM) configuration ............................................................................................................. 5
Junos Script configuration ....................................................................................................................................................... 6
   Event-Options definition ...................................................................................................................................................... 6
   Event-script creation ........................................................................................................................................................... 7
STRM Configuration ................................................................................................................................................................ 9
   Event value extraction ...................................................................................................................................................... 11
   Event Filtering ................................................................................................................................................................... 12
Report Configuration ............................................................................................................................................................. 13
   Report Event Filter ............................................................................................................................................................ 13
   Report Wizard ................................................................................................................................................................... 14
   Container Definitions ........................................................................................................................................................ 15
Conclusion............................................................................................................................................................................. 17
   Useful Links ...................................................................................................................................................................... 17

                                                                                                                                                            © Juniper Networks, Inc.      2
RPM to SYSLOG reporting

Executive Summary
This whitepaper is aimed at network operators that require the ability to visualize and report on network performance and
availability across multiple points and customers within their network. The solution incorporates key aspects of Junos,
Junos scripting and the Juniper Networks Security Threat Response Manager (STRM). Concepts used in this whitepaper
can be expanded to monitor any aspect of a functional device or network.
This document describes the capability, to measure Round Trip Time (RTT), packet loss and jitter and have it measured
directly from the network device, which will record, and store all test results. Junos scripting capabilities will be used to
locally extract each test result immediately after a successful test run, forwarding results in standard SYSLOG format to
the central server. It is expected the reader will gain a better understanding of RPM, Junos Scripting and the STRM
reporting engine.
The outcome from this document is, through a practical example, will have the reader understand these three key aspects
of Junos capabilities and allow them to tailor the solution to their own specific needs.

Introduction
All Junos devices provide an integrated capability to measure and report on network performance and quality, known as
Real-Time Performance Monitoring or RPM for short. RPM can transmit specific or tailored network traffic to as many as
500 remote network devices, recording the Round Trip Time, Packet Loss and Jitter for each test. However RPM results
can only be viewed from the Junos Command Line Interface, Web GUI or remotely collected using SNMP polling.
RPM results however are perfectly suited to be recorded centrally in a Security Information and Event Manager (SIEM)
server, storing results from as many Junos enabled devices in the network. The Juniper Networks STRM appliance is
purpose built to collect SYSLOG traffic, providing real time reporting or scheduled reports based on the results collected.
RPM however is not capable of forwarding the recorded results to SYSLOG, with only the ability to generate a SYSLOG
or SNMP trap should a test complete or fail to finish.
The aim of this white paper is to leverage the integrated capability of all Junos devices, known as Junos Scripting. Junos
scripts react to local events, allowing the operator to collect information and forward via multiple means (including
SYSLOG) to central servers for alerting, reporting etc. This document will outline the steps to collect, forward to SYSLOG,
visualise and report on all collected test results.

                                                                                                          © Juniper Networks, Inc.   3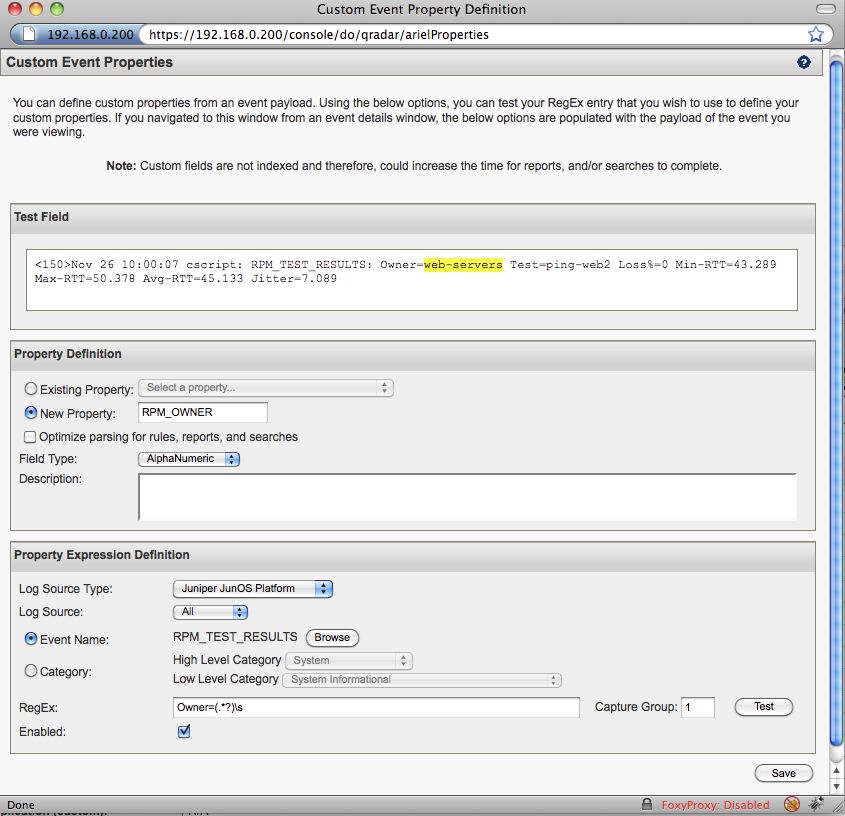
RPM to SYSLOG reporting

Test network topology
For the purposes of testing a basic network topology has been created, including an SRX Secure Router running Junos
version 10.4R1 and a central STRM collector using the 2010.1 release. The network topology is designed to replicate a
basic branch office, however the concepts throughout this document are designed to scale from a single device to a much
larger network or even to individual Virtual Router and Forwarding instances within provider edge (PE) devices in a carrier
network.

            Figure 1: Tested STRM Topology

                                                                                                      © Juniper Networks, Inc.   4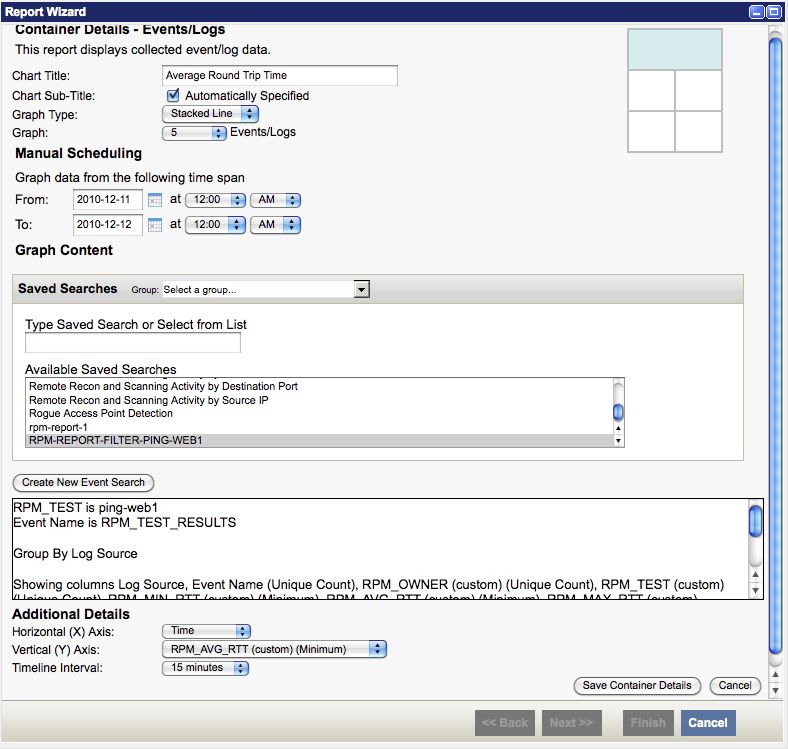
RPM to SYSLOG reporting
Real-time Performance Monitor (RPM) configuration
Additional RPM options RPM is an integrated feature available to all Junos devices such as SRX Secure
Within each functional RPM Routers, EX-Series switches and larger carrier devices such as the MX and T-
group, multiple tests can be run Series. RPM is included in all Junos releases with the network operator free to use
towards specific hosts, using a with no additional licensing requirements. RPM can provide a wealth of
basic ICMP payload, however information, recording round trip times, packet loss and jitter characteristics from
the reader is encouraged to look the device to multiple end-points, either locally or across the Internet. This helps
at additional options beyond the operator gain insight to how the network is really performing.
ICMP such as HTTP-GET, RPM is configured to send specific probes grouped together under a common
HTTP-METADATA-GET and probe owner. Multiple owners can be created allowing tests to be grouped
UDP or TCP pings. together logically or functionally as needed. For the purpose of the whitepaper
RPM allows specific DSCP multiple groups will be created, the Web-Server group and the Database-Server
(QOS Marking) Code points to owner.
be configured, allowing RPM to RPM is configured either from the Junos Command Line or through the integrated
run multiple similar tests across Web GUI, for the purposes of this whitepaper all configuration and output will be
networks configured for Quality conducted from the Command Line Interface. RPM options are configured from
of Service. within the “services rpm” stanza of the Junos configuration hierarchy.
Thresholds can be created, so The configurations below create two separate probe-groups, for our web servers
should a specific test fall outside and database servers. Each group contains two RPM tests, configured to send 10
specific business requirements a ICMP-PING probes every 20 seconds. Upon completion on an RPM test a local
SNMP trap will be triggered to SYSLOG message is generated to indicate success or failure of the test. It is this
alert the network operator. SYSLOG message that will trigger our Junos Script to retrieve the results and
forward to STRM. Commit the following configuration, changing IP addressing
where needed.
Web Server – Probe Group Database Server – Probe Group
services { services {
rpm { rpm {
probe web-servers { probe database-servers {
test ping-web1 { test ping-dns1 {
probe-type icmp-ping; probe-type icmp-ping;
target address 66.102.11.104; target address 220.233.0.4;
probe-count 15; probe-count 10;
test-interval 20; test-interval 20;
history-size 255; history-size 255;
} }
test ping-web2 { test ping-db2 {
probe-type icmp-ping; probe-type icmp-ping;
target address 220.233.2.209; target address 220.233.0.3;
probe-count 15; probe-count 10;
test-interval 20; test-interval 20;
history-size 255; history-size 255;
} }
}
}
To see the results of RPM tests use the following operational mode commands to verify successful operation;
show services rpm history-results
show services rpm probe-results
© Juniper Networks, Inc. 5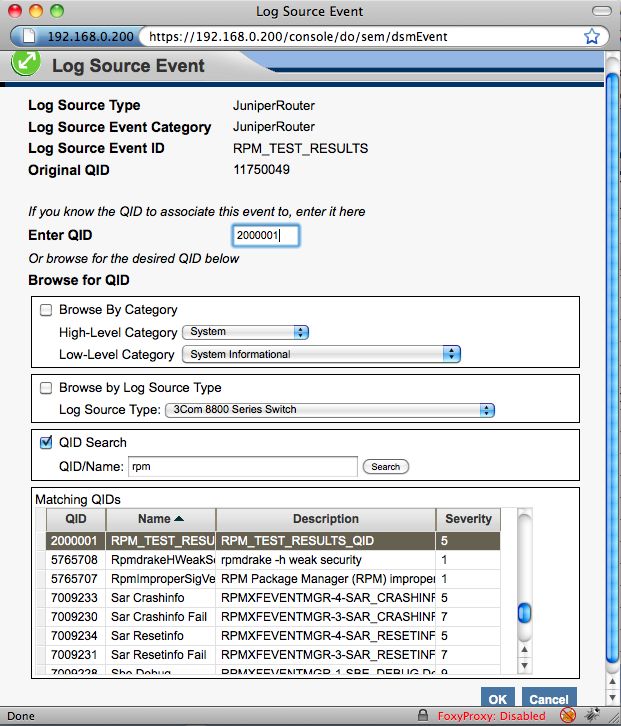
RPM to SYSLOG reporting
Junos Script configuration
Event-Options definition
Junos event scripts are triggered by matching on specific entries that appear in the local messages file stored
on the internal disk. In order to trigger an event script a specific entry needs to be created in the Junos
configuration, linking the SYSLOG message to the script that needs to be executed. In order to execute our
specific script I’ve entered the following configuration change within the event-options stanza of the
configuration hierarchy.
Event-Options configuration – enable rpm-syslog event script.
event-options {
policy rpm-syslog {
events ping_test_completed;
then {
event-script rpm-syslog-event.slax {
arguments {
owner "{$$.test-owner}";
testname "{$$.test-name}";
}
}
}
The configuration above performs the following functions
Creates an event policy called rpm-syslog
Matches on the term ping_test_completed in the messages file (Note, this is case insensitive)
Execute the rpm-syslog-event.slax script (which should be placed into /var/db/scripts/event by the root
user)
Creates two variables that are passed to the script based on the exact values in the triggering event
The ability to populate variables from the SYSLOG event that triggered the script is important, this allows us to
retrieve as much information from the syslog as we need and will later be manipulated directly within the script.
In this example we retrieve the RPM probe owner and the testname, these two need to be utilised as we have
multiple owners each with two unique tests.
Make sure that the Junos device is configured to send SYSLOG events to the STRM server used for collection,
add the following line to the configuration, ensuring to change the IP address as needed.
set system syslog host X.X.X.X any any
By default, STRM will receive/process events from any device that is configured to send events. While this is
suitable for lab testing, for this whitepaper the operator will need to configure a specific Log Source entry under
the Admin tab to provide a more recognisable or valid name in all events. Additionally ensure that the log
source sending events to STRM is not configured to Coalesce events.
© Juniper Networks, Inc. 6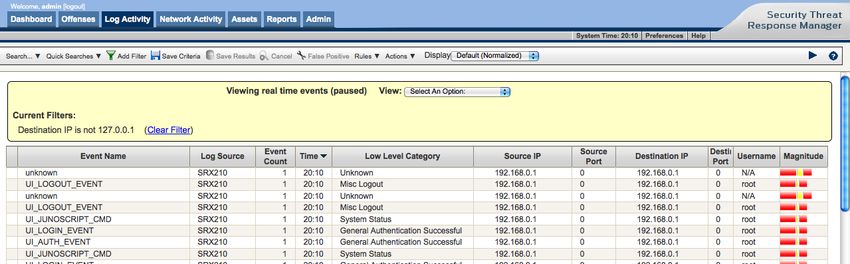
RPM to SYSLOG reporting
Event-script creation
Junos Scripting is a powerful integrated language built into all Junos devices, including SRX secure routers
used for the examples in this document. Junos Script is a standards based language (similar in operation to
Perl or C) that allows the programmer to modify and interpret XML using standard programing syntax. Junos
scripts all using this same common language and syntax and have three separate applications
Op Scripts – allow custom applications to be created and run from the Command Line Interface
Event Scripts – allows the system to execute a script based on events appearing in the local log files
Commit Scripts – perform checks and modify configuration during a commit cycle.
In order to retrieve the RPM test values from stored on the router we will utilise an Event Script to run every
time a successful RPM test is completed, triggered by the text PING_TEST_COMPLETED appearing in the
local messages file. (This message is automatically generated by Junos when the test is completed; failed
tests are logged as PING_PROBE_FAILED and are not included here)
The following script is a very simple example; utilising two parameters passed to the script from the event
policy that triggered its execution. These two variables, owner and testname are key to ensuring the script is
working with the correct and most current information.
Event script – used to retrieve information from RPM history after successful test probe completion
/* rpm-syslog-op-script */
version 1.0;
ns junos = "http://xml.juniper.net/junos/*/junos";
ns xnm = "http://xml.juniper.net/xnm/1.1/xnm";
ns jcs = "http://xml.juniper.net/junos/commit-scripts/1.0";
import "../import/junos.xsl";
/* Populate arguments passed from event-options */
param $owner;
param $testname;
match / {
{
/* Load current Probe results */
var $get-probe-results = { $owner; $testname;}
var $probe-results = jcs:invoke($get-probe-results);
var $returned-owner = $probe-results/probe-test-results/owner;
var $returned-testname = $probe-results/probe-test-results/test-name;
var $target-address = $probe-results/probe-test-results/target-address;
var $probe-type = $probe-results/probe-test-results/probe-type;
var $loss-percentage = $probe-results/probe-test-results/probe-test-current-results/probe-test-generic-results/loss-percentage;
var $min-delay = $probe-results/probe-test-results/probe-test-current-results/probe-test-generic-results/probe-test-rtt/probe-summary-results/min-delay div 1000;
var $max-delay = $probe-results/probe-test-results/probe-test-current-results/probe-test-generic-results/probe-test-rtt/probe-summary-results/max-delay div 1000;
var $avg-delay = $probe-results/probe-test-results/probe-test-current-results/probe-test-generic-results/probe-test-rtt/probe-summary-results/avg-delay div 1000;
var $jitter = $probe-results/probe-test-results/probe-test-current-results/probe-test-generic-results/probe-test-rtt/probe-summary-results/jitter-delay div 1000;
var $stddev = $probe-results/probe-test-results/probe-test-current-results/probe-test-generic-results/probe-test-rtt/probe-summary-results/stddev-delay div 1000;
expr jcs:syslog("external.info","RPM_TEST_RESULTS: ","Owner=",$returned-owner," Test=",$returned-testname," Loss%=",$loss-percentage," Min-RTT=",$min-delay," Max-
RTT=",$max-delay," Avg-RTT=",$avg-delay," Jitter=",$jitter);
}
}
The script when run, executes the show rpm probe-results owner test operational mode command, substituting
the two parameters passed to the script. Once the command is completed twelve separate variables are
© Juniper Networks, Inc. 7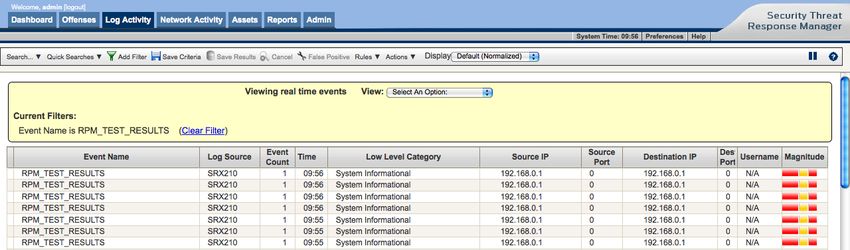
RPM to SYSLOG reporting

populated with the relevant test results. The script then outputs (using the function jcs:syslog) the formatted
syslog message to both the local messages file and any configured syslog server. The resulting syslog
message appears as follows

Nov 29 19:48:55 SRX1 cscript: RPM_TEST_RESULTS: Owner=database-servers Test=ping-db2 Loss%=0 Min-RTT=418.53
Max-RTT=951.745 Avg-RTT=734.379 Jitter=533.215

It is important to note that the field RPM_TEST_RESULTS: was deliberately added in this exact position, as
this is the specific field in a SYSLOG message that STRM will match to determine the Log Source Event ID
which will be defined in the following steps.

                                                                                               © Juniper Networks, Inc.   8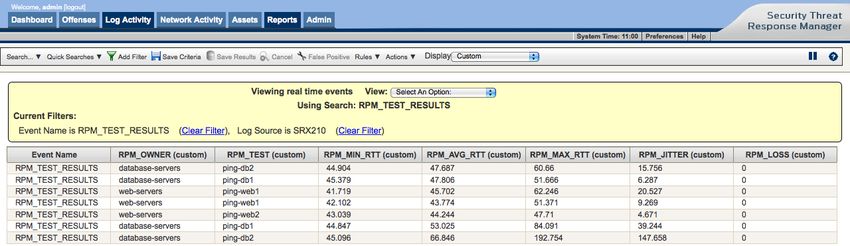
RPM to SYSLOG reporting

STRM Configuration
Once the event script is installed and operational on our Junos based router the STRM appliance will begin
receiving SYSLOG messages immediately following each successful RPM test. To view the incoming events
log into the STRM appliance and click on the Log Activity tab. Incoming events will be displayed in real time as
they arrive at the appliance. (A specific filter to remove entries generated locally by the appliance has been
created, if required create a filter using the Add Filter button)

There is nothing clear to indicate the results of the RPM test as sent via the Junos Script we’ve installed.
Events triggered by Junos Scripts are not immediately recognized by STRM as they are customised and
outside the default configuration of the software. The unknown event listed above contains the actual data
generated by the script. To view this data, pause the log flow (Pause icon at the top right) and double click the
entry, the raw contents of the SYSLOG message will be displayed.

As you can see this unknown event contains the specific test results for the event that triggered this script, but
lists the event description as “This DSM recognized this event as its own, but could not identify the event
specifically”. STRM requires additional information to map these events to a specific event or QIDMAP.

                                                                                                © Juniper Networks, Inc.   9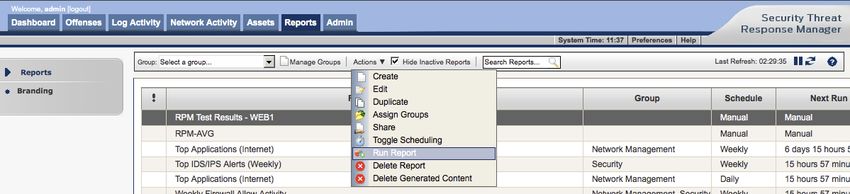
RPM to SYSLOG reporting

When unknown events arrive at an STRM Appliance they each need to be mapped to an existing low-level
category or a custom, user created QIDMAP. Events that are mapped directly to existing QID’s inherit the
name of that category which will make our task of filtering and reporting more difficult, so the correct approach
is to map the event to a newly defined custom QIDMAP.

STRM is unable to create customized low-level categories, so I’ve chosen to map successful RPM tests to the
System Informational group using the following command from the STRM CLI, while logged in using the root
account. Access to the STRM CLI should be made by the root user using a suitable SSH client.

         Creating a custom QIDMAP for RPM TEST RESULTS
         [root@strm bin]# /opt/qradar/bin/qidmap_cli.sh -c --qname RPM_TEST_RESULTS --qdescription
         RPM_TEST_RESULTS_QID --severity 5 --lowlevelcategoryid 8036
            Created entry: qid: 2000001
            name: RPM_TEST_RESULTS
            description: RPM_TEST_RESULTS_QID
            severity: 5
            low level category id: 8036
            ratethreshold: 0
            catpipename: Golf
            rateshortwindow: 0
            ratelongwindow: 0
            reverseip: false
            rateinterval: 0

STRM now needs to be configured to recognize this and future events of this newly defined type, presenting
the user with a more concise name for the event as opposed to simply unknown. To do this click on the Map
                                          Event button at the top of the event window for the unknown event.
                                          The following window will appear, allowing a custom definition to be
                                          created for this event and populate the fields as shown.

                                            Note that the Log Source Event ID was directly associated with
                                            RPM_TEST_RESULTS based on our specific positioning of this
                                            value in the SYSLOG event generated by the event script.

                                            The log source event should now be mapped to the new QID value
                                            that was automatically created by the qidmap_cli.sh command, in
                                            this case QID 200001 was automatically allocated.

                                            In order to ease mapping of specific events to existing (or user
                                            created QID’s) the event window allows searching by Device
                                            Category, Log Source Type or directly searching for QID’s that
                                            match our event.

                                            So, for this example the user could directly enter the QID Value (as
shown here) or search for the QID directly if the ID value is known. Once the QID has been entered click the
OK button to proceed.

                                                                                              © Juniper Networks, Inc.   10
RPM to SYSLOG reporting
With the custom QIDMAP created, associated with the low-level category and the event mapped to this new
QID the output within the Log Activity tab will now contain our newly configured Event Name. This can be seen
in the following output or directly filtered using the Add Filter function.
Event value extraction
Now that the incoming unknown message has been mapped to a logical event name we need to extract the
specific test parameters from the event, such as the RTT, Loss and Jitter values. Once these are mapped to
specific values they can be used for subsequent graphing and reporting.
Pause the logging flow and open one of the RPM_TEST_RESULTS events and click the Extract Property icon
at the top of the screen, you will now be presented with the Custom Events Properties window. Within this
window individual fields in a SYSLOG message can be assigned to a dedicated Property value using standard
regular expression functions. (Do the same for each property that needs to be extracted, noting the field type
and regular expression function is correct)
Specific properties for each test value should be defined
as shown in the example. An entry should be created for
each test variable, given a logical name and field type.
The following should be used for each value in the
RPM_TEST_RESULTS event.
New Property Name Field Type RegEX Patterm
RPM_OWNER AlphaNumeric Owner=(.*?)\s
RPM_TEST AlphaNumeric Test=(.*?)\s
RPM_AVG_RTT Numeric Avg-RTT=(.*?)\s
RPM_MIN_RTT Numeric Min-RTT=(.*?)\s
RPM_MAX_RTT Numeric Max-RTT=(.*?)\s
RPM_JITTER Numeric Jitter=(.*?)$
RPM_LOSS Numeric Loss%=(.*?)\s
© Juniper Networks, Inc. 11RPM to SYSLOG reporting
Event Filtering
Once the parameters of the event are
defined, dedicated event filters can be
created to show the real-time results of our
RPM tests as they are run across the
network. Once these event filters have been
created they can be saved, added to the
dashboard or defined as Quick Searches for
later use.
To create an Event Filter select the Add
Filter icon and enter the specific information
that the filter will be based on. For our real
time view of RPM results the filter will match
on the event name, and the seven custom
RPM events previously defined. Once the
filter details are entered press the Filter
button at the bottom of the page, this will
return you to the events list page.
With the event filter created real time traffic
will be presented, displaying only the event
type and the individual RPM test results for
each specific value. This filter is not
permanent; to save this for later use, select
the Save Criteria option. The filter can now
be saved for future use, added as a Quick
Search, shared with other users or
promoted to the main dashboard. Filters
created here can be used for the reporting
capabilities of STRM.
Filters are a powerful mechanism to display historical or real time information of any event arriving at the
STRM appliance. Given that our RPM events are broken down to individual Owners and Test names with
some structure it would be simple to create a real time event for each individual test, group of tests or specific
owners.
© Juniper Networks, Inc. 12RPM to SYSLOG reporting
Report Configuration
Report Event Filter
Creating reports within STRM is based on the filtering already created within the device. A report will take an
existing filter and present the results, either as a table or as events over time. The existing report we have
already created presents the RPM results in real time, however STRM reporting requires aggregated filters
grouped by a common event. An additional event filter will need to be created to cater to this requirement,
specifically filtering on the test results and the individual test name.
The defined filter specifically filters all
RPM_TEST_RESULTS events that match the ping-
web1 test. The column definition is also grouped by
the Log Source, being the main difference between
this filter and the one previously defined.
When Column Definitions are grouped together the
columns present the option of outputting the Sum,
Min, Max or Average for the coalesced records for
each log. Previously we disabled log coalescing for
this log source, so each value will be the same for a
single record. For this report set all column
definitions to Minimum.
Once the event filter is completed as shown press
the Search button to run the filter. The output from
this filter is not real time, however it graphs the total
number of records and the minimum test values.
This output isn’t very useful for real-time usage,
however it is useful for the report we will be creating.
Save the filter with the recognisable name, RPM-
REPORT-FILTER-PING-WEB1 that differentiates it
from the previous report by selecting the Save
Criteria button.
The event filter RPM-REPORT-FILTER-PING-WEB1 will now be directly used to create our RPM report for the
ping-web1 RPM test. Select the Reports tab within the STRM window and select the create option to begin
specifying a new report.
© Juniper Networks, Inc. 13RPM to SYSLOG reporting
Report Wizard
The report wizard screen will now appear, providing a workflow for the creation of the required report.
1)Initial Report Wizard screen, 2) Select the report to run every day at 12am
select next to continue
3)Select a Portrait style report 4) Provide a name for the report and set each Chart Type
the style shown. should be defined as Events/Logs. Selecting Events/Logs
will redirect you to the Container Definition window where
each graph is defined.
© Juniper Networks, Inc. 14RPM to SYSLOG reporting
Container Definitions
Each section on the report is defined as a Container, requiring to be populated with data, to create any
required tables or graphs. The Event Filter we created (RPM-REPORT-FILTER-PING-WEB1) should be used
to populate each container.
For each definition populate the container with the
following information
Specific Chart title for each RPM test
Chart Type of Stacked Line
Manual Schedule for the last 24 hours
RPM-REPORT-FILTER-PING-WEB1 search
Horizontal Axis set to Time
Vertical Axis for each test
Once the required information has been configured for
each container select the save container button and
then the Finish button to move to the next container
definition. When every container has been configured
select the Finish button for the report wizard to exit.
The report will now be completed and will run to the schedule defined, however the report can be run manually
at any time. To begin a manual report, select the report name and Run Report from the Actions icon under the
main reporting tab.
© Juniper Networks, Inc. 15RPM to SYSLOG reporting
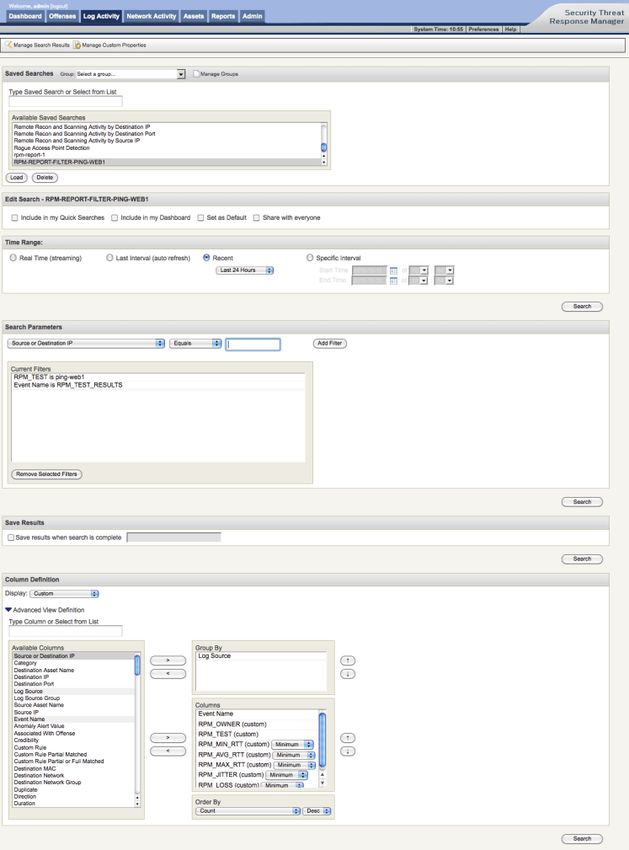
The report will take some time to run in the background with the user notified on the main console window with
a popup message when it is completed. Once complete select the version of the report, if any and then the
Acrobat Icon to download the specified report. An example of the report generated is shown in figure 2.
Figure 2: Example report
© Juniper Networks, Inc. 16RPM to SYSLOG reporting
Conclusion
The document described leveraging the benefits of individual components used across the Junos operating system and
the Security Threat Response Manager appliance to achieve a specific outcome.
Throughout the life of network operations, individual challenges present themselves that cannot be resolved with the
existing command set. Junos Script allows the operator to work with results on the device and manipulate as required, the
example used in this whitepaper is a simple case, the results forwarded to STRM could have been enhanced to include
additional data relevant to the test and the customer it is associated with.
STRM by name is positioned as a security appliance, often overlooked for its ability to receive SYSLOG messages from
any device in the network and act or report based on the content of these events. By extracting our custom SYSLOG we
have managed to create real-time and scheduled reports on the performance of an individual customer test probe. The
resulting reports could easily be modified to include additional information such as overall minimum and maximum results
as part of a table or customized alerting if predefined thresholds are exceeded.
Useful Links
Juniper KB article adding custom QIDMAP http://kb.juniper.net/InfoCenter/index?page=content&id=KB14995
Junos Script Automation http://www.juniper.net/us/en/community/junos/script-automation/
© Juniper Networks, Inc. 17You can also read