RV POSEIDON Fahrtbericht / Cruise Report P395 Sahara Slide Complex - OceanRep
←
→
Page content transcription
If your browser does not render page correctly, please read the page content below
IFM-GEOMAR REPORT

                              RV POSEIDON
                    Fahrtbericht / Cruise Report P395
                          Sahara Slide Complex
                                  04.02. – 19.02.2010
                            Las Palmas - Las Palmas (Spain)

                           Berichte aus dem Leibniz-Institut
                           für Meereswissenschaften an der
                         Christian-Albrechts-Universität zu Kiel

                                        Nr. 50
                                    November 2011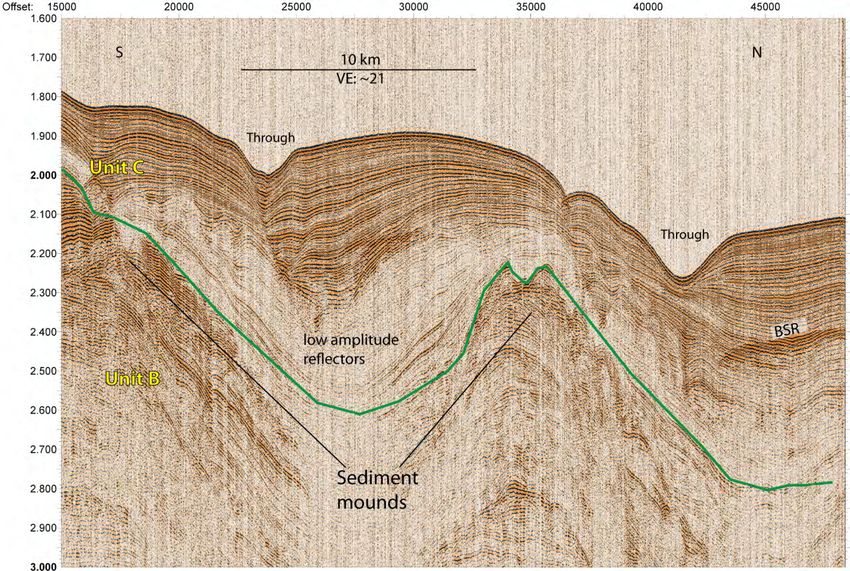
RV POSEIDON
Fahrtbericht / Cruise Report P395
      Sahara Slide Complex
             04.02. – 19.02.2010
       Las Palmas - Las Palmas (Spain)

       Berichte aus dem Leibniz-Institut
       für Meereswissenschaften an der
     Christian-Albrechts-Universität zu Kiel

                    Nr. 50
               November 2011

             ISSN Nr.: 1614-6298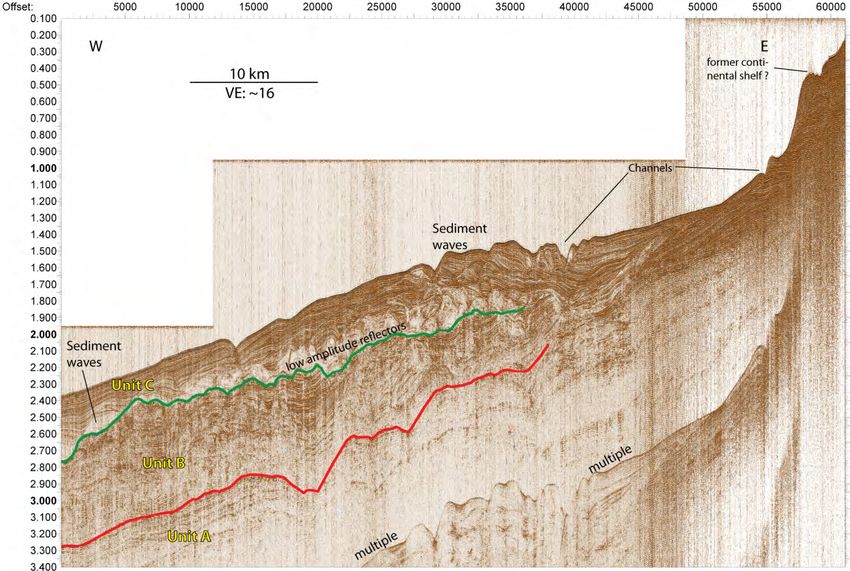
Das Leibniz-Institut für Meereswissenschaften                            The Leibniz-Institute of Marine Sciences is a
ist ein Institut der Wissenschaftsgemeinschaft                           member of the Leibniz Association
Gottfried Wilhelm Leibniz (WGL)                                          (Wissenschaftsgemeinschaft Gottfried
                                                                         Wilhelm Leibniz).

Herausgeber / Editor:
S. Krastel

IFM-GEOMAR Report
ISSN Nr.: 1614-6298

Leibniz-Institut für Meereswissenschaften / Leibniz Institute of Marine Sciences
IFM-GEOMAR
Dienstgebäude Westufer / West Shore Building
Düsternbrooker Weg 20
D-24105 Kiel
Germany

Leibniz-Institut für Meereswissenschaften / Leibniz Institute of Marine Sciences
IFM-GEOMAR
Dienstgebäude Ostufer / East Shore Building
Wischhofstr. 1-3
D-24148 Kiel
Germany

Tel.: ++49 431 600-0
Fax: ++49 431 600-2805
www.ifm-geomar.de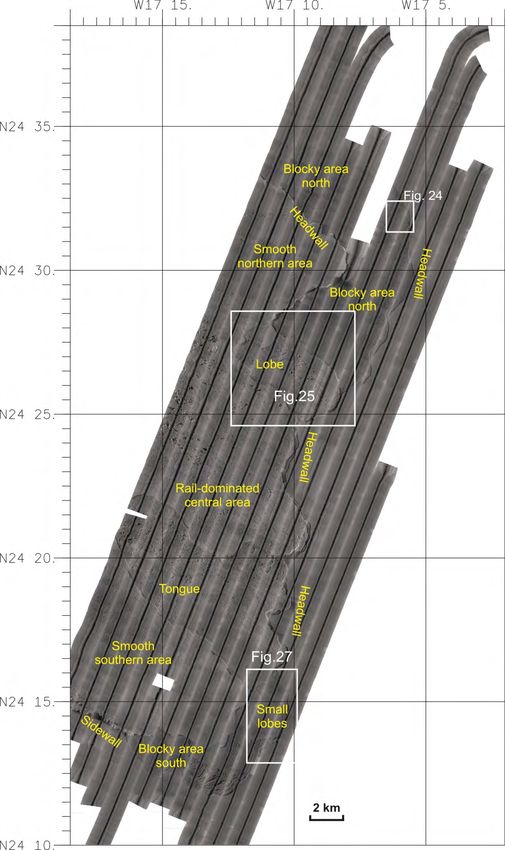
Contents
1.
Summary ................................................................................................................................. 2
Zusammenfassung .......................................................................................................................... 2
2.
Participants ............................................................................................................................. 3
3.
Objectives
of
the
cruise........................................................................................................... 4
3.1.
The
northwest
African
continental
margin ..................................................................... 4
3.2.
The
Sahara
Slide
Complex ............................................................................................... 6
3.3.
Research
Program ........................................................................................................... 7
4.
Narrative
of
the
Cruise ............................................................................................................ 9
5.
Preliminary
Results................................................................................................................ 12
5.1.
Bathymetric
mapping .................................................................................................... 12
5.1.1.
Technical
description............................................................................................. 12
5.1.2.
Results
from
bathymetric
mapping ....................................................................... 15
5.2.
High
resolution
multichannel
seismic
profiling ............................................................. 17
5.3.
Side
scan
sonar
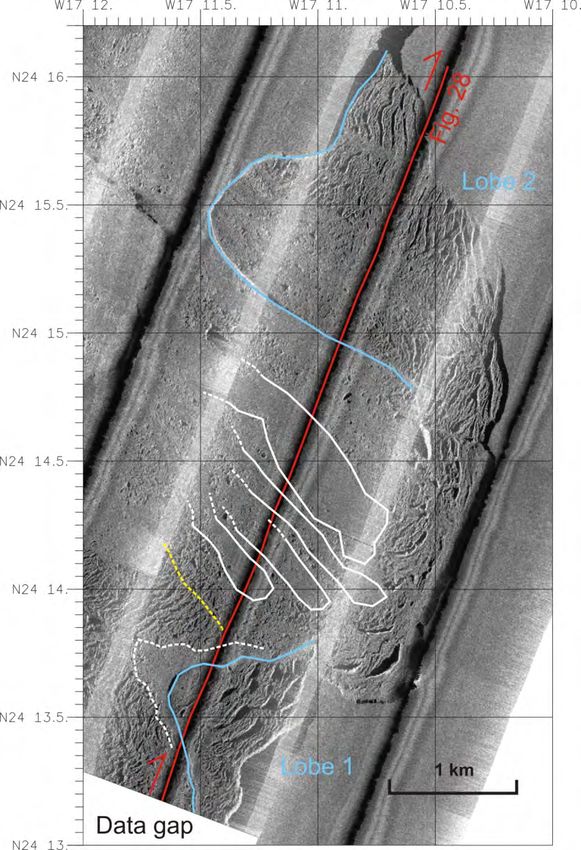
mapping............................................................................................... 24
5.3.1.
DTS-‐1
Side
scan
sonar
system ............................................................................... 25
5.3.2.
Sub-‐bottom
profiler............................................................................................... 26
5.3.3.
First
Results ........................................................................................................... 26
5.4.
Sediment
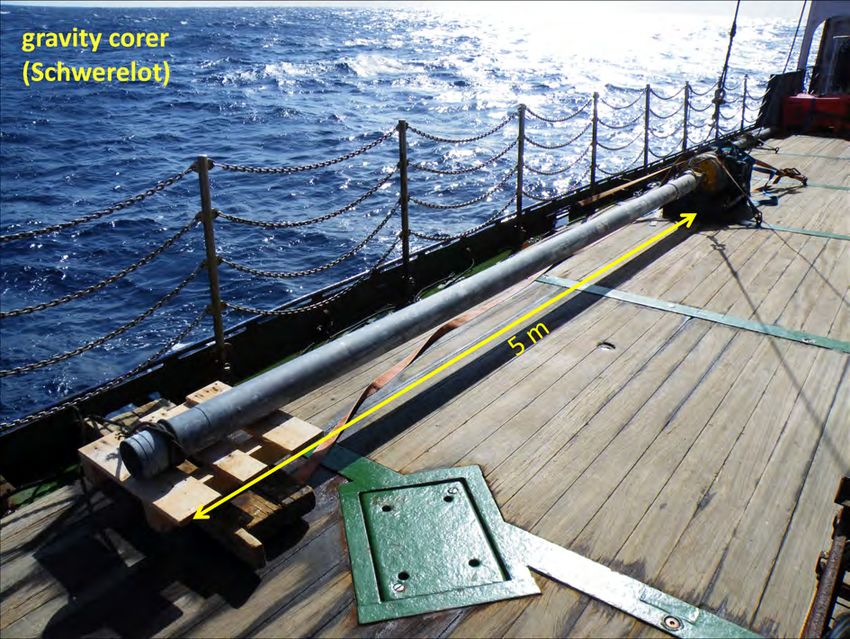
Sampling........................................................................................................ 32
5.4.1.
Sampling
locations ................................................................................................ 32
5.4.2.
First
Results ........................................................................................................... 33
5.5.
Wildlife
observation ...................................................................................................... 35
6.
Station
List............................................................................................................................. 39
7.
Data
and
Sample
Storage
and
Availability............................................................................. 42
8.
Acknowledgement ................................................................................................................ 42
9.
References............................................................................................................................. 42
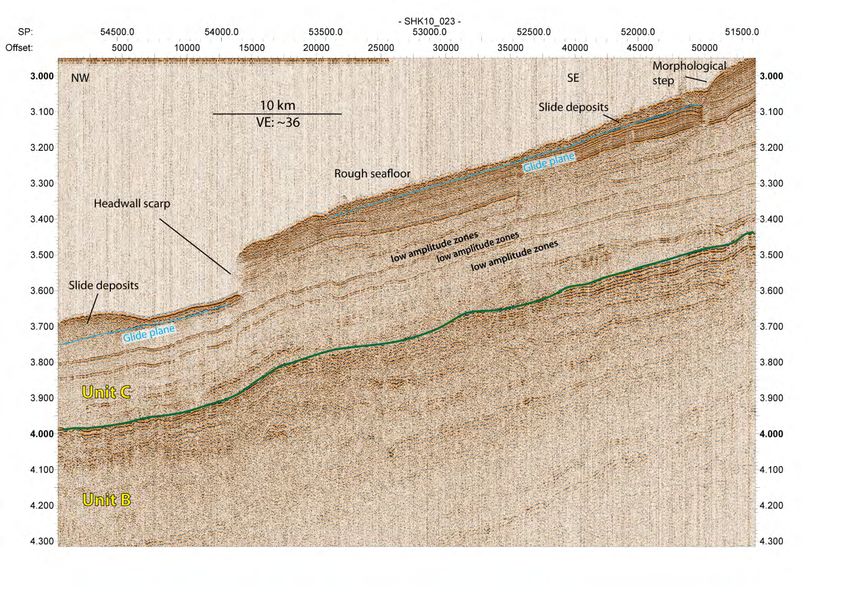
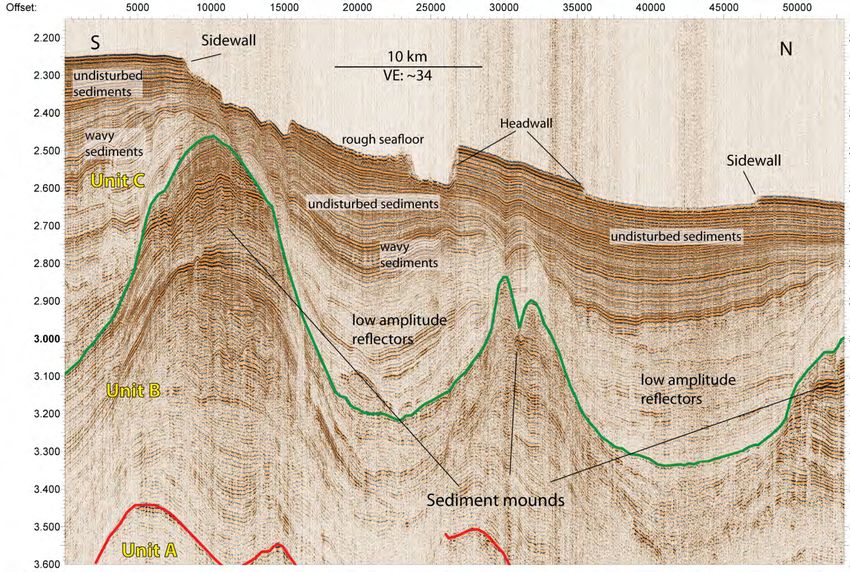
2 P395 Cruise Report, Las Palmas -‐ Las Palmas, 4.02.2010 -‐ 19.02.2010 1. Summary The main objective of Poseidon cruise P395 was to investigate the headwall area of the large Sahara Slide complex. The Sahara Slide complex is a mega slide with a length of ~900 km and an estimated volume of ~600 km3. The age of the main slide event is 50-‐60 ka. The distal part of this slide complex is well studied, while data density in the source-‐area was sparse prior to Poseidon cruise P395. New data of the headwall area were collected during a 16-‐day cruise by means of a deep-‐towed side scan sonar, bathymetric mapping, and seismic profiling in February 2010. Gravity cores were taken based on the acoustic data. Bathymetric and side scan data reveal a slab type failure with multiple headwalls spanning ~35 km along slope in 1900 m water depth. The stacked headwalls are associated with at least three different glide planes. Some areas are characterized by elongated blocks, which have not moved far, while other areas are characterized by quickly disintegrating sediment masses. Seismic data show older mass transport deposits and giant downslope striking mound-‐like features, which are aligned with the sidewalls. Gravity cores taken beneath the upper headwall complex suggest an age of only 1 – 2 ka for this major failure. This age may represent a major re-‐activation of an existing headwall or a major failure of undisturbed slope sediments. The young age of this slide calls for a re-‐ assessment of the risk potential of this margin. Zusammenfassung Das Hauptaugenmerk der Poseidon Fahrt P395 lag auf der Untersuchung der Abrisskante des großen Sahara-‐Rutschungs-‐Komplexes. Diese gigantische Massenbewegung befindet sich am passiven Kontinentalhang vor der Küste West Saharas und besitzt eine Länge von mehr als 900 km. Circa 600 km3 an Sedimenten wurden durch diesen Prozess mobilisiert und umgelagert. Das Hauptalter der Rutschung beträgt 50-‐60.000 Jahre. Während der Ablagerungsbereich der Rutschungssedimente sehr gut untersucht ist, existierten von der Abrisskante vor der Poseidon Fahrt P395 nur sehr wenige Daten. Im Rahmen der 16-‐tägigen Fahrt im Februar 2010 wurden hydroakustische Daten (Seismik, Sidescan Sonar, Sediment-‐Echolot und Fächerecholot) gesammelt, die als Grundlage für die geologische Beprobung mittels Schwerelot dienten. Bathymetrische und Sidescan Sonar Daten zeigen mehrere Abrisskanten mit einer Gesamtlänge von ~35 km in ca. 1900 m Wassertiefe. Rutschungsflächen wurden in drei unterschiedlichen Tiefen identifiziert. Einige Bereiche unterhalb der Abrisskante zeigen längliche Blöcke, die nicht weit gerutscht sind, während andere Bereiche durch schnell zerfallende Sedimentmassen gekennzeichnet sind. Seismische Daten zeigen Ablagerungen älterer Massenbewegungen und sehr große Kämme, die hangabwärts streichen und mit der Lage der Seitenkanten der Rutschung übereinstimmen. Schwerelote, die direkt unterhalb der Abrisskante gewonnen wurden, deuten ein sehr junges Alter von nur 1000 – 2000 Jahren des letzten Kollapses an. Dieses Alter kann ein große Reaktivierung einer bestehenden Abrisskante oder den Kollaps von ungestörten Hangsedimenten repräsentieren. Das junge Alter des letzten Rutschungereignisses erfordert eine Neubewertung des Gefahrenpotentials des NW-‐Afrikanischen Kontinentalhanges.

P395 Cruise Report, Las Palmas -‐ Las Palmas, 4.02.2010 -‐ 19.02.2010 3 2. Participants Name Discipline Institution Krastel, Sebastian, Prof. Dr. Chief Scientist IFM-‐GEOMAR Georgiopoulou, Aggeliki, Dr. Acoustics UCD Golbeck, Inga Acoustics GeoB Grün, Matthias Acoustics IFM-‐GEOMAR Klaucke, Ingo, Dr. Side scan Sonar IFM-‐GEOMAR Mayer Mathias Seismcis IFM-‐GEOMAR Schott, Thorsten Technician OKTOPUS Vallée, Maxlimer Acoustics IFM-‐GEOMAR Winkelmann, Daniel, Dr. Sedimentology IFM-‐GEOMAR Wynn, Russel B., Dr. Sedimentology NOCS Participating Institutions: IFM-‐GEOMAR Leibniz Institute of Marine Sciences (IFM-‐GEOMAR), Kiel, Germany UCD School of Geological Sciences, University College Dublin, Ireland GeoB Fachbereich Geowissenschaften, Universität Bremen, Germany OKTOPUS Oktopus GmbH, Kiel, Germany NOCS National Oceanography Centre, Southampton, UK
4 P395
Cruise
Report,
Las
Palmas
-‐
Las
Palmas,
4.02.2010
-‐
19.02.2010
3. Objectives
of
the
cruise
Submarine
landslides
present
a
major
natural
hazard,
as
they
can
destroy
offshore
infrastructures
and
may
create
destructive
tsunamis.
The
NW-‐African
continental
margin
is
characterized
by
a
complex
interplay
between
gravitational
and
contour
parallel
sediment
transport
processes
including
large
scale
mass
wasting
at
several
locations.
The
Sahara
Slide
Complex
is
one
of
the
giant
landslides
along
the
NW-‐African
continental
margin.
This
slide
is
well
investigated
in
its
distal
depositional
part
(Embley
1976;
Masson
et
al.
1993;
Gee
et
al.
1999)
but
less
was
known
about
the
headwall
area.
Hence
Cruise
P395
aimed
in
collecting
detailed
acoustic
data
and
sediment
cores
from
the
headwall
area
in
order
to
analyze
the
Sahara
Slide
complex
from
‘source-‐to-‐sink’.
The
slide
can
act
as
end
member
for
mega-‐slides
at
passive,
non-‐
glaciated
margins
3.1.The
northwest
African
continental
margin
The
northwest
African
continental
margin
is
a
passive
margin
and
large
earthquakes
are
rare
although
moderate
magnitude
earthquakes
have
been
recorded
and
are
attributed
to
old
zones
of
weakness
created
during
the
opening
of
the
Atlantic
Ocean
(Hayes
and
Rabinowitz,
1975).
Continental
slope
gradients
range
from
1°
to
6°,
while
the
continental
rise
displays
gradients
of
P395 Cruise Report, Las Palmas -‐ Las Palmas, 4.02.2010 -‐ 19.02.2010 5 Fig. 1: Map of the main sedimentary features on the northeast Atlantic margin. The bottom part of the map shows down slope processes off the northwest African margin. Debris flow (light brown), debris avalanche (darker brown), turbidity currents pathway (light grey) (Weaver et al., 2000).

6 P395
Cruise
Report,
Las
Palmas
-‐
Las
Palmas,
4.02.2010
-‐
19.02.2010
3.2.The
Sahara
Slide
Complex
The
oldest
reference
to
the
Sahara
Slide
dates
back
to
1977,
when
Embley
and
Jacobi
(1977)
describe
it
as
the
largest
slide
so
far
discovered
with
a
slide
scar
of
18.000
km2
in
area
and
at
least
600
km3
in
volume
of
translated
Neogene
sediments.
Gee
et
al.
(1999)
described
the
Sahara
Debris
Flow
as
a
two-‐phase
flow
event,
with
a
basal
volcaniclastic
layer
and
an
overlying
pelagic
layer,
which
travelled
for
more
than
400
km
on
a
highly
fluid,
low
friction
layer
of
poorly
sorted
sediments
(Fig.
3,
Fig.
2).
Regarding
to
the
deposition
of
the
debris
flow
Gee
et
al.
(1999)
conclude
that
it
might
have
been
controlled
by
a
variety
of
factors,
including
decreasing
gradients,
thinning
of
the
flow,
and
dissipation
of
pore
pressure.
Additionally,
the
age
of
the
Sahara
Slide
was
determined
by
examining
the
distal
deposits
of
the
Sahara
Slide
deposit
resulting
in
an
age
of
~
60
ka
for
the
mass
movement.
Fig. 3: Location of the Sahara Slide Fig. 2: Detailed map of the debris flow tongue
complex on the NW African continental showing relationships between the terminations of
margin to the South of the Canary Island. the pelagic and volcaniclastic debris flow phases
Contours are in kilometers below sea level and their interactions with the sea floor
(Gee et al., 1999) topography. Contour interval is 50 m (Gee el al.,
1999).
Georgiopoulou
et
al.
(2007)
found
that
the
headwall
area
has
been
the
site
of
numerous
massive
landslides
since
at
least
Miocene
times,
as
recorded
by
multiple
buried
events.
They
showed
that
landsliding
has
been
taking
place
retrogressively
and
proposed
differential
compaction
across
buried
scarps
as
the
main
preconditioning
factor
driving
repeated
instability
(Fig.
4,Fig.
5).
Georgiopoulou
et
al.
(2009)
presented
evidence
for
further
sliding
in
the
headwall
area,
occurring
as
recently
as
the
Late
Holocene.
They
showed
that
this
1
to
2
ka
old
event
is
related
to
a
linked
debrite-‐turbidite
deposit,
found
further
down
slope
and
a
surficial
turbidite
deposit
covering
a
large
area
of
the
northwest
African
margin.
P395
Cruise
Report,
Las
Palmas
-‐
Las
Palmas,
4.02.2010
-‐
19.02.2010
7
Fig.
4: Location of the study area by
Georgiopolou et al., (2007) on the NW African
Fig. 5: Conceptual model of slide
margin (box). Map showing the outline of the generation due to buried scarps (not to
Sahara Slide (grey-shaded area). Contours are
scale) (Georgiopolou et al., 2007).
at 500 m.
3.3.Research
Program
The
morphology
and
evolution
of
the
headwall
area
of
the
Sahara
Slide
complex
was
studied
during
a
16-‐day
research
cruise
with
RV
Poseidon
by
means
of
deep-‐towed
side
scan
sonar,
bathymetric
mapping,
and
seismic
profiling
in
February
2010
(Fig.
6).
Individual
slide
masses
as
well
as
undisturbed
sediments
upslope
of
the
headwall
were
sampled
by
gravity
coring
in
order
to
investigate
trigger
mechanisms
and
present
day
slope
stability.
The
investigations
shall
lead
to
a
detailed
analysis
of
flow
processes
of
the
Sahara
Slide
complex
from
source
to
sink.
The
investigations
are
related
to
the
project
B4
(Submarine
hazards
at
continental
margins)
within
the
Cluster
of
Excellence
'The
Future
Ocean',
University
of
Kiel
and
Leibniz
Institute
of
Marine
Sciences
(IFM-‐GEOMAR).
Specific
objectives
of
the
cruise
were:
• Analysis
of
the
morphology
and
architecture
of
the
headwall
area
Detailed
morphological
maps
of
the
scar
area
showing
the
location
of
individual
headwalls
and
slide
units
were
not
available
prior
to
the
cruise.
• Investigation
of
relatively
recent
reactivations
of
the
headwall
area
and
current
slope
stability
A
pilot
study
indicated
a
young
reactivation
of
the
headwall
but
size
and
exact
age
were
unknown.
• Evaluation
of
possible
triggers
Based
on
a
single
seismic
line,
Georgiopolou
et
al.
(2007)
postulated
differential
compaction
over
buried
scarps
as
main
trigger
mechanism
for
the
Sahara
Slide
complex.
The
new
data
allow
to
test
this
hypothesis
due
to
a
dense
net
of
seismic
profiles.
8 P395
Cruise
Report,
Las
Palmas
-‐
Las
Palmas,
4.02.2010
-‐
19.02.2010
• Assessment
of
associated
geohazards
Recurrence
rates
and
size
of
individual
events
are
essential
in
order
to
assess
the
geohazard
potential
• Synthesis
of
the
Sahara
Slide
from
‘Source-‐to-‐Sink’
The
new
data
should
lead
to
an
analysis
of
the
Sahara
Slide
complex
from
‘source-‐to-‐sink’.
The
slide
can
act
as
end
member
for
mega-‐slides
at
passive,
non-‐glaciated
margins.
Fig. 6: Cruise track of P395. Location of sound velocity measurement and multibeam calibration are
marked by blue circles. Bathymetry data at the Sahara Slide headwall area were collected during
Cruise MSM11/2.P395 Cruise Report, Las Palmas -‐ Las Palmas, 4.02.2010 -‐ 19.02.2010 9 4. Narrative of the Cruise The main group of the scientific party arrived in Las Palmas on February 1st and directly boarded RV Poseidon, which was already in port. The days in port were used to set up the scientific instruments, which was successfully done due to the great support of the crew. We left the port of Las Palmas on February 4th at 09:30h. The scientific crew of RV Poseidon-‐Cruise P395 included 6 scientists from the Leibniz-‐Institute of Marine Sciences (IFM-‐GEOMAR) and the Cluster of Excellence ‘The Future Ocean’ (Kiel), one scientist each from Bremen University, National Oceanography Centre Southampton, and University College Dublin, as well as one technician from Oktopus GmbH in Kiel. After leaving port we headed directly south to a position at 25°11’N, 16°50’W, where we started the scientific program with a CTD run to 2000 m water depth on February 5th at 07:00h. The CTD was needed for collecting a sound velocity profile for the multibeam system. Thereafter we headed to a shelf location around 24°22’N, 16°30’W for calibrating the multibeam system (Fig. 6). Despite the rough sea state, the calibration of the multibeam was successfully finished around 18:00h. The multichannel seismic system consisting of a 200m-‐long 120 channel streamer and a Mini-‐GI gun was deployed immediately afterwards. A first seismic profile brought us to the main working area, the headwall area of the Sahara Slide Complex. Two additional profiles crossing the headwall at different locations were collected until February 6th in the morning. A first gravity core (P395-‐02) in undisturbed sediments above the headwall in ~1900m water depth was taken in the morning of February 6th. The rest of the day was used for calibrating the USBL system for the side scan sonar. Due to some minor problems with the side scan sonar, the night was used for seismic profiling of the head wall area until February 7th in the morning. The seismic data indicate different phases of the main headwall collapse and current influenced sediments in greater sub bottom depth. We started to deploy the side scan sonar together with the multichannel seismic system at 12:00h on February 7th. The side scan sonar is a deep towed EdgeTech 1 system operating at frequencies of 75 kHz and 410 kHz. The first side scan sonar survey was located around the main head wall area. It showed numerous sets of headwalls, tilted blocks, large debris blocks, ridges, and evacuated areas. In total we collected 5 parallel profiles covering an area of 24 x 3.5nm. The system was back on deck on February, 10th at 09:00h. Seismic profiles were collected simultaneously to the side scan sonar. The seismic profile show interesting undulating features with an aggradational wavy pattern covered by a drape. Based on existing sediment echo sounder data and the new side scan data, 9 core locations were selected close to the headwall along the entire headwall length. Coring was planned for February 10th during day time but due to a high swell, we decided not to start the coring program but running a seismic survey instead. The seismic system was deployed at 10:30h. We collected two long profiles across the lower headwall of the Sahara Slide, which is located in a depth of ~2700m about 30 km seaward of the upper headwall. The seismic data indicate undisturbed strata in vicinity of the lower headwall. No obvious explanations for the location of the lower headwall were identified. In addition we crossed another smaller slide complex south
10 P395 Cruise Report, Las Palmas -‐ Las Palmas, 4.02.2010 -‐ 19.02.2010 of the main Sahara Slide. The seismic system was retrieved on February 11th at 07:00h. The swell decreased during the night, hence February 11th was used for coring. During the day, we took four cores (P395-‐03 – P395-‐06) directly below the southern part of the main slide event. The first two cores showed a debris flow covered only by a very thin drape of undisturbed sediments. The other two cores were located in areas with only very thin or no debrite deposits in order to sample the glide plains at different levels. These old sediments, however, seems to be too stiff for sampling with a gravity corer and recovery was very low. Detailed analyses in the lab will show, if we recovered small pieces of the glide plain sediments. The night was again used for small scale imaging with the seismic system in order to understand the geometry of the underlying sedimentary features. 5 additional cores (P395-‐07 – P395-‐11) were taken on February 12th in close vicinity to the northern part of the headwall. Four of the five cores show textbook-‐like debrites with a very thin undisturbed drape. This observation leads us to the conclusion that the entire upper headwall is a very young feature (~2ka) and not formed during an event about 60ka BP, as postulated before. The fifth core did not recover any sediment as it was located directly on the glide plain, which was again too stiff for sampling. The missing drape on the glide plain, however, supports the idea of a very recent (~2ka) failure. Coring was followed by mapping with side scan sonar and the seismic systems from the evening of February 12th to February 16th. The mosaic collected during the previous deployment was continued further down slope. The seismic system was not operated along all side scan lines because of currents, waves, and wind resulting in too small lateral distances between the side scan cable and the streamer. In addition the sub-‐bottom profiler failed during the survey and several lines were collected without the profiler. The survey of the headwall of the Sahara Slide was completed on February 15th in the afternoon. The survey was continued further to the south, where available data showed clear indications for another failure. After crossing the headwall of this failure for the first time on February 16th in the early morning, side scan operations had to be stopped because of a break in the data transmission cable. Due to very high swells we decided to leave the side scan in the water for the rest of the night and recovery of the side scan started at daylight on February 16th. The side scan was on deck at about 09:00h. Unfortunately, the swell was too high for gravity coring. Hence we deployed the seismic system to collect two long slope parallel profiles above and below the headwall. While collecting the upper slope parallel profile, one of the stabilizers of the vessel failed and we had to change course to a northwesterly direction to head against the swell. Unfortunately it was not possible to repair the stabilizing system at sea. This fact in combination with predicted strong winds led to the decision to stop the scientific program on February 17th at 08:00h. After retrieving the seismic system, we started the transit to Las Palmas. We chose a northerly course at the beginning in order to avoid the swell coming from the side. During the transit the wind increased to force 9-‐10 with wind peaks up to 62 knots (11-‐12). From very early morning to the afternoon of February 18th, the vessel was kept stationary due to the strong winds. Decreasing winds and wave heights allowed continuing the transit to Las Palmas in the early evening of February 18th. We reached port on February 19th at 18:00h. Despite the problems at the end of the cruise and the early stop of the research program, Poseidon Cruise P395 was a great success. We collected more than 800 nm of seismic profiles, mostly in exceptional quality. A large area of the headwall and some areas south of the Sahara
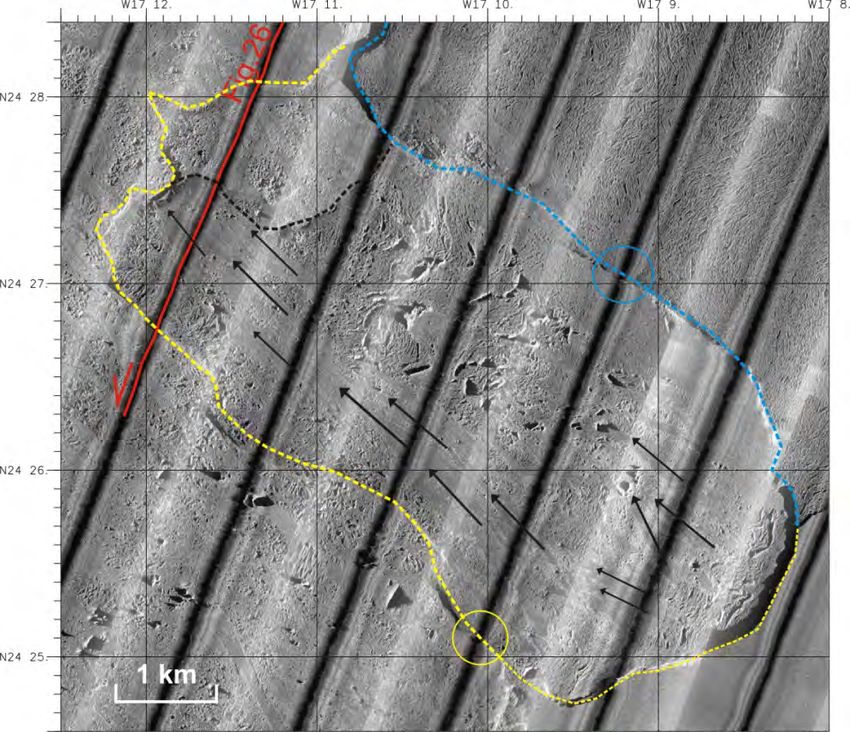
P395 Cruise Report, Las Palmas -‐ Las Palmas, 4.02.2010 -‐ 19.02.2010 11 Slide were successfully surveyed with the side scan sonar. In total we collected 10 cores up to 5 m length. Mainly the coring program was affected by the bad weather condition and the early stop of the cruise. Hence coring the lower part of the slide was not possible. The new data will allow to reconstruct a major slide event from ‘source-‐to-‐sink’ and to assess its geohazard potential. Fig. 7: Headwall area of the Sahara slide with measured seismic and side scan sonar profiles during Cruise P395. White lines indicate positions of seismic profiles shown in Fig. 17 toFig. 20. Locations of gravity cores are marked as red dots. Source of bathymetry data: MSM11/2 and Gebco. .
12 P395
Cruise
Report,
Las
Palmas
-‐
Las
Palmas,
4.02.2010
-‐
19.02.2010
5. Preliminary
Results
5.1.Bathymetric
mapping
Multibeam
data
from
the
Sahara
Slide
headwall
area
were
already
collected
during
Cruise
MSM11/2.
During
Cruise
P395
additional
multibeam
data
were
recorded
to
expand
the
high
resolution
bathymetry
map
especially
upslope
of
the
headwall
area.
Therefore
a
Seabeam
1050
multibeam
echosounder
system
was
installed
during
the
cruise
which
allows
high
resolution
bathymetric
mapping.
5.1.1. Technical
description
Seabeam
1050
Multibeam
Echosounder
The
Seabeam
1050
System
is
a
survey
system
of
vast
capability
and
is
therefore
highly
suitable
for
hydrographic
surveys.
The
operating
frequency
is
50
kHz.
Maximum
depth
and
coverage
transverse
to
the
ship
is
shown
in
Fig.
8.
Fig. 8: Maximum depth and coverage of SEABEAM 1050
Two
narrow
beam
width
transducer
arrays
are
pinging
quasi-‐simultaneously
into
14
directed
sectors
with
a
high
acoustic
transmission
level.
The
receiving
beam-‐former
generates
3
narrow
beams
within
each
sector
with
a
beam
width
of
1.5°
(Phase
calculator)
and
a
spacing
of
1.25°.
This
we
call
a
subfan.
A
complete
fan
comprises
three
subfans,
i.e.
there
are
14
sectors
x
3
beams
x
3
subfans
=
126
beams
in
total.
The
relatively
high
operating
frequency
of
50
kHz
in
conjunction
with
special
small
size
transducers
offers
two
advantages:
high
coverage
and
narrow
beam
width.
The
application
of
preformed
beams
guarantees
extremely
good
side
lobe
suppression
and
a
very
low
error
rate.
This
has
a
positive
influence
on
measuring
accuracy
and
gives
the
system
a
big
advantage
over
one
way
procedures,
i.e.
non-‐directed
transmission
and
reception.
P395
Cruise
Report,
Las
Palmas
-‐
Las
Palmas,
4.02.2010
-‐
19.02.2010
13
Transducer
arrays
LSE
237
The
SEABEAM1050
system
employs
two
transducer
arrays
of
type
LSE
237,
port
and
starboard,
both
capable
of
transmitting
and
receiving.
Their
acoustic
planes
are
tilted
30°
to
the
horizontal.
The
arrays
are
normally
installed
fixed
to
the
ship’s
hull.
Onboard
of
RV
Poseidon
the
two
transducers
are
deployed
at
the
hull
of
the
vessel
through
the
"moon
pool".
Position
of
the
transducers
can
be
seen
on
Fig.
9.
Fig. 9: Deck setting with GPS positions during P395 cruise.
The
ultrasonic
transducer
LSE
237
is
used
to
transmit
and
receive
ultrasonic
impulses
at
a
frequency
of
50
kHz.
It
consists
of
32
separate
staves.
By
triggering
the
separate
transducer
staves
with
a
phased
transmit
signal
it
is
possible
to
point
the
direction
of
transmission
to
±
50°
with
respect
to
the
normal
„untreated“
array
transmission
angle.
In
the
transmit
path
both
transducer
arrays
operate
in
parallel
with
a
common
power
stage.
All
32
staves
of
each
transducer
array
are
used
for
transmit
beamforming.
In
the
receive
path
port
and
starboard
array
signals
are
handled
separately.
16
center
staves
of
each
transducer
are
used
to
form
narrow
beams.
The
number
of
beams
and
fan
width
is
selectable.
Control
Unit
SEE
30
The
Transmit/Receive
Unit
SEE
30
is
accommodated
within
a
transportable
case
(Fig.
10).
It
consists
of
a
number
of
plug-‐in
components
contained
in
a
rack.
You can also read