S&P Dow Jones Indices - Spotlight on the S&P 500 ESG Index - Axio Financial
←
→
Page content transcription
If your browser does not render page correctly, please read the page content below

S&P Dow Jones Indices
Spotlight on the S&P 500 ESG Index

                                     1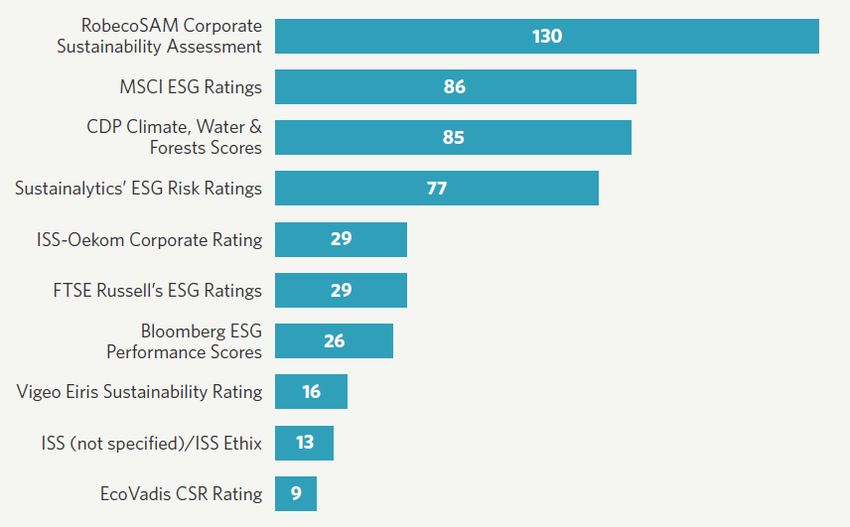
The Evolution of ESG – from the Margins to the Mainstream

    MYTH BUSTING

    1) ESG Investing ≠ Ethical Investing
        o SRI: values-based investing.
           vs.
        o ESG: process for incorporating financially-material information (sometimes in alignment with ones
          values).

    2) ESG does not mean sacrificing returns
        o Resource efficient companies tend to be more efficient in general.

        o Broad market exposure now possible with market (if not better) returns.

                                                                                                              2
Material Insights driven through Real-life Investment Performance
1 Cash and Capital
Management Product Quality and
Safety
Human Capital Innovation Management
0.9 Management
Market Access Strategy
Likelihood of impact
Corporate Governance
0.8
Strategy to Improve Business Ethics
Access to Healthcare
Quality of Earnings
0.7 Supply Chain
Environmental
Management & Product Management
Stewardship
0.6
Customer Relationship
Management
0.5
0.4
1 1.5 2 2.5 3 3.5 4
Magnitude of impact Source: SAM, part of S&P Global
3Not All Issues Matter to All Industries
Mining & Minerals Restaurants Pharmaceuticals
E E
E G
G
G
S
S
S
• Payment transparency •Brand management •Innovation mgmt.
•Customer relationship •Product quality and recall
Management mgmt.
• Mineral waste mgmt. •Raw material sourcing •Climate strategy
• Water related risks
• Biodiversity
• Asset closure mgmt. •Local impact of business •Address cost burden
• Community impact operations •Access to drugs
• Stakeholder engagement •Health outcome
contributions
Source: SAM, part of S&P Global
4Introducing the S&P 500® ESG Index: Methodology
100%
1) Exclude:
Sort by
• Tobacco 90%
S&P
• Controversial weapons 80% DJI
ESG
• Low UNGC scores 70% Score
Target
• Bottom 25% of S&P DJI ESG scoring companies within each global GICS Industry 75%
60%
Group by Eligible
market
50%
2) Sort & Select: cap
• Sort eligible companies by S&P DJI ESG Score within each GICS Industry 40%
Group 30%
• Select top performing companies, targeting 75% within each GICS Industry
20%
Group
3) Weight:
10%
• Weight companies by float-adjusted market cap Ineligible
0%
Industry group
For illustrative purposes only
5The S&P 500 ESG Index: Exclusions based upon ESG Principles
Controversial Tobacco Low UNGC MSA Not Covered
Weapons Score Cases by Input
data
Honeywell Intl Philip Morris Johnson &
Netflix Inc. Dow Inc.
Inc. International Johnson
Charter
Lockheed Martin Altria Group 3M Co. Amcor plc Tobacco
Communications Controversial Weapons
0.78%
Raytheon DuPont de 1.97% Low UNGC Score
Technologies Crown Castle Intl. Nemours 1.59%
Corp. Inc.
SBA
Boeing Co.
Communications Bottom 25% of
Northrop Global GICS
Twitter Inc.
Grumman Corp. Industry Group
General S&P 500 ESG Index ESG Scores
Dynamics Constituents Non-Constituents 3.91%
Jacobs 76.56% 23.44% Eligible, but Not
Engineering Selected
Group Inc. 12.87% Controversy
2.14%
Huntington
Ingalls Industries
Inc. No ESG Score
Coverage
Textron Inc.
0.17%
Data as of last rebalance on April 30th, 2020.
Source: S&P Dow Jones Indices, LLC. Table & Chart Provided for Illustrative Purposes Only. 6The S&P 500 ESG Index: Summary Characteristics
The S&P 500 ESG Index launched on January 28th, 2019
On April 30th, 2020, there were 311 constituents in the S&P 500 ESG
S&P 500® Index
Index ESG Index
Number of Constituents 505 311
Weight of Largest Constituent 5.66% 7.39%
Weight of Top 10 Constituents 26.05% 33.00%
Index ESG Score Improvement -- 21.17%
Carbon-to-Revenue Footprint 220.35 208.88
The Index ESG Scores are calculated using index data as of April 30th, 2020. The ‘Index ESG Score Improvement’ is calculated as the percentage difference between the Index ESG scores of the S&P 500 ESG
Index and the S&P 500, relative to the index’s maximum potential improvement, based on only investing in the single highest ranked ESG scoring company.
The index’s ‘Carbon to Revenue’ footprint is measured using index data as of April 30th, 2020. For further information on these methodologies, see Index ESG Characteristics Explained. Access via:
https://eu.spindices.com/documents/additional-material/spdji-esg-metrics.pdf
Source: S&P Dow Jones Indices LLC. Charts and graphs are provided for illustrative purposes. Past performance is not an indication or guarantee of future results. These charts and graphs may reflect 7
hypothetical historical performance. Please see the Performance Disclosure at the end of this document for more information regarding the inherent limitations associated with back-tested performance.The S&P 500 ESG Index: Measuring the Impacts
Governance
Environmental
Social
+9% +8%
exposure to companies actively exposure to companies that perform
+8% monitoring diversity-related issues and disclose ESG materiality analysis
exposure to companies that analyze
their sources of Scope 3 emissions +7% + 7%
female representation in all exposure to companies with a
+10% management positions including diversity policy regarding board
junior, middle, and senior nominations
third-party verified emission data
management
+9% + 9%
exposure to companies with GHG + 7% exposure to companies with a public
emission reduction targets more exposure to companies Supplier Code of Conduct that covers
assessing human rights issues across working conditions
their business
Source: S&P Dow Jones Indices LLC. These are just a few examples of the numerous ways in which the S&P 500 ESG Index offers enhanced ESG representation. Increased index
exposure to each ESG theme in the metrics above are calculated using the question-level data in SAM’s Corporate Sustainability Assessments (2019 methodology year). These metrics
8
are calculated using index data as of May 1, 2020 as the percentage difference between the performance of the S&P 500 ESG Index and the S&P 500 constituents across these metric,
on a weighted average basis.The S&P 500 ESG Index: Sustainable Performance with Benchmark-like Returns
S&P 500® S&P 500 ESG
10 Year Annualized Returns (Total
13.99 14.28
Return, %)
10 Year Standard Deviation (%) 13.42 13.13
10-Year Historical 10 Year Tracking Error (%) - 0.96
Performance Index ESG Score Improvement (%) - 21.17
450
400
350
300
250
200
150
100
50
0
S&PJun-14
Jun-10 Dec-10 Jun-11 Dec-11 Jun-12 Dec-12 Jun-13 Dec-13 500 (TR) S&P 500
Dec-14 Jun-15 ESG Index
Dec-15 Jun-16(TR)
Dec-16 Jun-17 Dec-17 Jun-18 Dec-18 Jun-19 Dec-19 Jun-2
Source: S&P Dow Jones Indices LLC. Performance data from June 30th, 2010, to June 30th, 2020. Data for graph from June 30th, 2010, to June 30th, 2020. Index performance based on daily total returns, USD
unless stated otherwise. Charts and graphs are provided for illustrative purposes. Past performance is not an indication or guarantee of future results. These charts and graphs may reflect hypothetical historical
performance. Please see the Performance Disclosure at the end of this document for more information regarding the inherent limitations associated with back-tested performance.
9The S&P 500 ESG Index: Sustainable Performance with Benchmark-like Returns
S&P 500
S&P 500® ESG
1 Year Total Returns (June 28, 2019 – June 30,
7.51 10.77
2020, %)
1-Year Performance (Live) 1 Year Standard Deviation (%) 21.88 21.43
130 1 Year Tracking Error (%) - 1.27
Index ESG Score Improvement (%) - 21.17
120
110
100
90
80
70
60
28-Jun-19 28-Jul-19 28-Aug-19 28-Sep-19 28-Oct-19 28-Nov-19 28-Dec-19 28-Jan-20 28-Feb-20 28-Mar-20 28-Apr-20 28-May-20 28-Jun-20
S&P 500 (TR) S&P 500 ESG Index (TR)
Source: S&P Dow Jones Indices LLC. Performance data from June 28th, 2019, to June 30th, 2020. Data for graph from June 28th, 2019, to June 30th, 2020. Index performance based on daily total returns, USD unless stated otherwise.
Charts and graphs are provided for illustrative purposes. Past performance is not an indication or guarantee of future results. These charts and graphs may reflect hypothetical historical performance. Please see the Performance
Disclosure at the end of this document for more information regarding the inherent limitations associated with back-tested performance.
10The S&P 500 ESG Index: 1 Year Performance Attribution - Selection Effect
S&P 500 ESG vs. S&P 500: Mar 31, 2019 - Mar 31, 2020
Materials
Real Estate
Utilities
Energy
Consumer Staples
Industrials
Communication Services
Consumer Discretionary
Financials
Health Care
Information Technology
-0.20% 0.00% 0.20% 0.40% 0.60% 0.80% 1.00%
Source: S&P Dow Jones Indices LLC; FactSet (Portfolio Analysis Tool for Performance Attribution Analysis). Performance data from March 31st, 2019, to March 31st, 2020. Data for graph from
March 31st, 2019, to March 31st, 2020. Index performance based on daily total returns, USD. Charts and graphs are provided for illustrative purposes. Past performance is not an indication or
guarantee of future results. These charts and graphs may reflect hypothetical historical performance. Please see the Performance Disclosure at the end of this document for more information
11
regarding the inherent limitations associated with back-tested performance.The S&P 500 ESG Index: 2020 Rebalance Highlights
Biggest Additions and Drops to the S&P 500 ESG Index from the 2020 Annual Rebalance
TOP 10 BIGGEST ADDITIONS TOP 10 BIGGEST DROPS
Facebook* Walmart
Thermo Fisher Scientific* Raytheon Technologies Corp.
Costco Wholesale Corp.* Charter Communications Inc.
Eli Lilly & Co.* Crown Castle International Corp.
Wells Fargo* US Bancorp
American Tower Corp.* Kimberly-Clark
Advanced Micro Devices Applied Materials
Regeneron Pharmaceuticals* Ross Stores Inc.
Verisk Analytics Phillips 66
American Water Works Consolidated Edison Inc.
(*) These companies were re-added after previously being dropped from the index in the 2019 rebalance. For Facebook, an S&P DJI ESG Score improvement (largely driven by improvements in its
Governance score) and an industry reclassification improved its S&P DJI ESG Score performance relative to its industry peers. The S&P DJI ESG Scores for Thermo Fisher Scientific and Regeneron
Pharmaceuticals also increased. However, the S&P DJI ESG Scores for Costco Wholesale Corp, Eli Lilly & Co, Wells Fargo, and American Tower Corp actually fell, suggesting their rankings within their
respective index industry groups improved as the scores of their peers perhaps fell
12
by more.
Source: S&P Dow Jones Indices LLC. Data as of April 30, 2020. Table is provided for illustrative purposes.S&P DJI ESG Scores: A Financially Material Lens on ESG
1. Cultivated over 20 years of investment experience by RobecoSAM
2. Data collection goes beyond public disclosure
3. Built upon an extremely granular set of data points
4. Industry-specific, accounting for the most financially material issues
13The Highest Quality Data According to Industry Experts
ESG Ratings Quality - Bars represent number of respondents who listed each rating provider (unprompted)
Source: Rate The Raters Survey 2019 (respondents included 319 sustainability professionals, with approx. 70% with > 10 years experience)
14Performance Disclosure
The S&P 500 ESG Index launched January 28th, 2019. All information presented prior to an index’s Launch Date is hypothetical (back-tested), not actual performance. The back-test calculations are based
on the same methodology that was in effect on the index Launch Date. Complete index methodology details are available at www.spdji.com.
All information presented prior to an index’s Launch Date is hypothetical (back-tested), not actual performance. The back-test calculations are based on the same methodology that was in effect on the
index Launch Date. Complete index methodology details are available at www.spdji.com.
S&P Dow Jones Indices defines various dates to assist our clients in providing transparency. The First Value Date is the first day for which there is a calculated value (either live or back-tested) for a given
index. The Base Date is the date at which the Index is set at a fixed value for calculation purposes. The Launch Date designates the date upon which the values of an index are first considered live: index
values provided for any date or time period prior to the index’s Launch Date are considered back-tested. S&P Dow Jones Indices defines the Launch Date as the date by which the values of an index are
known to have been released to the public, for example via the company’s public website or its datafeed to external parties. For Dow Jones-branded indices introduced prior to May 31, 2013, the Launch
Date (which prior to May 31, 2013, was termed “Date of introduction”) is set at a date upon which no further changes were permitted to be made to the index methodology, but that may have been prior to
the Index’s public release date.
Past performance of the Index is not an indication of future results. Prospective application of the methodology used to construct the Index may not result in performance commensurate with the back-test
returns shown. The back-test period does not necessarily correspond to the entire available history of the Index. Please refer to the methodology paper for the Index, available at www.spdji.com for more
details about the index, including the manner in which it is rebalanced, the timing of such rebalancing, criteria for additions and deletions, as well as all index calculations.
Another limitation of using back-tested information is that the back-tested calculation is generally prepared with the benefit of hindsight. Back-tested information reflects the application of the index
methodology and selection of index constituents in hindsight. No hypothetical record can completely account for the impact of financial risk in actual trading. For example, there are numerous factors related
to the equities, fixed income, or commodities markets in general which cannot be, and have not been accounted for in the preparation of the index information set forth, all of which can affect actual
performance.
The Index returns shown do not represent the results of actual trading of investable assets/securities. S&P Dow Jones Indices LLC maintains the Index and calculates the Index levels and performance
shown or discussed, but does not manage actual assets. Index returns do not reflect payment of any sales charges or fees an investor may pay to purchase the securities underlying the Index or
investment funds that are intended to track the performance of the Index. The imposition of these fees and charges would cause actual and back-tested performance of the securities/fund to be lower than
the Index performance shown. As a simple example, if an index returned 10% on a US $100,000 investment for a 12-month period (or US $10,000) and an actual asset-based fee of 1.5% was imposed at
the end of the period on the investment plus accrued interest (or US $1,650), the net return would be 8.35% (or US $8,350) for the year. Over a three year period, an annual 1.5% fee taken at year end with
an assumed 10% return per year would result in a cumulative gross return of 33.10%, a total fee of US $5,375, and a cumulative net return of 27.2% (or US $27,200).
15General Disclaimer
Copyright © 2020 by S&P Dow Jones Indices LLC, a part of S&P Global. All rights reserved. Standard & Poor’s ®, S&P 500 ® and S&P ® are registered trademarks of Standard & Poor’s Financial Services LLC
(“S&P”), a subsidiary of S&P Global. Dow Jones ® is a registered trademark of Dow Jones Trademark Holdings LLC (“Dow Jones”). Trademarks have been licensed to S&P Dow Jones Indices LLC. Redistribution,
reproduction and/or photocopying in whole or in part are prohibited without written permission. This document does not constitute an offer of services in jurisdictions where S&P Dow Jones Indices LLC, Dow Jones,
S&P or their respective affiliates (collectively “S&P Dow Jones Indices”) do not have the necessary licenses. All information provided by S&P Dow Jones Indices is impersonal and not tailored to the needs of any
person, entity or group of persons. S&P Dow Jones Indices receives compensation in connection with licensing its indices to third parties. Past performance of an index is not a guarantee of future results.
It is not possible to invest directly in an index. Exposure to an asset class represented by an index is available through investable instruments based on that index. S&P Dow Jones Indices does not sponsor, endorse,
sell, promote or manage any investment fund or other investment vehicle that is offered by third parties and that seeks to provide an investment return based on the performance of any index. S&P Dow Jones Indices
makes no assurance that investment products based on the index will accurately track index performance or provide positive investment returns. S&P Dow Jones Indices LLC is not an investment advisor, and S&P
Dow Jones Indices makes no representation regarding the advisability of investing in any such investment fund or other investment vehicle. A decision to invest in any such investment fund or other investment
vehicle should not be made in reliance on any of the statements set forth in this document. Prospective investors are advised to make an investment in any such fund or other vehicle only after carefully considering
the risks associated with investing in such funds, as detailed in an offering memorandum or similar document that is prepared by or on behalf of the issuer of the investment fund or other vehicle. Inclusion of a
security within an index is not a recommendation by S&P Dow Jones Indices to buy, sell, or hold such security, nor is it considered to be investment advice.
These materials have been prepared solely for informational purposes based upon information generally available to the public and from sources believed to be reliable. No content contained in these materials
(including index data, ratings, credit-related analyses and data, research, valuations, model, software or other application or output therefrom) or any part thereof (Content) may be modified, reverse-engineered,
reproduced or distributed in any form or by any means, or stored in a database or retrieval system, without the prior written permission of S&P Dow Jones Indices. The Content shall not be used for any unlawful or
unauthorized purposes. S&P Dow Jones Indices and its third-party data providers and licensors (collectively “S&P Dow Jones Indices Parties”) do not guarantee the accuracy, completeness, timeliness or availability
of the Content. S&P Dow Jones Indices Parties are not responsible for any errors or omissions, regardless of the cause, for the results obtained from the use of the Content. THE CONTENT IS PROVIDED ON AN
“AS IS” BASIS. S&P DOW JONES INDICES PARTIES DISCLAIM ANY AND ALL EXPRESS OR IMPLIED WARRANTIES, INCLUDING, BUT NOT LIMITED TO, ANY WARRANTIES OF MERCHANTABILITY OR
FITNESS FOR A PARTICULAR PURPOSE OR USE, FREEDOM FROM BUGS, SOFTWARE ERRORS OR DEFECTS, THAT THE CONTENT’S FUNCTIONING WILL BE UNINTERRUPTED OR THAT THE
CONTENT WILL OPERATE WITH ANY SOFTWARE OR HARDWARE CONFIGURATION. In no event shall S&P Dow Jones Indices Parties be liable to any party for any direct, indirect, incidental, exemplary,
compensatory, punitive, special or consequential damages, costs, expenses, legal fees, or losses (including, without limitation, lost income or lost profits and opportunity costs) in connection with any use of the
Content even if advised of the possibility of such damages.
S&P Dow Jones Indices keeps certain activities of its business units separate from each other in order to preserve the independence and objectivity of their respective activities. As a result, certain business units of
S&P Dow Jones Indices may have information that is not available to other business units. S&P Dow Jones Indices has established policies and procedures to maintain the confidentiality of certain non-public
information received in connection with each analytical process.
In addition, S&P Dow Jones Indices provides a wide range of services to, or relating to, many organizations, including issuers of securities, investment advisers, broker-dealers, investment banks, other financial
institutions and financial intermediaries, and accordingly may receive fees or other economic benefits from those organizations, including organizations whose securities or services they may recommend, rate,
include in model portfolios, evaluate or otherwise address.
16You can also read