Sage Pastel Version 14
Intelligence Reporting
Getting Started Guide
←
→
Page content transcription
If your browser does not render page correctly, please read the page content below
Sage Pastel Version 14 Intelligence Reporting Getting Started Guide
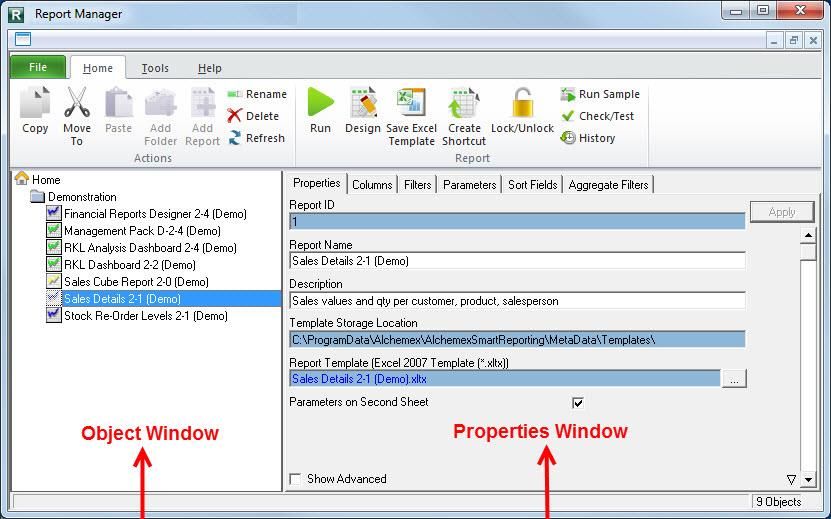
Table of Contents

Introduction ........................................................................................................................... 1
   Who Should Read This Guide ............................................................................................ 1
   About Sage Intelligence Reporting ..................................................................................... 1
      Benefits of using Sage Intelligence Reporting ................................................................. 1
   How it Works ...................................................................................................................... 2
   Overview of the Modules .................................................................................................... 3
   Overview of Standard Report Structure .............................................................................. 3
   Getting Help While You Work ............................................................................................. 4
Report Manager .................................................................................................................... 5
   Overview ............................................................................................................................ 5
      Report Manager Function ............................................................................................... 5
      Report Manager Ribbon.................................................................................................. 6
      Using Shortcut Keys ....................................................................................................... 8
      Report Properties............................................................................................................ 9
Connector............................................................................................................................ 10
   The Connector Interface .................................................................................................. 11
   Connector Ribbon ............................................................................................................ 12
   Using Shortcut Keys......................................................................................................... 14
   Data Connection .............................................................................................................. 15
   Data Container ................................................................................................................. 17
   Data Expression............................................................................................................... 19
Report Designer .................................................................................................................. 21
   About the Report Designer ............................................................................................... 21
   Choosing the Most Suitable Way to Design Reports ........................................................ 23
   Overview of the Report Designer Add-In .......................................................................... 24
   Reporting Trees ............................................................................................................... 25
      What are Reporting Trees?........................................................................................... 25
      Reporting Unit Structures.............................................................................................. 26
      Parent Child Relationships............................................................................................ 28
Security Manager ................................................................................................................ 29
Distribution .......................................................................................................................... 30
Getting Support ................................................................................................................... 31
   Other Support .................................................................................................................. 31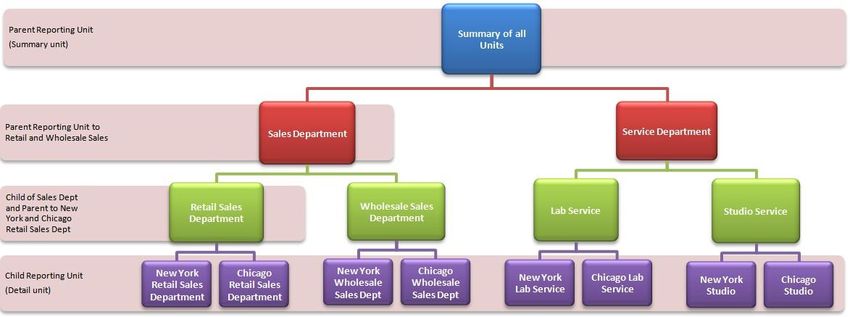
Introduction
Who Should Read This Guide
This guide is designed to help you become familiar with the Sage Intelligence Reporting modules and
their functions and is written for the novice Sage Intelligence Reporting user.
About Sage Intelligence Reporting
Intelligent business reporting at your fingertips
Sage Intelligence Reporting empowers you to quickly and easily obtain the information you need for
improved reporting across your entire business. Based on the familiar Microsoft Excel application, Sage
Intelligence Reporting lets you effortlessly create reports and analyze data, improving your visibility into
your organization and helping you make informed business decisions.
Pastel Partner gives you the competitive edge by providing business intelligence that is:
Easy to use: due to a familiar Microsoft Excel interface and a powerful set of reports to get users up
and running immediately.
Real-time: with up-to-date trusted data extracted directly from the source at the time the report is
run.
Benefits of using Sage Intelligence Reporting
Sage Intelligence Reporting sets itself apart as an intelligent step forward for users who may only be
using a spreadsheet program for their current reporting needs. Sage Intelligence Reporting increases
your productivity by eliminating manual report preparation, repetitive data extracts and complex back-
end data joins to provide you with up-to-date, accurate and presentation-quality reports for informed
decision-making.
Sage Pastel Version 14 Intelligence Reporting – Getting Started Guide Page 1 of 33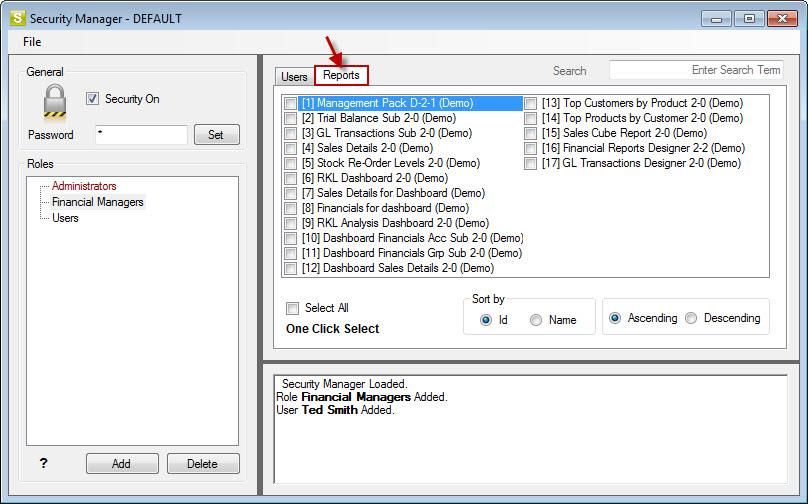
Sage Intelligence Reporting uses Microsoft Excel, which means you can view, analyze and distribute
information in a tool you already know and leverage its powerful functionality
Immediate ROI
Get up & running immediately with out-the-box financial & management reports
Save time and improve productivity through automated reports
Leverage existing Excel investment and skills in your business
Improved visibility
Extract up-to-the-minute high level summaries and dynamically drill-down to detailed ledger
transactions
Empower your staff with timely, meaningful information and trend reports to improve collaboration
Effortlessly consolidate data from multiple companies, divisions and databases
Improved flexibility
Quickly identify and respond to trends using sophisticated, customized dashboards
Efficiently view, manipulate, analyze and distribute reports in a familiar Excel format
Create in-depth financial, operations, customer, and vendor reports on-the-fly
How it Works
Sage Intelligence Reporting offers advanced reporting software that can be used to create customized
Excel reports from any compliant data source, enabling quick and easy access to real-time information
you need for operations and strategic planning. Effortlessly create reports and analyze data, utilizing the
familiar Microsoft Excel application.
Sage Intelligence software is a new generation BI product, designed from the ground up with the needs
of SMMEs in mind, for example:
It specifically addresses serious challenges around financial reporting – which is prevalent
worldwide – like departmental reporting, GL segmentation, project reporting.
It caters well for consolidated reporting from multiple sources.
The product components are structured to cater for a basic user up to the more advanced.
Sage Pastel Version 14 Intelligence Reporting – Getting Started Guide Page 2 of 33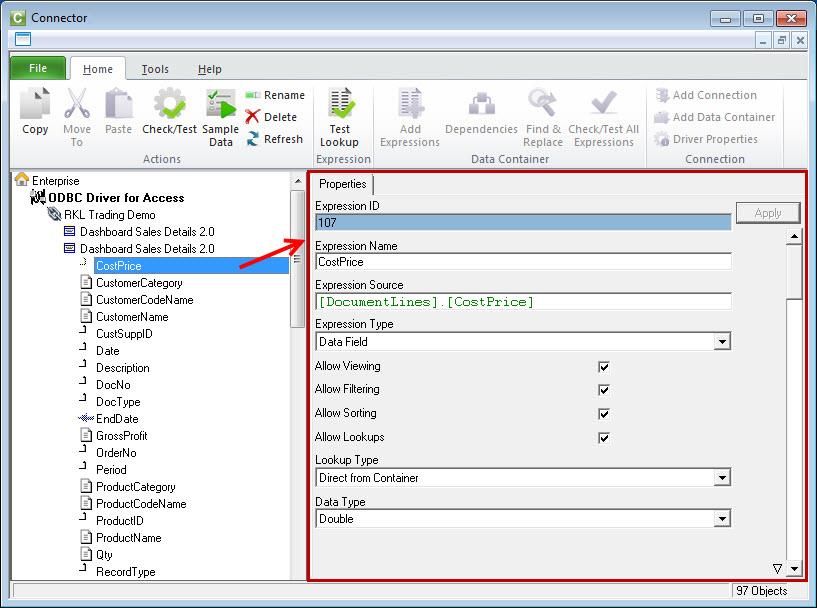
Overview of the Modules
Sage Intelligence Reporting can give users an open view of their data across several platforms and
consists of user friendly modules:
The Connector allows access to the information you need from multiple sources and consolidation of
data from multiple companies. The Connector allows for consolidations and connectivity to unlimited
ODBC data sources, includes a graphical join tool to simplify database queries.
The License Manager manages licenses for each module (Report Manager, Connector, OLAP
Manager, Report Viewer and Report Designer).
The Report Manager allows authoring of new reports from existing data containers as well as editing
of existing standard reports including filtering and aggregating of data. It also supports auto-emailing
of reports, scheduling reports, and publishing report output to HTML for intranet/Internet.
The Report Viewer allows real time running of reports, editing capabilities in Excel and offers drill-
down functionality on existing reports and templates.
The Report Designer expands upon the functionality of the Report Manager to provide simplified
“drag and drop” report creation capabilities allowing you to build impressive reports showing critical
business analytics that your management teams can use to enable insightful decision making at
every level.
The Security Manager defines security for reports and users.
Overview of Standard Report Structure
The following components form the basis of simple reporting:
A container which defines what data you are reporting from (these are housed in the Connector )
A report is linked to this container (you can have more than 1 report per container, and reports are
housed in the Report Manager – a report defines what fields you want in the report and any filters or
parameters you would like to apply to the data at the time you run the report.
An Excel workbook that is linked to a report which defines how you want the data displayed.
Sage Pastel Version 14 Intelligence Reporting – Getting Started Guide Page 3 of 33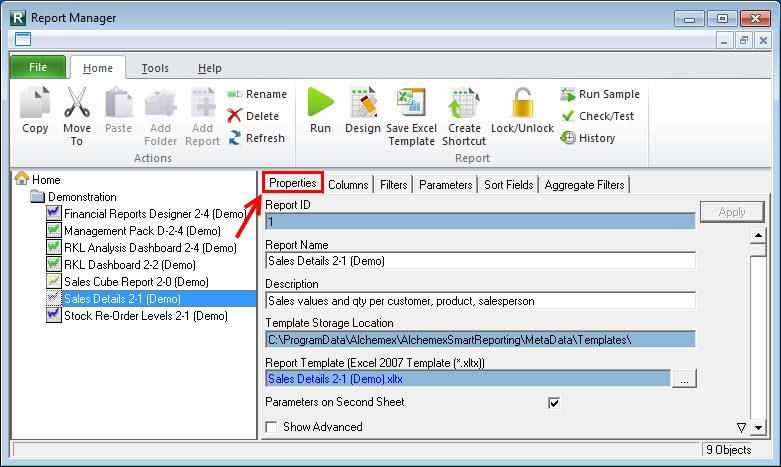
Getting Help While You Work To get help while working with Sage Intelligence Reporting press the F1 key or From within the Report Manager or Connector, on the Help tab, click View Help. From within the Report Designer Layout Generator, click the Help icon. Sage Pastel Version 14 Intelligence Reporting – Getting Started Guide Page 4 of 33
Report Manager
Overview
Report Manager Function
The Report Manager allows you to create new reports or edit existing reports, as well as filter and
aggregate data.
The following key functionality is supported in the Report Manager.
Auto connection to your ERP database.
Comes with a set of standard reports for Financial Reports, Dashboards,Sales, and GL.
You can create your own reports on existing containers.
You can import reports from other sources or that may have been specially developed.
You can copy standard reports and change them to suite your needs.
You can use the Dynamic Drill Down functionality in any report.
You can create run-time versions of your reports and run them as viewers from your desktop.
You can create your own filters and parameters to control what data is extracted at the time of
running a report.
You can schedule reports to run at set times and choose your report output i.e. email; save to HTML
for intranet/internet distribution or automatically save to a file server location.
The Report Manager Interface includes a ribbon to simplify its use.
Sage Pastel Version 14 Intelligence Reporting – Getting Started Guide Page 5 of 33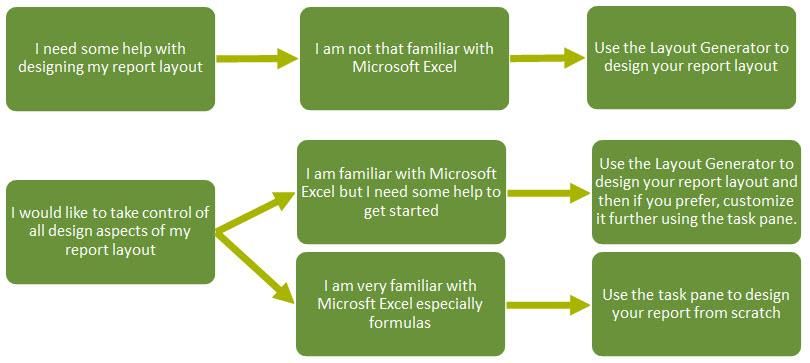
To use the functions of the Report Manager Interface you will first need to select an object (i.e. a folder
or report) in the object window. When you have selected an object in the object window, you can edit
the properties of your chosen object by using the property fields provided in the properties window. To
save any changes you make to the properties of your chosen object, you must click the Apply button.

Report Manager Ribbon
The Report Manager ribbon options are as follows:

             Icon                  Name                   Description

                                   Copy                   Copies the selected object to the clipboard

                                   Move To                Moves a connection or a container

                                   Paste                  Pastes an object from the clipboard into the selected object

                                   Add Folder             Adds a folder

                                   Add Report             Adds a new report

                                   Rename                 Allows the selected object to be renamed

                                   Delete                 Enables the user to delete their selection

                                   Refresh                Refreshes on screen properties of the selected object

                                   Run                    Runs a report

                                                          Allows the user to design a report by opening its template in
                                   Design
                                                          Microsoft Excel for modification

                                   Save Excel             Enables the user to create a template for the current report
                                   Template               from an open Microsoft Excel workbook

                                   Create Report
                                                 Automatically creates a shortcut to a report
                                   Shortcut

                                   Lock/Unlock            Locks or unlocks the current report

                                                          Runs a report using just a sample of the data (sample size is
                                   Run Sample             specified by the user). Useful when designing and testing
                                                          reports that are data intensive

                                                          Use this to check that a report satisfies minimum
                                                          requirements to function correctly. Minimum requirements are
                                   Check/Test
                                                          that at least one Column is selected and that if a template has
                                                          been assigned to the report then that the template exists

                                   History                Displays a Reports Run History

Sage Pastel Version 14 Intelligence Reporting – Getting Started Guide                                             Page 6 of 33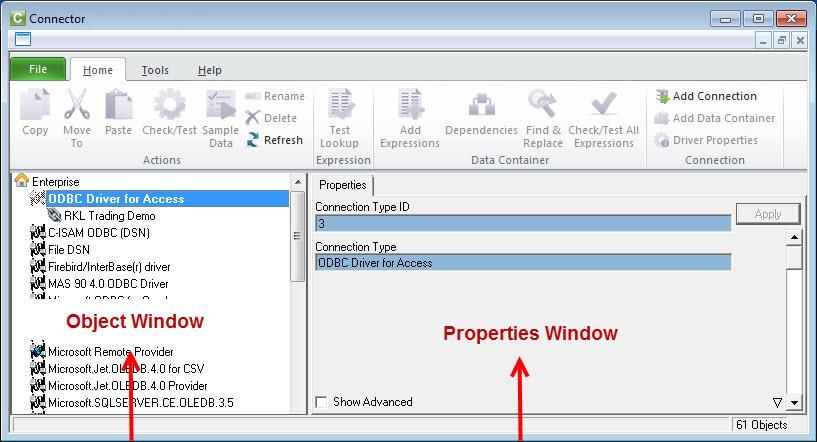
Icon                  Name                   Description

                                                          Enables the import of reports previously exported from other
                                   Import Report
                                                          Sage Intelligence Reporting systems

                                                          Enables the export of reports for import to other Sage
                                   Export Report
                                                          Intelligence Reporting systems

                                                          Allows the output of a report to be sent to the screen instead
                                   Output Mode
                                                          of Excel for debugging purposes

                                   Toggle
                                   Hidden                 Allows hidden reports to be viewed
                                   Reports

                                   Generate
                                   Scheduler              Generates the command to run the report unattended
                                   Command

                                   Bulk
                                                 Allows the bulk import of new reports or updating reports
                                   Import/Update

                                   Run All
                                                          Runs all the reports in the chosen folder from top to bottom
                                   Reports

                                   Clean Pivot            Opens template and removes all currently unused pivot field
                                   Fields                 pivot items

                                   Clear Report
                                                          Permanently deletes the instance history for the report
                                   History

                                   System
                                                          Displays the system variables available
                                   Variables

                                   Unlock                 It is possible that if a report runs into rendering problems
                                   Microsoft              Microsoft Excel can be left locked. This will unlock Microsoft
                                   Excel                  Excel and allow user interaction

                                   Help                   Launches the Help Files

                                   Website                Launches the Pastel Partner website

                                   Online
                                                          Launches the Online Academy
                                   Academy

                                   Knowledge
                                                          Launches the Knowledge Base
                                   Base

                                                          Launches the About window which allows you to view the
                                   About
                                                          product versions, licensing details and enabled features

Sage Pastel Version 14 Intelligence Reporting – Getting Started Guide                                              Page 7 of 33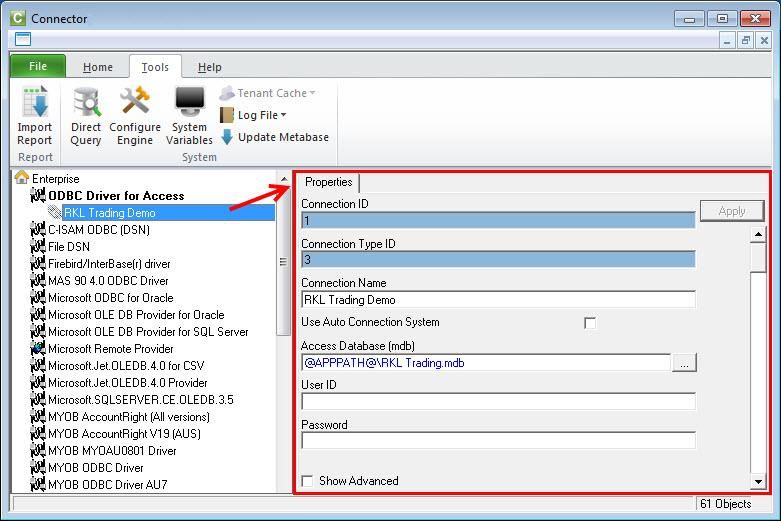
Using Shortcut Keys
You can use various shortcut keys as follows:

Shortcut Key            Description

CTRL-R                  In the Report Manager, this runs the selected report

CTRL-C                  Copies the selected object

CTRL-V                  Paste an object from the clipboard

DEL                     Deletes the selected object
F1                      Opens the help file in a new window

F2                      Renames the selected object

F5                      Refreshes the object list

F12                     Adds a child object to the selected object

Sage Pastel Version 14 Intelligence Reporting – Getting Started Guide          Page 8 of 33
Report Properties
The report type (Standard, Dataless, Sub query or Union) determines which standard tabs are available
in the selected properties window. A typical properties window of Standard report types has, besides the
properties tab, also a tab for each report output property, namely Columns, Filters, Parameters, Sort
Fields, and Aggregate Filters.

When selecting a report, tabs appear on the right of the screen. These tabs allow you to modify the
report’s display output.

Properties Tab

The Properties tab enables you to view and change general report details such as the report name and
description.

Columns Tab

The columns window lists the columns that make up the Microsoft Excel report.

Sage Pastel Version 14 Intelligence Reporting – Getting Started Guide                         Page 9 of 33
Connector
The Connector maintains the connectivity between Sage Intelligence Reporting and your ERP
accounting (or other) data sources. The Connector also allows an organization's System Administrator to
configure the metadata so as to empower the users to create their own reports.
The Connector adds additional tools for skilled users and/or consultants. This powerful report writing
solution allows you to deliver Excel reports from any ODBC compliant data source. The following key
functionality is supported.
You can consolidate information from multiple different sources.
You can consolidate information across multiple companies on the same system.
You can create your own containers incorporating user define fields.
You can use the graphical join tool to create relationships between various entities like tables and
views in your database.
You can create your own fields on the fly that are not stored in the data source.
You can take advantage of advanced query language syntax to do complex data interrogation.
You can take advantage of stored procedures or views that have been created in the source
database.
The connector contains connections to the ERP accounting database/s. Inside the connection are
containers which are the tables, joins or stored procedures in the database/s, and inside the containers
are the expressions which are the fields in the tables, joins or stored procedures.
Sage Pastel Version 14 Intelligence Reporting – Getting Started Guide Page 10 of 33The Connector Interface To use the functions of the Connector, you will first need to select an object (i.e. a Data Connection, Data Container or Data Expression) in the object window. When you have selected an object in the object window, you can edit the properties of your chosen object by using the properties fields provided in the properties window. To save any changes you make to the properties of your chosen object, click the Apply button. The Connector also includes a ribbon to simplify the use of the Sage Intelligence Reporting software functionality. Sage Pastel Version 14 Intelligence Reporting – Getting Started Guide Page 11 of 33
Connector Ribbon

The Connector ribbon has various options which perform the following functions:

  Icon       Function                  Description

             Copy                      Copies the selected object to the clipboard.

             Move To                   Moves a connection or a container

             Paste                     Pastes an object from the clipboard into the selected object

             Check/Test                Checks that the selected object will function correctly

                                       Takes a 50 row sample from the selected Source data container and
             Sample data
                                       displays this data on the data screen

             Rename                    Allows you to rename the selected connection, container or expression

             Delete                    Enables the user to delete their selection

             Refresh                   Refreshes on screen properties of the selected object

             Test Lookup               Returns all of the values from the general ledger

             Add Expressions Enables the user to add a data expression

             Dependencies              Returns the list of reports using the selected container

             Find and
                                       Finds a value and replaces it with another value
             Replace

             Check/Test All
                                       Checks all expressions in a data container.
             Expressions

             Add Connection            Enables the user to add a data connection

             Add Data
                                       Enables the user to add a data container
             Container

             Driver Properties Returns the driver properties of a connection

             Import Report             Enables the import of reports into your system

             Direct Query              Opens the SQL Direct Query window

             Configure
                                       Allows configuration options for the Excel Output Engine to be set
             Engine

Sage Pastel Version 14 Intelligence Reporting – Getting Started Guide                                       Page 12 of 33
Icon Function Description
System
Allows the system variables to be viewed
Variables
Log File Allows the log file to be viewed or deleted
Apply Metabase
Applies a supplied Metadata Hot fix or Service Pack
Update
Help Launches the Help Files
Website Launches the Pastel Partner website
Online Academy Launches the Online Academy
Knowledge Base Launches the Knowledge Base
Launches the About window which allows you to view the product
About
versions, licensing details and enabled features
Sage Pastel Version 14 Intelligence Reporting – Getting Started Guide Page 13 of 33Using Shortcut Keys You can use various shortcut keys as follows: Shortcut Key Description CTRL-R In the Report Manager, this runs the selected report CTRL-C Copies the selected object CTRL-V Paste an object from the clipboard DEL Deletes the selected object F1 Opens the help file in a new window F2 Renames the selected object F5 Refreshes the object list F12 Adds a child object to the selected object Sage Pastel Version 14 Intelligence Reporting – Getting Started Guide Page 14 of 33
Data Connection

A Data Connection holds the relevant connection information to connect to a supported ODBC or
OLEDB compliant Data Source. This Data Connection object is then used for all connections to this Data
Source. By adding a Data Connection the System Administrator can make data available from this Data
Source.

To display the properties of your data connection, in the Sage Intelligence Reporting Connector, select
the data connection in the object window. The data connection properties window will appear in the right
pane.

To Hide/Unhide advanced properties check/uncheck the Show Advanced option                                      .

Property                          Description

Connection ID                     A Technical Key Value used to identify the Data Connection.

Connection Type ID                Value used to associate the Data Connection with a Connection Type.

                                  The Auto Connection System is a system used to automate a connection to a
                                  data source at report execution time. This system allows the database
Use Auto Connection               connection properties for reports to be set at execution time and not to be hard
System                            wired into the Connection in the Connector.

                                  For More Information See Also: Auto Connection System

Connection Name                   The name assigned by the Administrator for the Data Connection.

                                  The user ID that will be used to gain a connection to the underlying Data
User ID
                                  Source.

Password                          The Password that will be used to gain a connection to the underlying Data
Sage Pastel Version 14 Intelligence Reporting – Getting Started Guide                                    Page 15 of 33
Property Description
Source.
Forces the full Date and Time values to be passed to the underlying database
system. If this option is not selected the Date Format (to pass to Driver) will be
enabled and the format specified will be used, otherwise the Date Time
Use Time with Dates
Format (to pass to Driver) will be enabled and the format specified will used.
For More Information See Also: Connection Date Time Formats
The Date format that the underlying Database System expects Dates to be
presented in. This is the format that Sage Intelligence Reporting will convert
dates to, before passing them to the underlying system. This needs to be
correctly configured in order for Filters and Parameters to work correctly with
dates in the Report Manager Interface. It is not the Date that a user of the
Date Format (to pass Report Manager has to use.
to Driver)
For More Information: For a full list of the expected Date Formats for
supported Connection Types, refer to Connection Date Formats.
TIP: This is only available when Use Time with Dates is not selected.
The Date Time format that the underlying Database System expects Dates/
Times to be presented in. This is the format that Sage Intelligence Reporting
will convert dates to before passing them to the underlying system. This needs
to be correctly configured in order for Filters and Parameters to work correctly
with dates in the Report Manager Interface. It is not the Date that a user of the
Date Time Format (to Report Manager has to use.
pass to Driver)
For More Information: For a full list of the expected Date Formats for
supported Connection Types, refer to Connection Date Formats.
TIP: This is only available when Use Time with Dates is selected.
This is the Date Delimiter that the Connection expects dates to be prefixed
and suffixed with. This needs to be correctly configured in order for Filters and
Date/Time Delimiter Parameters to work correctly with dates in the Report Manager Interface. Most
systems use a single quotation mark (') for this while some use a hash (#)
symbol.
Connection Type Sets the type of the Data Connection.
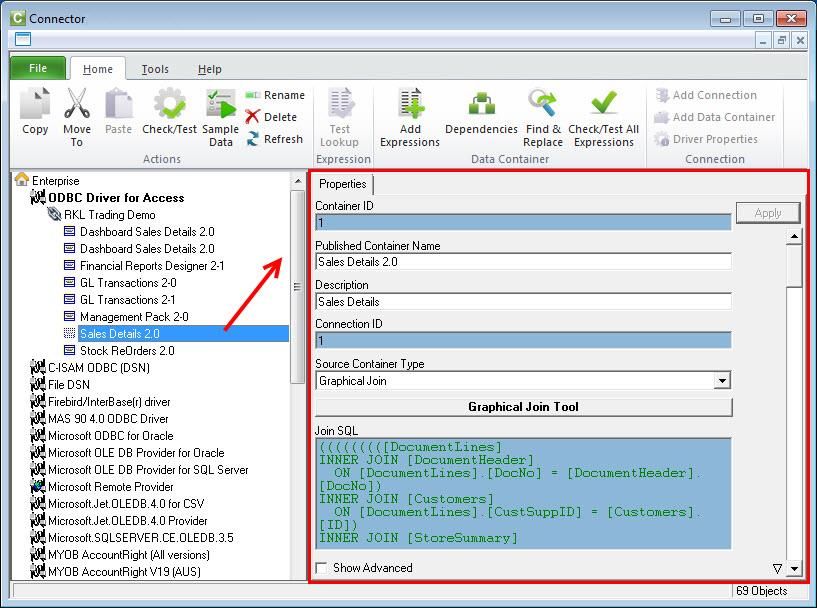
Sage Pastel Version 14 Intelligence Reporting – Getting Started Guide Page 16 of 33Data Container
Using the Connector, data is made available through the addition of data containers and relevant
expressions. The source of the underlying data can be a Table, a View, a Stored Procedure or a user
defined SQL Join or Graphical Join.
To display the properties of your data container, select the data container in the object menu. The data
container properties will appear in the properties pane.
Property Description
Container ID A Technical Key Value used to identify the Data Container
Published Container
The name assigned by the System Administrator for the Data Container
Name
Description A description for the Data Container
A Technical Key Field for the Data Connection to which the Data Container is
Connection ID
assigned
The name of the underlying Source Data Structure (TABLE, VIEW or
STORED PROCEDURE) or a supported SQL JOIN to define a set of Data.
Source Container
Note that selection for the Source Container Type property must reflect what
is held in this Source Container property
This is used to specify how the underlying source data is held. Set this to
TABLE if it is simply a single data structure (most common), to a VIEW if it is
Source Container Type
a virtual table based on a query and to a JOIN if it is a logical combination of
data from two ore more tables defined using a SQL join
Sage Pastel Version 14 Intelligence Reporting – Getting Started Guide Page 17 of 33Property Description
Allows a threshold to be set for the amount of time that Sage Intelligence
Reporting will spend attempting to query the Data Container
Set this to 0 for Sage Intelligence Reporting to wait indefinitely for
execution to complete
Timeout Enquiries After Set this to -1 for Sage Intelligence Reporting to use the defaults
(Seconds) settings of the underlying database system
NOTE: This setting may have no effect for certain underlying Database
systems.
For More Information: Refer to Troubleshooting Timeouts.
Sets the Company that has been authorised to import reports that use this
Container Licensed To container. If this property is left blank then anyone can import and use the
Container.
Sets the Company that is the owner of the original Container and all those
Container Owned By
created on import to other systems.
In addition to these container properties you can also view a list of reports that have been created from
this container.
To view the list, do the following:
Right-click on the container and select Show Dependencies.
The following message will display, listing the reports that are dependent on this container.
Sage Pastel Version 14 Intelligence Reporting – Getting Started Guide Page 18 of 33Data Expression
A Data Expression is a field in a data container chosen by the Connector to be available through the
Report Manager.
To display the properties of a data expression, select a data expression in the object window.
The properties of the data expression will be displayed in the right properties pane.
To Hide/Unhide advanced properties, check/uncheck the Show Advanced option. .
Property Description
Expression ID This is a Technical Key Identifier for the Data Expression.
Expression
The Name or Alias for the Data Expression.
Name
Expression The Source Data Field Name of the underlying data for the Data Expression or a SQL
Source Expression or an Excel Formula depending on the Expression Type (see below)..
This indicates the type of expression that is being used. By default it is set to Data
Field and in this case will be referring to a single column in an underlying Data Table.
It can also be set to SQL Expression to allow a raw SQL expression to be used
(including the use of the ODBC drivers available Functions), or to Microsoft Excel
Expression Formula
Type In the last case Microsoft Excel formulae can be specified in the Expression source.
No equal sign should be used to prefix the formulae. When Microsoft Excel formulae
are used here then to reference other Data Expressions in the formula use their
Expression Names. For example, CONCATENATE(Category," - ",ProductName)
If the Expression names have spaces or other non Alpha-numeric characters in them
Sage Pastel Version 14 Intelligence Reporting – Getting Started Guide Page 19 of 33Property Description
then simply replace these characters with underscores in your Microsoft Excel
Formula.
Allow users to Report on this Expression. This setting allows the user to add this
Allow Viewing expression as a column to a report. If switched off it does not stop reports functioning
that were created before the setting was changed.
Allow users to filter on this Expression. This setting allows the user to add this
Allow Filtering expression as a filter to a report. If switched off it does not stop reports functioning
that were created before the setting was changed.
Allow users to perform sorting using this Expression. This setting allows the user to
Allow Sorting add this expression as a sort field to a report. If switched off it does not stop reports
functioning that were created before the setting was changed.
Allow users to perform lookups on this Expression which will make Parameter Lookup
Lists available for this Expression. This option should only be used on Data
Allow Lookups
Expressions which are expected to have a fairly limited set of distinct values. Using
Lookups against large diverse data sets can vastly hinder system performance.
Sets where the Parameter Lookup List dataset is pulled from. See Defining
Lookup Type
Parameter Lookups for further information.
The underlying data type for the Expression. If you change an Expression to be of
Data Type Expression Type SQL Expression then you should pick the correct Data type that the
Expression is expected to return.
Sage Pastel Version 14 Intelligence Reporting – Getting Started Guide Page 20 of 33Report Designer About the Report Designer The Report Designer makes reporting simple, flexible and fast by giving you the ability to customize your financial report layouts instantly. It is recommended for finance professionals and executives who need to create financial reports on a regular basis. In the Report Designer, the design of your financial reports are completely separate from your general ledger. As a result, you can easily change reports without modifying your accounting system’s general ledger. There are two options to design your financial report layouts: the Layout Generator and the Task Pane. The Layout Generator gives you the power to transform Microsoft Excel data in a raw spreadsheet format into a meaningful layout by using an intuitive drag-and-drop interface. Sage Pastel Version 14 Intelligence Reporting – Getting Started Guide Page 21 of 33
For those professionals who want to have complete control of their report layout and who are familiar
with Microsoft Excel, the task pane allows a completely customized layout to be designed using
Microsoft Excels' powerful functionality.

Sage Pastel Version 14 Intelligence Reporting – Getting Started Guide                         Page 22 of 33
Choosing the Most Suitable Way to Design Reports

Depending on the level of control you would like in the design of your report and your knowledge of
Microsoft Excel, the Layout Generator may be used to simplify generating reports, otherwise the task
pane may be used.

Follow the process below to determine the best option for you to design reports.

If you do not have an advanced knowledge of Microsoft Excel then the layout generator provides an
intuitive drag and drop interface to design reports. If however, you do have an advanced knowledge of
Microsoft Excel and am familiar with Microsoft Excel formulas then the task pane provides a complete
solution to design your reports using powerful Microsoft Excel functionality giving you complete control.

 Note: In order to do multiple company consolidated reports, the Task Pane will need to be used.

Sage Pastel Version 14 Intelligence Reporting – Getting Started Guide                           Page 23 of 33
Overview of the Report Designer Task Pane

The Report Designer Task Pane is the newest addition to the Report Designer module which presents
an alternative to the current report layout generator to empower users to take control of all design
aspects of their reporting layouts.

The model behind the new feature introduced by this add-in is to break down a report into reusable
pieces and then allow users to control where and how these pieces fit together to create a report. These
pieces are Excel functions which communicate with a new In-Memory processing engine which will
guarantee performance by being able to crunch financial numbers very quickly.

While the Report Designer Task Pane is installed separately, it enhances the Report Designer
module. The positioning of the Report Designer Task Pane within the overall Sage Intelligence
Reporting product is as follows:

Sage Pastel Version 14 Intelligence Reporting – Getting Started Guide                         Page 24 of 33
Reporting Trees

What are Reporting Trees?
Although you can create financial reports without the aid of a reporting tree, the reporting tree allows you
to model a very sophisticated reporting structure and view your organization in many different ways with
the click of a button. Some companies may have very complex corporate hierarchies that require
hundreds of tree units, as well as other hierarchies that require much fewer tree units.

Most organizations have a hierarchical structure in which departments (or other business units) report to
one or more higher-level units. In a traditional organizational chart, the lower units on the chart typically
report to increasingly higher units.

Sage Intelligence Reporting uses the term reporting unit for each box in an organizational chart. A
reporting unit can be an individual department from the general ledger, or it can be a higher-level,
summary unit that combines information from other reporting units. For a Report Designer layout that
includes a reporting tree, one report is generated for each reporting unit and at the summary level. All of
these reports use the text columns, row and column layouts that are specified in the Report Designer.

Each reporting tree contains a group of reporting units. Sage Intelligence Reporting allows you to easily
add or change reporting units without requiring a change to your financial data.

Sage Pastel Version 14 Intelligence Reporting – Getting Started Guide                             Page 25 of 33
Reporting Unit Structures
Sage Intelligence Reporting uses the following kinds of reporting units:
A detail unit draws information directly from the financial data or from a Microsoft Excel spreadsheet
file.
A summary unit summarizes data from lower-level units.
A reporting tree consists of parent reporting units and child reporting units:
A parent reporting unit is a summary unit that pulls summarized information from a detail unit. A
summary unit can be both a detail unit and a summary unit; that is, a summary unit can draw
information from a lower unit, the financial data, or an Excel spreadsheet. Thus, a parent unit can, in
turn, be the child unit of a higher parent unit.
A child reporting unit can be either a detail unit that pulls information directly from the financial data
or a spreadsheet, or it can be an intermediate summary unit (that is, the parent unit to a lower unit,
but also the child unit to a higher-level summary unit).
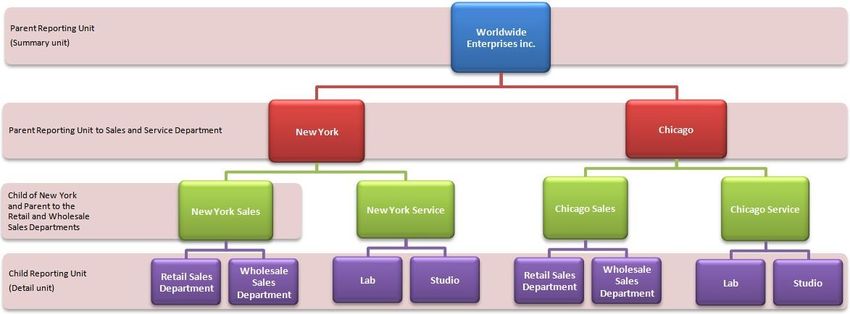
The following diagram shows the parent and child reporting units, and their hierarchical relationship, for
the organization Worldwide Enterprises inc.
The lowest-level detail reporting units (Retail Sales, Wholesale Sales, Lab and Studio) represent
departments in the financial data.
The higher-level summary units simply summarize information from the detail units.
In Sage Intelligence Reporting, you can create an unlimited number of reporting trees to view your
organization in different ways. Each reporting tree can contain any combination of departments and
summary units.
By rearranging the structure among the reporting units, you can create different reporting trees. You can
then use the same Report Designer Layout with each reporting tree, enabling you to create different
financial report layouts very quickly.
For example, the diagram below shows a reporting tree that is essentially the same as the reporting tree
that is shown above. The difference is that the reporting structure displays an organizational structure
that is divided by business function instead of by location. These two reporting trees demonstrate
different perspectives on entity operations.
Sage Pastel Version 14 Intelligence Reporting – Getting Started Guide Page 26 of 33If you create several different reporting trees, you can print a series of financial statements each month that analyze and present your entity's operations in various ways. Sage Pastel Version 14 Intelligence Reporting – Getting Started Guide Page 27 of 33
Parent Child Relationships
The most common type of reporting tree is composed of parent units that pull summarized information
from the detail units and child units that contain detail units of account information. However, many
detail/summary hierarchy combinations can be created. A child unit can be both a child to the higher unit
as well as a parent to a lower unit. See topic Reporting Unit Structures.

You can create this parent/child hierarchy structure by moving individual reporting units or an entire
branch (parent unit and all child units) to higher or lower levels on the graphical tree. This is called
promoting and demoting units. Promoting a unit moves it to a higher level in the tree. Demoting a unit
moves a unit to a lower level. When you build a reporting tree, you can promote and demote reporting
units using a drag-and-drop operation.

Sage Pastel Version 14 Intelligence Reporting – Getting Started Guide                           Page 28 of 33
Security Manager
The Security Manager is an administration tool that lets an administrator manage roles (user groups) and
assign users and reports to each role. When security is enabled the user will be required to login and
then will only have access to the reports selected for the role that the user belongs to. The Security
Manager ensures that access to important or sensitive reports is securely controlled.
TIP: It is highly recommended that security be enabled to prevent unauthorized user access into the
security manager.
The following rules apply:
Report level security will by default be switched off at installation and must be switched on within
Security Manager to take effect.
Only users added to the Administrators role will be allowed to Add/Edit/Delete reports within the
Report Manager.
The list of users within the Security Manager will be synchronized from the Pastel Partner user list.
The Security Manager allows you to:
Set Security On or Off
Manage Roles
Select which users belong to which Roles.
Select which Reports belong to which Roles.
Sage Pastel Version 14 Intelligence Reporting – Getting Started Guide Page 29 of 33Distribution Improve workflow and speed up business processes by automating report delivery and distribution. Report distribution is a powerful feature which saves time and effort by allowing you to send reports to a file, ftp site or email in a number of standard formats. Set up which reports you would like to distribute, whether you would like them in Microsoft Excel, HMTL or PDF and who it should be sent to. You can even create custom criteria for sending out reports. Features include the ability to customise each email format, use your existing outlook profile and address book, or specify a SMTP or Exchange server. The same report can be set up to be distributed to different destinations. Distribution is ideal for sending reports out to line managers or providing corporate management with tailored reports. Sage Pastel Version 14 Intelligence Reporting – Getting Started Guide Page 30 of 33
Getting Support

The Sage Intelligence Reporting Help Files have been written to provide maximum information and
assistance to all Sage Intelligence Reporting users. Every effort has been made to make Sage
Intelligence Reporting easy to understand and use.

For further assistance, please contact:

Sage Intelligence Reporting Team:                      0861 102 302

Website:                                               www.sagepastel.com

Email:                                                 isales@sagepastel.com

Support:                                               isupport@sagepastel.com

Training:                                              (011) 304 1400 or (031) 304 3038

Online Training Academy:                               www.alchemexacademy.com

Other Support

For more information about obtaining support, please contact your Certified Sage Intelligence Reporting
Dealer or Call Centre.

Sage Pastel Version 14 Intelligence Reporting – Getting Started Guide                        Page 31 of 33
You can also read