SAIL. User Guide European Bioinformatics Institute SIMBioMS.org Version 1.01
←
→
Page content transcription
If your browser does not render page correctly, please read the page content below

European Bioinformatics Institute
                  SIMBioMS.org

                         SAIL.
                    User Guide

                      Version 1.01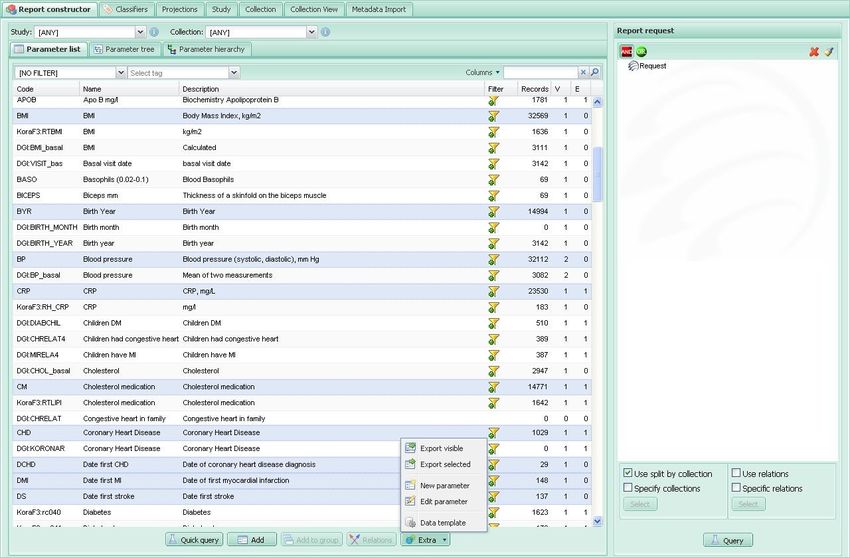
INDEX:

What is SAIL.

Install SAIL.

Understanding SAIL.
      Parameters, Classifiers and Vocabularies.
             What is a classifier in SAIL.
             What is a vocabulary in SAIL.
      Parameter classification
      Collections and Studies
             What is a Collection
             What is a study
      Parameter import
             Structure description section
             Variable section
             Qualifiers section
             Inherited parameters section
             Classification section
             Relations section
      Parameters import file format (vocabulary import)
      Data availability import file format
      Report Constructor Interface

How to Use SAIL.
      Summary of Data
      User interface
             How to add a parameter into a report.
             How to add a group of parameters into a report.
             How to add a parameter to a group.
             How to add enumerated values of a parameter into a report
             How to add value ranges for a parameter into a report
             How to split by collection
             How to combine parameters
             Use split by collection
             Use Parameter relations
             Export list of parameters
             Parameter trees and hierarchies
             How to combine parameters
      Administrator Interface
             Produce a template for data import
             Create new classifiers.
             Create projections.
             Create a new study
             Create a new collection
             Metadata Import (relations and vocabulary upload)
Application Design.

SAIL Glossary.

Appendix:
     Vocabulary import
     Data availability import.
     Quick guide to create Data and vocabulary import files
     Hidden feature: Predefined queries.

Example Files.
     Vocabulary
     Data Availability
     Relations
     Study
What is SAIL?

SAIL (SAmple availability index) is a web-application that provides a federated view
on data availability across different data repositories. SAIL has been designed to be
able to deal with both data availability matrices and metadata (data that is used to
describe availability data). SAIL is divided in two different user interfaces - one for
end users and one for administrators. The user interface provides means to browse
metadata and to prepare and view availability reports. The administrator interface is
intended for editing metadata and underlying structures and importing both metadata
and availability data.

Install SAIL
Pre-requisites
To install SAIL the following software needs to be preinstalled in your system:
   • Apache Tomcat.
   • MySQL database.

Installation procedure
SAIL is distributed as a package that consists of 3 files:
   • SAIL.war (Web Application Archive) file. This is the application file
   • sail.xml is an example config file.
   • sail_schema.sql contains the schema that needs to be loaded in the database.

After downloading the distribution package from
http://www.simbioms.org/index.php/downloads-mainmenu-43.html#SAIL
Extract the three files in a local folder.

Installation steps
    1. First you need to load the database schema. There are two way to do this:
            a. You can create the database and load the schema from the command
                prompt (windows) or terminal window (MacOsX, Linux).
                Run the commands:
               mysql –uuser –ppassword –Ddatabase –e”create database
               sail”
               mysql –uuser –ppassword –Ddatabase <
               “Location/of/file/sail_schema.sql”
           b. If you are using a MySQL database software like “phpmyadmin” you
              will need to create the database first. In the database tab go to the
              create new database section and add the name of the database (i.e.
              sail).Click on create. Once the database is created go to the import tab
              and select the file to import (sail_schema.sql). Check that you have
              selected the SQL option in the Format of imported file. Click Go.
              Now your database should ready.
              See phpmyadmin or your database management software
              documentation for more information on how to create a database and
              load the database schema.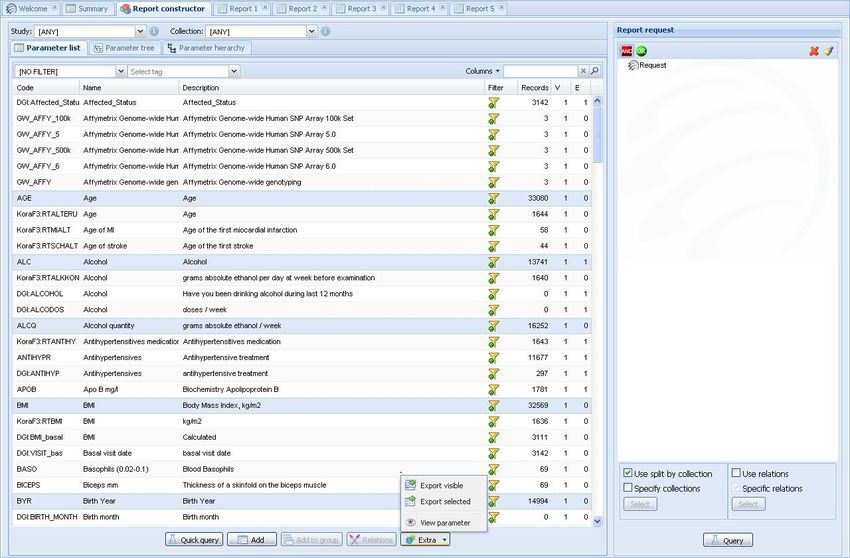
2. Deploy SAIL software. The easiest way to install SAIL is by copying the
      SAIL.war file in your $CATALINA_HOME/webapps directory
      ($CATALINA_HOME will be defined by your tomcat installation). Once the
      file is copied Tomcat will automount SAIL and create the sail directory with
      the application (Note it may take a few minutes for tomcat to detect and
      deploy the SAIL.war).
   3. Edit the file sail.xml. This file is use to configure the database access in SAIL.
      You need to change the values in SAIL_DBUserName and
      SAIL_DBPassword for those needed to access your mysql instance.
      Once the file is edited, copy it to
      $CATALINA_HOME/conf/Catalina/localhost/sail.xml
   4. Configuration of SAIL. The basic functionality of SAIL can be used without
      any extra configuration. If you want to enable the admin interface that allows
      for advance functionality see the instructions in the configuration section.

Configuration
There are only 2 files that need to be modified in order to enable the admin interface.
In the file $CATALINA_HOME/webapps/WEB-INF/web.xml you need to describe
the security role that enables the admin interface.

-
The role that is required to log in to the
SAIL
SAILAdmin

To define the user and password for the security role previously defined you need to
modify the file $CATALINA_HOME/conf/tomcat-users.xml. (You may need admin
rights in order to edit this file).
Within the section - you need to create a role for SAIL admin

You also need to create the user name and the password to be used when login in
the admin interface of SAIL

Every time the configuration file has changed you will need to restart Tomcat.

Understanding SAIL
Parameters, Classifiers and Vocabularies.

The main goal of developing SAIL is to produce a tool for sample availability reports.
SAIL uses availability information that is collected from a number of repositories. It
allows the generation of complex queries to get as fine a report as required.

A major part of biomedical investigations is data collection and annotation. The best
way to annotate collected data and metadata is to use commonly accepted terms and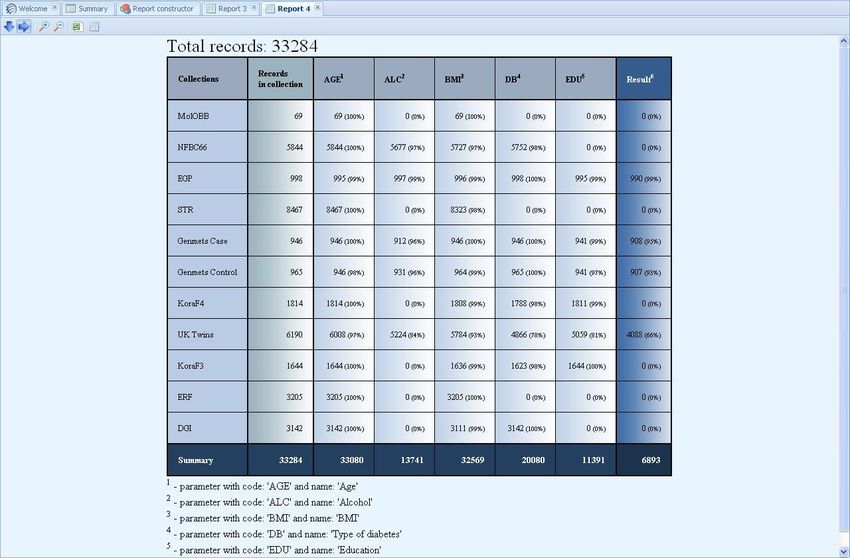
notions. There are a number of projects for developing sets of such terms for different
fields of bioinformatics. SAIL also deals with the description of submitted data. A big
part of SAIL is a subsystem to create, manage and classify parameters that are used
for data descriptions.

What is a classifier in SAIL?

Classifiers in SAIL are the basic descriptor units and are used to add information to
Parameters and Collections of parameters in a structured way.

SAIL allow for 6 types of classifiers:

   •   Parameter. This is the main type of classifier. A classifier of this type will be
       used when creating a vocabulary to add features to a parameter. Parameter
       classifiers are comprised by Name, Type and Tags as mandatory fields and
       Description and Classification as optional fields. There are also two radio
       buttons to specify if one parameter can have more than one values of this type
       of classifier and to specify is the classifier is mandatory so a parameter so have
       it defined when creating a vocabulary.One example would be a classifier of
       name Vocabulary. This would be used to specify to which vocabulary a
       parameter belongs. As SAIL may contain various vocabularies defined they
       are defined as tags in the classifer. When creating a parameter we can then
       specify to which vocabulary if belongs by adding the corresponding tag.

   •   Classifier. Classifiers of type classifier are used to add information to other
       types of classifiers so they can be easily organized. This is useful in cases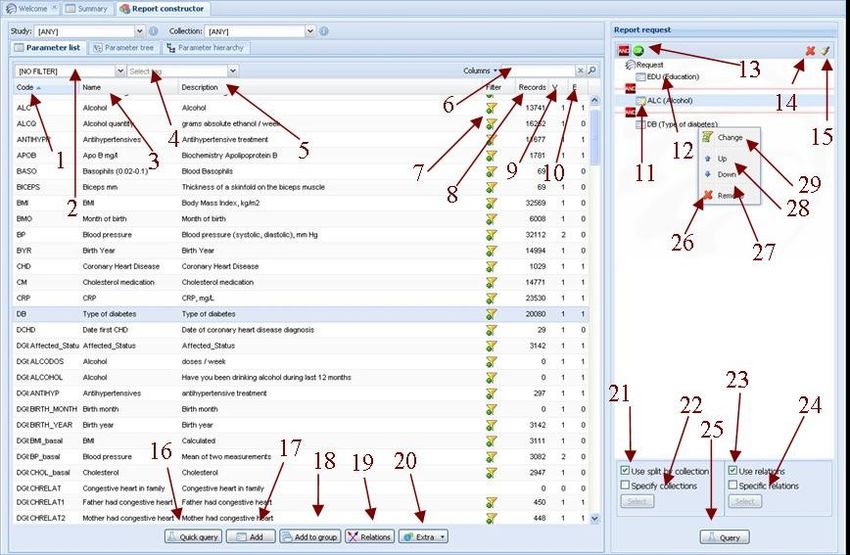
when there are lots of classifiers defined in SAIL and a user wants to filter
    them to one specific type in order to find the classifiers he wants to edit.

•   Relation. These classifiers are used to specify the types of relations between
    parameters allowed for a specific vocabulary.

•   Collection, Study and Parameter Annotation. These three types of classifiers
    are used to add descriptions to the collections, studies or parameters
    themselves and not to the data they hold. For example a Collection classifier
    can be one to describe a repository and it may have tags to add information
    about who is the data provider and how to contact the person responsible of
    the repository which is useful information that is not directly related to the
    sample data.
What is a vocabulary in SAIL?

Vocabularies are lists of parameters that have been defined to be used when
describing samples. Different types of sample collections, studies and even different
users may use different terms when describing their samples. In order to harmonize
the annotation of samples to improve compatibility among collections and ease
querying SAIL supports the creation of vocabularies and provides tools to relate terms
from multiple vocabularies

What is parameter from SAIL point of view?

The simplest and most commonly used case is a parameter that consists of single
variable. Such kind of parameter describes single physical values such as temperature
or concentration. In addition to variables, every parameter has Code, Name and
Description. Code is used to attach a short and stable designation to each parameter.
Name is short but human readable designation of parameter. Name can be translated
to different languages if required. Description is free-text part of parameter structure.
Descriptions can be as long as required and it is assumed it will contain as much
information about the nature and origin of the parameter as possible. Variable itself
can belong to different types: ENUM, INTEGER, STRING, REAL, BOOLEAN and a
special type of Boolean called TAG. ENUM is used for variables that take on a
number of fixed string values like, for example, MALE and FEMALE.

Here is example of simple parameter

Parameter   AGE
Name        Age

Description Age of patient
Variable    Age
Type        INTEGER

Example with ENUM variable

Parameter     TWINZYG
Name          Zygosity twins
Description   Type of twins zygosity
Variable      Type
Type          ENUM
Variant       monozygotic
Variant       dizygotic
Variant       opposite sex dizygotic

Another type of parameter is one that can’t be described by just a single variable. As
an example, blood pressure can be defined with two INTEGER variables, one for
Systolic and one Diastolic pressure.

Parameter     BP
Name          Blood pressure
Description   Blood pressure
Variable      Systolic
Type          INTEGER
Variable      Diastolic
Type          INTEGER

Next case is when we have a value described by one variable and besides we need to
attach some additional information about how this value was taken. For example we
need to measure temperature but it is important when this measurement was made. So
each temperature reading must be qualified by an enumeration (Morning, Afternoon).
For this purpose parameters with qualifiers were established. For instance:

Parameter     GLUTM
Name          Glucose w timing
Description   Glucose with timing, mMol/L
Variable      Concentration
Type          REAL
Qualifier     Timing
Variant       fasting
Variant       non-fasting
Note: we can have as many qualifiers as required.

The previous example introduces one problem. It may be cases when we have a more
generic parameter (i.e. Glucose Concentration) and parameters that may be more
specific and look like and extension of the more generic one (i.e. Glucose
concentration with Timing). If no relation is established between these two parameters
queries using the more generic parameter will present incomplete availability counts.
This will happen as none of the samples with availability information annotated using
the more specific parameter will be taken into consideration. To avoid such situation
parameter inheritance was introduced.

Parameter     GLU
Name          Glucose
Description   Glucose, mMol/L
Variable      Concentration
Type          REAL

Parameter     GLUTM
Name          Glucose w timing
Description   Glucose with timing, mMol/L
Inherit       GLU
Qualifier     Timing
Variant       fasting
Variant       non-fasting

In the example above, parameter GLUTM inherits parameter GLU. This means that
GLUTM also has variable Concentration that coincides with the corresponding
variable from GLU parameter. In a report where GLU must be counted GLUTM will
be also counted. All qualifiers and variables from the top level parameter will be
inherited in the derived parameter. If the derived parameter doesn’t add any own
variables or qualifiers then such parameter will be a full alias of the basic parameter.
This may be useful in cases where we need to have two different names for one
parameter like when we want to add multiple language support.

Parameter classification

Having created a set of parameters described as above we need to have a way to
classify them. Tags will be used for classification. A tag is a simple string that is
attached to a parameter. Every tag belongs to a tag class. Tag classes denote an entire
classification field and every tag is for a particular region in that field.
For example let’s suppose that we have a number of figures of different shapes and
colors. And we need to classify them by these features. We need to have tag classes
“Color” and “Shape”. Then we need to have a number of tags within every class e.g.
“Red”, “Blue” and “Green” within “Color” and “Square” and “Circle” within
“Shape”.

                                    Green
                          Blue
                 Red
 Shape                                         Color
 class                                         class
     Circle

    Square

We can consider the Tag class as a classifier and tag values as classifier values. Every
class has two options. The first "is this classifier mandatory?" that means that every
parameter must have one of the tags from this class. And the second , does this
classifier allow to attach several tags to one parameter?.
Parameter GLU Name Glucose Description Glucose, mMol/L Tag Ontology P3G Tag Ontology ENGAGE Tag Physical value Concentration Tag Knowledge domain Systems biology Variable Concentration Type REAL Tags provide an easy way to group and search parameters. In SAIL one can also filter parameters by the value of a classifier. One useful way to represent parameters is in a tree-like projection. In a projection tree every layer of the tree corresponds to one of the classifiers and every branch corresponds to a tag from that classifier. Leaves of the tree correspond to parameters. When more than one classifier has been defined for our data set we need to define the order of preference in which different classifiers will be used when building the tree. This specification of classifier hierarchy within a tree is known in SAIL as a projection.
Let’s consider an example.

Parameter     Classifier        Tag
P1        Ontology         P3G
          Ontology         ENGAGE
          Knowledge domain System biology

P2         Ontology         ENGAGE
           Knowledge domain System biology

P3         Ontology         ENGAGE
           Knowledge domain Clinical trials

P4         Ontology         P3G
           Knowledge domain Clinical trials

P5         Ontology            ENGAGE

Now we need to choose a projection. Let it be {Ontology, Knowledge domain}. So
the tree will look like:

If we change the order of the classifiers {Knowledge domain, Ontology} the tree will
look as such:
Using different projections we can easily organize parameters into as many ways as required for a particular case. Collections and Studies. What is a collection? A collection in SAIL is an availability data set coming from one data provider where all the samples have been annotated using a common vocabulary. What is a study in SAIL? A Study is a way to group data availability coming from different collections with the common denominator that it has been used during the development f a study. This was of grouping data is useful when samples from many collection have been used and the user wants to keep track of what samples have been selected for each study. Samples that take part in a study must have two labels, one indicating if the sample was eligible for the study and another one to show if the sample has been used during the study. Samples don’t need to be eligible in order to be used in a study as eligibility only means that the sample has the feature we are studying and we may want to add some control samples. For examples in a study of Diabetes we may want to use samples where the individual has diabetes (eligible) and samples when the patient is “healthy” (non eligible).
Parameters import

Parameters can be entered into the system using the parameter edit form. This is a
common form for both creation and amending of parameters. This form has a basic
section that includes Code, Name and description of parameter and also six additional
sections for

   •   Annotations
   •   Variables
   •   Qualifiers
   •   Inheritance
   •   Classification
   •   Relations
Structured description section

Structured descriptions or annotations are like descriptions but every such description
has attached a tag of a classifier of type “Parameter Annotation”. The use of
structured description allows split the description of a parameter into well-defined
sections.

Variables section

Variables section is for adding, editing and removing variables. Listed in this section
are both owned variables and inherited variables. Only owned variables can be edited
or removed. There is a form for variables manipulations.

The form allows changing variable name, choosing type for new variable, and editing
description of variable. For ENUM variables there are two additional fields. One for
choosing to use only predefined values (otherwise new case values can be added
during data submission). And the other one is a table for predefined values. Any
number of values can be added to this table.

Qualifiers section

Qualifiers section is similar to the variable section. The qualifier and variable forms
are similar, with the difference that the qualifier form has no Type field.
Inherited parameters section

In Inherited parameters section one can add and remove inherited variables. Not only
directly inherited parameters will be listed but also all ancestors. Such ancestors are
here for information and they can't be removed explicitly.

Classification section

Classification section contains tags that are used for parameters classification. (See
classifiers section).

Relations section

Relations section contains ParameterTag couples. Parameter is destination of
relation and Tag describes type of relation.

Relations are unidirectional so if two parameters are related we need to create entries
in both parameters specifying the type of relation.

Parameters import file format (vocabulary import)

In addition to using a form for parameter input there is the possibility to batch upload
new parameters. Batch upload file format was designed so that it can be easily
prepared using spreadsheet programs like MS Excel. Actually this file is plain tab-
delimited text in Unicode encoding. Such file can be created by MS Excel by
choosing correspondent option (Save As Unicode Text). File format is row oriented.
That means that every unit takes one row. Rows in turn can have several parts
separated by tabs (or in case of Excel located in several cells in one row). Any
number of empty rows in any part of the file is allowed. Such rows can be used as
separators to facilitate human readability of the file. Every (non empty) row must
begin from one of the following keywords:

   •   Parameter
   •   Tag
   •   Variable
   •   Qualifier
   •   Description
   •   Variant
   •   Inherit
   •   Relation
   •   Type
   •   Predefined
   •   Annotation

Every keyword can be used only in the appropriate context. The file begins with a
global context. In the global context only Tag and Parameter rows are allowed. The
Tag row (in global context) provides tag descriptions that will be applied to every
parameter that is defined within this file. Tag line syntax is as follows:
Tag Classifier Name Tag Name

For example:

Tag Vocabulary MetS

Global context can contain as many Tag lines as required or none at all.

The Parameter row commences the parameter context. This context will span until
the next Parameter row or to the end of the file. There is no way to go back from
parameter context to global context. All keywords can be used inside the parameter
context but there are some rules. Parameter line syntax is as follows:

Parameter Parameter Code

The parameter code is the unique identifier of the parameter. Code must consist of
symbols: a-z, A-Z, 0-9 and colon (:). Spaces are not allowed. As Parameter code must
be unique it is recommended to prefix it with colon. Such prefix can be a short
designation of the vocabulary to which the parameter belongs (i.e. MetS:Glu for
Glucose concentration in vocabulary for Metabolic syndrome).

Parameter row must be followed by mandatory Name row.

Name Parameter Name

The name is a human readable name for the parameter. There is no requirement of
uniqueness for parameter name. It can also contain spaces.

Next row is a Description.

Description Description text

Description provides a description for parameter. Description text can contain the end
of line symbol (“\n”) that will be translated into a new line. There is another way to
provide multiline descriptions. Description line can be repeated to provide separate
lines of description. These two examples are equivalent:

Description Description text line 1\nline 2\nand line3

and

Description Description text line 1
Description line 2
Description and line3
Next optional row is Annotation. Annotation is a structured description. Annotation
consists of several parts that are text with attached tags. Tags must belong to
classifiers with “Parameter Annotation” type. Text representation in Annotation line
is similar to Description line. Also all Annotation lines with the same tag will be
merged together with new line delimiter.

Annotation Classifier name Tag name Description text

Inherit row is optional. It can be used in any part of parameter context to show that
the parameter extends the definition of an already existing parameter or group of
parameters. The syntax is as follows:

Inherit Parameter code

Parameter code must be code of some existing parameter. Note: The inherited
parameter can already exist in SAIL database or can be defined earlier in the same
file. A parameter can inherit several other parameters so Inherit line can be repeated
for every inherited parameter.

Relation row is to designate relation of current parameter with some other parameter.
Syntax is:

Relation Classifier name Tag name Parameter code

Classifiers must be of type RELATION. This line is optional and can be repeated as
many times as required.

Tag row has the same syntax as in global context but in the context of a parameter it
applies the tag only to the current parameter. This line is optional and can be repeated
for different tags.

Variable row starts a new variable context within the current parameter context.
Variable context spans until next variable context, next qualifier context or end of
current parameter context. Variable line syntax is as follows:

Variable Variable name

Variable line must be followed by mandatory Type line. Type line syntax is:

Type Variable type

Variable type must be one of following: STRING, INTEGER, REAL, BOOLEAN,
ENUM, DATE or a special type of Boolean called TAG. TAG is a special Boolean
that indicates that this variable is going to be displayed when creating a summary of
the contents of a collection.
An optional Description line can set description for variable. Syntax is the same as
for parameter's description.

If type of variable is ENUM then Predefined and Variant lines can be entered in
context of variable.

Variant row provides values for an enumerated variable. Syntax is as follows:

Variant variant string [variant coding]

Variant coding is an integer number that is used if variable has numeric representation
of variants. Variant coding is optional. Variant line should be repeated for every
enumerated value.

Predefined row takes the form of:

Predefined yes or no

Predefined row determines whether this variable can only accept values from a
predefined set or it can include new values that can come along with data.

Qualifier row starts a new context within the parameter context. It terminates a
previous variable or qualifier context if it exists. Qualifier row syntax is as such:

Qualifier qualifier name

A qualifier section is similar to an ENUM variable section with the exception of the
Type row that is not used within qualifier context because qualifier is always
enumerated.

Data availability import file format.

Having a system to describe, create and organize parameters now we can concentrate
on sample availability counts. SAIL has its own database that holds information about
sample availability. Before using the system we need to import-export such
information. SAIL accepts comma or tab separated files that can be easily created by
Excel or any other tool or software. Such CSV or TSV files represent a matrix where
columns are variables or qualifiers of corresponding parameters and each row
contains information about a single sample. Here are the rules on how to prepare an
import file.

    •   The first row is the data header that defines format of this data set. Column
        header format is . e.g. TWINZYG.Type.
        Column with qualifier is described by similar way GLUTM.Timing.
    •   The first column must always be a set of sample IDs.
    •   If a parameter has more than one variable or has qualifiers (own or inherited)
        the file must contain columns for every variable and/or qualifier of this
        parameter.
• Availability information of variables of types STRING and BOOLEAN
(including special TAG booleans) is represented by 0 and 1.
• STRING, REAL or INTEGER variables can also use the real text or numeric
value to show availability.
• Enumerated variables or qualifiers values must be represented by strings. Such
strings must correspond to an enumerated value in the description of this
variable or qualifier.
• If some samples have no values for an ENUM, REAL or INTEGER variable
or qualifier then the corresponding cells can be empty
• If we need to designate that a variable or qualifier has a value but this value
can’t be disclosed then the special symbol @ can be used.
SAMPLEID.ID SEX.Sex AGE.Age GLUTM.Concentration GLUTM.Timing
OX1A-01 Male 1 1 Fasting
OX1A-02 Female 1 0
OX1A-03 0 1 Non-fasting
OX1A-04 @ 1 1 Fasting
1. OX1A-01. Sample has full information
2. OX1A-02. Sample has no information about glucose concentration
3. OX1A-03. Sample has no information about sex and age
4. OX1A-04. Sample has full information but information about sex is not
disclosed
Report Constructor Interface
Now we are ready to get sample availability report. To create a report we need to
prepare request by using the Report Constructor. Report Constructor consists of two
panels. Left panel represents parameters in form of a plain list or projection tree.
Right panel is for a request.1. Code column. It contains parameter codes (short stable identifiers of
parameters)
2. Classifiers combo box. Here is the list of all available classifiers. One can
choose a classifier and then choose correspondent tags in a tag combo box.
There is a special [ NO FILTER ] value that means that no filtering by tags is
required.
3. Name column. Here are names of parameters
4. Tags combo box. If a classifier is chosen in the classifiers combo box one can
choose a tag of the appropriate classifier here. Only parameters with such tag
will be shown. Together with classifiers this combo box is used as a filter of
parameters. Special value [ANY] means that parameters with any tag of
correspondent classifiers will be shown.
5. Description column. Here is part (or entire if it is short) of parameter
description.
6. Search field. One can write a pattern to filter parameters. There is the
possibility to choose which part of parameter (code, name, description) will
participate in filtering.
7. Filter column. By selecting this option you can specify a subset (by value) of
the parameter you want to add to the query. For example in a variable of type
ENUM you can select only to display entries with one particular value or for
variables with an integer value you can select entries within a range of Max
and Min value.
8. Records column. Common count of database records that contain information
described by this parameters is shown here
9. Variables column. This column shows the number of available variables for
corresponding parameter.
10. Enumerations column. This column shows the total number of enumeration
values for this parameter. Enumerations are both qualifiers and variables with
ENUM type.11. Filtered value. When the parameter added to the query has been filtered it
appears in the report request window with an icon of a small yellow funnel.
12. Name column. This column shows names of parameters. If request contains
group of parameters then "Parameter group N" is shown here.
13. Query type. This allows you to define if the parameters in query need to be all
available (AND) or at least one of them available (OR) for an entry to be
counted as positive in the results report.
14. Remove from query button. Select from the list of parameters the one that you
want to remove and click in this button to remove it from the query.
15. Remove all. Click on this option if you want to clean your query and remove
all the selected parameters at once.
16. The quick query button allows you to select one parameter from the Parameter
list and make a simple query for availability.
17. The Add button allows you to add a parameter to the Report request view. An
alternative way to add a parameter would be to double click on its name.
18. Add to group allows you to group parameters into set where at least one of the
parameters needs to be available.
19. Relations button. This button opens a dialog that shows all relations of the
selected parameter. Related parameters can then be added to selection. This
button is disabled if the selected parameter has no relations.
20. Extra button will display a set of options to export or edit parameters.
21. If this check box is checked then result will be split first in relation to
repository.
22. This radio button allows you to choose if either all repositories will participate
in count or only those collections selected from the pop up list once you click
on the Select button.
23. Use relations button allows including into a query those other parameters that
have any type of relation with the parameters selected.
24. The specify relations option allows you to select which type of relations do
you want to take into account when you make a query. The list of available
relations will be displayed when clicking on the Select button.
25. Query button sends the request to the server and opens a new tab with the
results.
Right click in one of the parameters of your query to get the following options in a
small pop-up window.
26. Remove button allows to remove selected object (parameter, enumeration or
group) from request
27. Down button moves selected object to one line lower.
28. Up button moves selected object to one line upper.
29. Filter option. Brings up the filtering pop-up window similar to the one with
button 7.
The simplest request is about the availability of a single parameter. To construct such
a request we need to choose the parameter of interest and add it by Select button.Report is also very simple. It means that we have 33102 samples in database and all of them have information about Sex A more complex example. We are choosing Age and then Alcohol.
And getting such a report .

That means that we have 33102 samples, 33080 of them have information about age
and 13741 have information about alcohol. 13720 have information about age and
alcohol status.
We can make more interesting reports using enumerations. To add enumerations into
a request we need first select the parameter with enumerated variable or qualifier and
then press filter button. Dialog with all available enumerations will appear. Here we
can choose one of the available enumerations and add it to the request.

Report will look like:

Here we can see all values of enumeration and corresponding counts.
By default parameters added to a query are included with the AND option which
means that both parameters have to be available in a sample to be counted as positive.
Another option is to select OR as a linker which mean that at least one of the
parameters have to be present. To do it we need select several parameters in list. Then
click on OR button to the change the type of request.

And report:

This report means that entire database contains 6120 records, 5301 of them have
information about smoking status 5677 about alcohol status and 5699 have smoking
status or alcohol status or both.
How to use SAIL
  1. Open the link: http://www.ebi.ac.uk/Tools/sail/
  2. From the welcome page, on the top left corner you can select the tabs to
     browse a summary of the existing collections or to make a query (Red arrows).
     Alternatively you can also select one of the options in the menu on the botton
     right (Green).

  3. Use the Summary to view the general info about collections.

  4.    You can extend the available information about a collection by selecting the
       inverted triangle at the right side of each collection.
User Interface. How to add parameter into a report You can add particular parameter (for instance, MetS:GLU - glucose from harmonised metabolic syndrome vocabulary) into a report in the following way: 1. Select parameter from the parameter list (left panel of the screen); 2. Press button "Add" at the bottom of the list.
Selected parameters are shown in "Report request" panel.

How to add group of parameters into a report

   1. Select parameters from the parameter list (the left panel of the screen) pressing
      Ctrl button (cmd button on mac) to add parameters into the group one by one.
2. Alternatively you can select all the parameters between two selected ones by
pressing the Shift button while doing your selection.
3. Press button "Add" at the bottom of the list.
The selected group is shown in "Report request" panel.How to add a parameter into a group
Sometime you may want to group parameters in your request so you can do complex
queries where you can choose to report samples where at least one of the parameters
of each group is present.
Let’s say for example that you want to get all samples that have Age, Sex and at least
Date of coronary heart disease diagnosis or Date of first myocardial infarction. You
can group the last two parameters together to achieve this.
1. First select the parameters Age and Sex and add them to your query.
2. Now select one of the parameters you want to add to the group and again add
it to the query.3. To add a parameter to a group select from the report request window (the one on the right) the parameter that will be part of a group. Once selected the Add to group button will become available. 4. Now select the parameter that you want to add and press button “Add to group”.
When adding a parameter to a group notice that it gets added with the contrary linker
(OR) that the one used for the rest of the parameter in the query (AND).

How to add enumerated values of a parameter into a report

In some cases data providers submit real values for a particular parameter (for
instance, Mets:SEX - gender from harmonised metabolic syndrome vocabulary has
following possible values: Man, Woman, @ - means that real values are not
provided). You can create report with enumerated values for selected parameter in the
following way:

   1. Select the parameter from the parameter list by clicking on the funnel icon.
2. In the pop up window select the enumerated values that you want to add to
   your report request. (Enumerated values are those with a value of 1 in the
   enumeration column).

3. Press the OK button and the parameter will be added to the query. Notice that
   the parameter will show a small funnel icon which means that the parameter is
   filtered only for those values selected.
Selected parameters with enumerations are shown in the "Report request" panel.
Notice the super index 1 on top of the SEX header linking to a legend that say that the
parameter has been filtered to show only does entries with Sex values “Man” or
“Woman”.
How to add value ranges for a parameter into a report

In cases where Integer values for a particular parameter are provided (for instance,
Mets:EXYR - year of examination ) you can create a report where you only select
those samples with values within a range.

    1. Select the parameter that you want to add by clicking on the funnel icon (filter
       column).

    2. If the parameter is of type INTEGER and contains real values that can be
       used you will see a range already display showing + and - infinitum.
3. Double click on top of the displayed range. In the new Range pop up add the lower and upper limit values and click ok. 4. Click ok again and your parameter will be added to the request report panel.
5. In the report you will get your parameters with the filtered comment and an
   indication of what was the filtering applied.
How to use split by collection

When querying more than one collection at the same time it may be useful to split the
results by collection so it is easier to choose which data provider contains the data of
interest. To split results by collection we do:

    1. Select the parameters you are interested in and add them to the request report.

    2. In the request report panel click on the check box “Split by collection” at the
       bottom of the panel.
3. Click on query to see your results. 4. Alternatively, if you want to select only a number of collections to check you can do so by selecting the Specify collections check box and then pressing on Select.
5. In the pop-up window select the collections you want to use and click ok.

6. Again click query to check your results.
Use Parameter Relations

In SAIL collections can be annotated using the same or different vocabularies. In
order to facilitate the queries among collections with parameters annotated with
different vocabularies SAIL makes use of relations. Using relations in your queries
can be achieved by different methods.

One method would be adding all the related parameters to your query.

    1. Start by selecting the parameter that you want to add.

    2. By pressing the button Relations in the parameter list panel a new pop-up
       window displays the names of the related parameters and what type of
       relation they have.
3. Select the parameters you want to add and press “Add to Selection”. 4. Click on Add and all the parameters will be added to the Report request with the OR connector.
5. Click on query to get your report.

6. Another way to use relations allows you to select only one parameter and then
   specify in the report request panel to look for relations.
7. Select the parameter you want to add to the report and press “Add”.
8. On the bottom of the report request panel click on “Use Relations”. This will
   enable all types of relations.

9. Click on “Specific Relations” and press on Select.
10. Select Synonym and press OK.

11. Click on Query to get your report.
12. Notice that in this case you will get an R+ super index in some of the results
    indicating that this value contains entries with a related parameter to the main
    one stated as the header of the column.
Export Lists of Parameters
Users can export lists of parameter definitions from the user interface. Parameter lists
can be used as templates to create new vocabularies or/and to understand parameter
structure and how to prepare dataset for data upload into SAIL. The following steps
are needed to export a list of parameters:
1. In order to export all the parameters visible in the parameter list window, first
you click on Extra.
2. In the available list of options select Export visible.3. A new pop-up window appears with the visible parameters and their
definitions.
4. To export a set of selected parameters first click on the parameters you want
to export from the parameter list. You can select a complete set of parameters
by selecting the first parameter in the list and then by keeping the shift button
pressed click on the last parameter of the list. This will select all the
parameters between the ones you selected. If you want to select a subset of
parameters press ctrl + click on the name of the parameters you want to select
(cmd + parameter in Mac).5. Now click on the Extra button. 6. Select Export Selected and a new pop-up window will show the descriptions on the parameters selected.
Parameter Tress and Hierarchies

Parameter trees and hierarchies are used to show how parameters are organized and
how hey relate to each other.

Parameters are organized in trees depending on the values of the TAGs in their
description. They can be organized as belonging to a vocabularies and then to a
specific subgroup of parameters within the vocabulary. For example, you can select to
display all the parameters that belong to vocabulary MetS and from MetS all the
parameters associated with Disease and within the disease subset all the parameters
related to Cancer.

Trees structures are defined through the administrator interface.

Hierarchies allow displaying parameter relations and inheritance. For example a
parameter called Familiar Diabetes will be related to parameters Mother diabetes,
Father diabetes, Sibling diabetes and so on. All this parameters will inherit
characteristics from Familiar diabetes so the descriptions for the generic variables that
describe diabetes have to be introduced only once. (This is useful when creating a
vocabulary to avoid redundancy). It also allows doing queries using the more generic
parameter and getting as a result all the samples that have been annotated using the
more complex version of the parameter.
How to combine parameters

  1. Combine parameters
     There are two possibilities to do it:
     Logical "and"
     Selected parameters which are listed in the "Report request" panel are
     combined with logical operation "and" . The report in SAIL is created by
     gradually adding parameters into request (for instance, parameters are listed in
     the following order Mets:SEX and MetS:GLU, that means that, firstly, samples
     with provided gender will be selected from the database, secondly, samples
     with measured glucose level will be selected among them).
     You can use "Up" and "Down" buttons in the bottom of the "Report request"
     panel to change the order of selected parameters.
     See sections How to add parameter into a report and How to add possible
     values of parameter into a report.
     Logical "or"
     You can select a group of parameters from parameter list in such a case
     parameters in the frame of a group will be combined with logical "or"
     operation (for instance, group of parameters consists of Mets:SEX and
     MetS:GLU, that means that samples with provided gender or measured
     glucose level will be selected from the database).
     See section How to add group of parameters into a report.
  2. Press "Make report" button at the bottom of the "Report request" panel.
  3. Report appears in the next tab - congratulations, you have done it!
Administrator Interface.
The administrator interface of SAIL allows the user to import new data into SAIL as
well as adding new vocabularies and defining new data relations. It also allows to
structure data into groups, trees and/or hierarchies.
After login into the Admin interface, the user is presented with a new set of tabs to
choose from. Two of them are similar to those in the user interface, Report
Constructor and Collection view (Summary view). The new tabs are Classifiers,
Projections, Study, Collection and Metadata Import.
Produce a template for data import.
Report constructor offer similar characteristics as it’s counterpart in the user interface.
One of the new features available from the Administrator interface is the ability to
create templates for data import based on a set of selected parameters. To do so the
following steps are required:
1. Select the list of parameters that you want to use in your template. You can
use Ctrl + click on the name of a Parameter (cmd + click on Mac) in order to
select parameters one by one or you can Shift + click on the first and last
parameters of a list to select all the parameters in between.
2. Click on the button labelled Extra.3. Now select the option Data Template and select the location to store the template file and click OK.
Create new classifiers.

Two new categories can be found under the Classifier tab. Classifier list and
Classifiers tree are used to display what classifiers have been defined in SAIL and
how they have been structured and to which classifier group they belong.

More interesting is the option to be able to create new classifiers or edit existing ones.

   1. To create a new classifier start by selecting the Add button at the bottom of the
      screen.

   2. In the new tab call Add Classifiers you have the following fields. Name, is
      how the classifier is going to be called. Description (optional) holds the
      description of your classifier. Type holds the type of Classifier that you want
      to create. The main type is Parameter and is the one we will use in our
      example. (For a description on the different types of Parameters check section
      Understanding SAIL. Classification).
3. To add Tags to the Classifier select Add Tag. We are going to add three tags, Cold, Warm and Hot Params. Enter the name and description of your parameters and click OK. 4. Once finished creating your Classifier click on Save.
5. To edit an existing classifier, start by selecting the classifier you want to edit.

6. Click on the Edit button.
7. Add a description to the classifier.

8. In the Classification section click on the black inverted triangle to expand the
   options and select Add Tag.
9. Select Classifier type from the list of options and click select.

10. Select the type of tag you want to add (this tag have been defined in a
    classifier of type classifier that holds definitions of classifier types to help with
    grouping classifiers by type).
11. Click on Save to finish edition. The Classifier tree tab allows displaying classifiers grouped by type as well as browse what tags have been defined for a classifier.
Create projections.

Projections are ways to organize data based on the tags used to define parameters.
Projections are used in the User interface in the parameter tree and parameter list
sections to show how a tree should be built or to filter parameters. (To know more
about the use of projection read section Understanding SAIL. Classification).

   1. To create a new projection start by selecting Add.

   2. Name the new created projection.
3. In the classifiers section select Add.

4. Select a classifier from the list in the pop-up window. Repeat for a couple of
   parameters (beware that all the parameters in a projection have to be of the
   same type).
5. Once the parameters have been added they can be reordered by using the UP
   and DOWN buttons.

6. Click on Save when finished creating your projection.
7. In the Parameter Tree view under Report Constructor you can select the newly
   created projection in the drop down menu.
Create a new study
Studies are used to group data from different collections but that share some type of
characteristic that made it suitable to be combined. Study would be a super level that
would be on top of Collection. Data can only belong to one Collection but could
belong to different studies.

   1. To create a new study start by selecting Add.

   2. In the Add study window add the name of the Study you want to create. If you
      want to add any descriptors click on Add.
3. Here you can add the name of your descriptor or select an existing tab by clicking on Change Tag. 4. If you select Change Tag a new pop up window with available classifiers will be displayed. Here you can select the one you want to use and click on Select.
5. In the Collection List section click on the Add button to get a pop-up window
   with the list of available collections. Here you can select the collections that
   are part of the study by clicking in the selection box. Once done click OK.

6. Click Save to finish creating your Study.
7. Now you need to import the sample relations data in the newly created study.
   To do so you need to have a file with the format: SampleID, Eligible, Used
   with values 0 and 1 for eligible and used. No headers are used in the file.

8. Select the study to which you want to add data and click on Import sample
   Relation
9. In the list of collections that belong to the Study click on the one to which you
   want to upload data relations and click on Select.

10. Select the Add button to choose the file with the data relations and click Ok.
11. Select Upload.

12. The amount of Samples, eligible and selected in a study will be displayed in
    the right hand columns in the study windows.
Create a new collection.
The collection tab allows administrators to create or edit collections and add new
availability data to a collection,
1. To create a new collection select Add.
2. In the Add collection tab once you added the name of the new collection click
the Add button on the Structured description section.3. In the classifier list select Repository description as this is the type of classifier that holds the descriptors available for new collections (they have been defined in the Classifier section). Click on Select. 4. Select the Tag that you want to used and click select.
5. Add the value that you want to use for that descriptor. (Notice that at the top
   of the window it specifies the type of descriptor to which you are adding a
   value). Click Ok. Repeat these steps for as many descriptors as you want to
   add.

6. Once you finished creating a new Collection click on Save.
7. To import availability data to a collection start by selecting the collection to
   which you want to add data and click the Import Data button.

8. In the pop-up window click on Add to select the file you want to use to upload
   availability data.
9. Once the file is selected click on Upload. Messages will be displayed in the
   Note section showing the state of the data upload.

10. Once data load is finished, close the File upload dialog window and return to
    the Collection tab.
Metadata Import (relations and vocabulary upload). The metadata import tab is used to upload vocabulary files and files containing information about the relation between parameters. For a review on how these files should be formatted refer to the Appendix section. Upload vocabularies and relations work the same way with the only difference that you select the Upload vocabulary or Upload Relations button depending on what type of data you want to upload. We are going to review how to upload a vocabulary file. 1. Start by clicking the Upload vocabulary button. 2. In the pop-up dialog box select Add.
3. Once you select the file to upload click on Upload.

4. Once the vocabulary has been uploaded successfully close the dialog window.
Application design
SAIL was designed as client-server application. The server part is written according
to Java Servlet specification and is running inside a Tomcat web application
container. The client part is intended to be run inside common web browsers. The
client application is based on the Google Web Toolkit (GWT) technology with Ext-JS
widget library. GWT allows developing client applications using Java programming
language: Java code is translated into Java Script to be executed inside client browser.
The Ext-JS widget library provides rich set of well-developed widgets for building
program-like interface of a web page. Such set of widgets consists of windows,
menus, tool bars, etc. Google Web Toolkit also provides means for seamless client-
server interactions and enable a software engineer to reference server methods from
client Java code.

The server part of SAIL is mostly a kind of database management layer. It controls
the creation and modification of SAIL objects like parameters, classifiers and so on.
Another important part of SAIL’s backend is a module that deals with data and
metadata import. It parses, validates and load data/metadata into a database. The final
component is the sample counting engine that processes queries and makes counts of
availability based on the results of the query. The database itself can roughly be
divided into metadata storage and data availability storage. Metadata storage contains
information about parameters (structure, classification, relations), repositories,
classifiers, projections. Data availability storage contains information about samples
such as identifiers, relations to repositories, relations to parameters and finally
availability information.
SAIL Glossary

Parameter

Parameter serves for the description of one particular characteristic of an object. Such
characteristics can be a simple property of the object like human height, a measured
value like temperature, some binary state like patient have disease or not.
Characteristics can be more complex like blood pressure that requires two values to
be described. Parameters have code, name, description, set of variables (1 or more),
set of qualifiers (0 or more).

Parameter code

Parameter code is short alphanumeric identifier of a parameter. Code must be unique
across entire set of parameters. Code uses only latin characters and is localization
independent.

Variable

Variable is the mandatory part of parameter (can be exceptions of parameters with no
variables). Parameters can have one or several variables. The variable describes the
atomic property of a parameter. In most cases such property is a numeric
representation of some physical value such as concentration, temperature, pressure
and so on. In other cases a variable describes non numeric properties for example free
text descriptions or the enumerated property of an object or the boolean state of an
object. Variables have name, description and type. Type set is fixed and consists of
ENUM, STRING, INTEGER, REAL, BOOLEAN or TAG. ENUM type variables can
have set of allowed values.

Qualifier

Qualifier is an optional part of a parameter. Qualifier is similar to enumerated variable
but in contrast to variable it doesn’t describes the object itself but values of variables.
For example a qualifier can describe when temperature (variable) was measured like
[MORNING, AFTERNOON].

Parameter inheritance

In some cases a parameter doesn't represent a new notion but extended the view of an
     existing parameter. In such cases we can use one parameter as base to produce the
     new one. The new parameter will have all variables and qualifiers of the inherited
     parameter plus its own ones.
Appendix: Vocabulary import Data in SAIL is described by set of parameters. A parameter represents one phenotype entity. Such entities can be represented by single measurable values like Height or Weight, a few values (blood pressure systolic or diastolic) or even more complex set of values for measurements with attached conditions. Every single parameter is represented by a variable. Parameters in SAIL consist usually of one or more variables. There can be cases when a parameter contains no variables at all for example when you want to create the same variable in two different languages, you can create the first parameter with the full description and list of variables and then create a second parameter with the new name in a different language and a Inherited tag pointing to the original parameter and with no extra information. A variable in SAIL can't exist outside of the parameter context. In most cases one parameter contains only one single variable. Example 1: Temperature Parameter MetS:Temp Name Temperature Description Body temperature Variable Value Type REAL Parameter is coding of parameter. Coding must be unique across all SAIL parameter. The best way to ensure uniqueness is to prefix coding by the name of the vocabulary (MetS: in this example) Name is the name of the parameter. It isn't required to be unique. Description is a free text description of parameter Variable designates the new variable within the parameter. The name of variable must be unique within a parameter. Type can be one of the following: REAL, INTEGER, STRING, BOOLEAN, DATE, ENUM or TAG. In some cases parameter can have two or more variables. Parameter MetS:BP Name Blood pressure Description Blood pressure measured according to standard technique
Variable      Systolic
Description   Systolic part of blood pressure
Type          INTEGER
Variable      Diastolic
Description   Diastolic part of blood pressure
Type          INTEGER

ENUM variables must be described in special way. It must be declared whether it has
predefined variants or not. Variant values can also have a numeric value that is a
reference to the real value.

Parameter     MetS:SEX
Name          Sex
Description   Gender of a patient
Variable      Sex
Type          ENUM
Predefined    YES
Variant       Man                 1
Variant       Woman               2

A list of variants can be left "open".

Parameter     MetS:RESD
Name          Country
Description   Country of residence
Variable      Country
Type          ENUM
Predefined    NO
You can also read


