Schroder AsiaPacific Fund plc - Matthew Dobbs, Fund Manager February 2021 - Marketing material
←
→
Page content transcription
If your browser does not render page correctly, please read the page content below
Marketing material

Schroder AsiaPacific Fund plc
Matthew Dobbs, Fund Manager
February 2021
Schroders in Asia
Strength of resources both in Asia and London
Schroders Asian team exceptionally well resourced                                                          Schroders office
                                                                                                           Tokyo
                                                                          Years of      Years with         Opened 1974
Fund Manager            Location      Focus
                                                                         Experience     Schroders          Seoul
                                                                                                           Opened 1987
                                                                                                           Beijing
Matthew DOBBS*          London        Asian Equity Specialist                 39             39            Opened 1996
                                                                                                           Mumbai2
Richard SENNITT         London        Asian Equity Specialist                 27             27            Opened 2012
                                                                                                           Taipei
                                                                                                           Opened 1989
Abbas BARKHORDAR London               Asian Equity Specialist                 13             13            Shanghai
                                                                                                           Opened 1994

                                                                                                           Hong Kong
Robin PARBROOK          London        Alternatives, Value & Regional          30             30            Opened 1971
                                                                                                           Singapore
                                                                                                           Opened 1977
                                                                                                           Jakarta
–   131 ex Japan Fund Managers and Specialists based across the region                                     Opened 1991

–   341 ex Japan analysts based in six offices across the region
                                                                                                           Sydney
–   ESG team – 201 strong London based sustainable investment team                                         Opened 1963
                                                                                                           Melbourne
                                                                                                           Opened 2007
–   Data Insights Unit – >251 London based data scientists monitoring
    investment themes screening for ideas                                                                       Investment office
                                                                                                                Representative office
–   London based Emerging Market and Global teams                                                          2A   joint venture fund management company with Axis Asset Management Company

Source: Schroders. Years experience as at 31 December 2020. *Matthew Dobbs will transition his responsibilities by March 31, 2021 and then will remain at the firm as an advisor until the end of 2021
1December 2020. The 34 ex Japan analysts includes Schroders’ local specialist team of 9 equity analysts in Sydney, as well as a joint-venture team of 7 Indian equity analysts at Axis Asset Management (Axis AMC)

in Mumbai. The Axis AMC team is fully integrated and provides support and coverage for Indian stocks within our research universe.
2
Experienced and Well Resourced Team
                                        Richard Sennitt
                                        Provides a continuity of approach as well as extensive experience
                                        Provide a continuity of approach
                                        –   Richard has been at Schroders for over 27 years looking at Far Eastern markets throughout that time
                                        –   Worked closely with Matthew Dobbs since 2007 helping to grow and build the Asian and small cap franchise in London.
                                        –   Acts as alternate on Asian Alpha Plus Fund, Schroder AsiaPacific Fund and Schroder Oriental Income Fund which has seen him actively involved
                                            in influencing and shaping those portfolios.
                                        Experienced Asian Fund Manager with strong track record in UK Market
                                        –   Managed the Schroder Asian Income fund since inception in 2006 growing it into a £1.3bn fund that has generated strong long term
                                            performance. In addition to that he co-manages, along with the structured products team, the two Schroder Asian Income Maximiser funds
                                            with assets of around £450mn.
                                        –   Extensive client and marketing meetings undertaken for his funds means that Richard is well known amongst holders and potential holders of
                                            the funds given the substantial overlap of client base across these funds.

                                        Abbas Barkhordar
                                        Additional fund management resource
                                        –   Joined Schroders in 2007 on the graduate scheme as an analyst on the Emerging Market Equities team.
                                        –   Strategy Analyst for the Global Emerging Markets funds from 2007-2014. This involved specifying and back-testing quantitative models to guide
                                            the funds’ asset allocation, as well as producing written research into economic, sector, industry and thematic trends.
                                        –   Senior Analyst for the Frontier Markets fund since its launch in 2010. Regional coverage included all of Frontier Asia.
                                        –   In addition to equity analysis, the role involved strategy, risk management and significant input into portfolio construction.
                                        –   Master’s Degree in Physics (MPhys) from Oxford University. CFA Charterholder since 2011.

Source: Schroders. December 31, 2020.
Asia Pacific ex Japan Equities Research
Our research team
                                                            Years of          Years with                                                                                  Years
Analyst               Location    Coverage                                                                                                                  Years of
                                                           Experience         Schroders    Analyst                     Location    Coverage                               with
                                                                                                                                                           Experience
                                                                                                                                                                        Schroders
                                Head of Research,
Adam OSBORN1          Hong Kong                                30                18                                                Regional Energy and
                                Asia ex Japan Equities                                     Sameer KAKAKHEL, CFA        Singapore                              26           9
             1
                                                                                                                                   Materials
Jay LUONG             Hong Kong Regional Financials            21                13        Jeonghoon (Matthew) YANG,
                                                                                                                       Hong Kong   Korean Equity              13           7
Sherry LIN            Hong Kong Regional Financials            27                11        CFA
Alice LIU             Hong Kong China Equity                   11                 2                                                Indonesian, Malaysia,
                                                                                                                                   Philippines, Thailand
Maggie LI, CFA        Hong Kong China Equity                    7                 7        Siew Ling TAN, CFA          Singapore                              12           7
                                                                                                                                   and Vietnam
Wei LI, CFA           Hong Kong China Equity                   10                 3                                                Domestics
Jose PUN, CFA         Hong Kong China Equity                   10                 2        Chuanyao LU, CFA            Singapore   Singapore Domestic         13           3
                                Head of China A-                                           Gina KIM, CFA               Singapore   Asian Small Caps           21           8
Sarah LIU             Shanghai                                 15                 7        Martin CONLON3              Sydney      Australian Equity          32           27
                                Share Research
Candice CHEN          Shanghai  China Equity                    7                 3        Andrew FLEMING4             Sydney      Australian Equity          32           13
                                                                                           Joseph KOH, CFA             Sydney      Australian Equity          24           11
Kelly ZHANG, CFA      Shanghai    China Equity                  9                 5
                                                                                           Justin HALLIWELL5           Sydney      Australian Equity          24           24
Jingyi SONG           Shanghai    China Equity                  4                 2        Ray DAVID                   Sydney      Australian Equity          19           8
Abigail SUN           Shanghai    China Equity                  6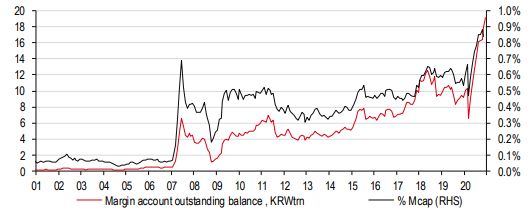
Performance
Schroder AsiaPacific Fund plc
NAV performance
Benchmark:                          MSCI AC Asia ex Japan Index1 (net dividends reinvested)
Current value:                      £1,089,384,252
Inception date:                     20 November 1995

Returns to 31 December 2020 (£)
                                                                                                                                                                                                     Since
                                                                                         3 months                 1 year              3 years              5 years            10 years
                                                                                                                                                                                                 inception
                                                                                               %                      %                % p.a.               % p.a.              % p.a.
                                                                                                                                                                                                    % p.a.
Schroder AsiaPacific Fund plc2                                                                14.8%                29.8%                  9.6%               18.4%                11.6%                 9.0%

MSCI AC Asia ex Japan (NDR)                                                                   12.2%                21.2%                  7.8%               15.4%                 8.3%                 6.2%

Relative performance                                                                            2.6%                8.6%                 1.8%                 3.0%                 3.3%                 2.8%

Past performance is not a guide to future performance. The value of investment can go down as well as up and is not guaranteed. The value of investments and the
income from them may go down as well as up and investors may not get back the amounts originally invested. Exchange rate changes may cause the value of
investments to fall as well as rise.
Source: Morningstar, Schroders. Source for ratings: Morningstar and Financial Express, as at 31 December 2020. Please see Morningstar disclaimer at the end of the presentation. 1Prior to 28 February 2011
Benchmark was MSCI AC Far East ex Japan. 2Cum-income fair NAV Total Return (since inception Total Return NAV), net of fees, GBP.

6
Schroder AsiaPacific Fund plc
NAV performance
Calendar year returns (£)
Q4 2019 – Q4 2020 Q4 2018 – Q4 2019 Q4 2017 – Q4 2018 Q4 2016 – Q4 2017 Q4 2015 – Q4 2016
% % % % %
Schroder AsiaPacific Fund plc2 29.8% 15.0% -11.7% 38.7% 27.6%
MSCI AC Asia ex Japan1 21.2% 13.6% -9.1% 29.5% 25.8%
Relative performance 8.6% 1.4% -2.6% 9.2% 1.8%
Past performance is not a guide to future performance. The value of investment can go down as well as up and is not guaranteed. The value of
investments and the income from them may go down as well as up and investors may not get back the amounts originally invested. Exchange rate
changes may cause the value of investments to fall as well as rise.
Source: Morningstar, Schroders. 1Prior to 31 January 2011 Benchmark was MSCI AC Far East ex Japan. 2Cum-income fair NAV Total Return, net of fees, GBP.
7Schroder AsiaPacific Fund plc
Performance – Since inception1 to December 31, 2020
Index 100 = 20 November 1995
1200
1100
1000
900
800
700
600
500
400
300
200
100
0
1995 1996 1997 1998 1999 2000 2001 2002 2003 2004 2005 2006 2007 2008 2009 2010 2011 2012 2013 2014 2015 2016 2017 2018 2019 2020
2
Schroder AsiaPacific Fund plc MSCI AC Asia ex Japan (NDR) 3 S&P 500 FTSE 100 MSCI Eur x UK Topix
Past performance is not a guide to future performance. The value of investment can go down as well as up and is not guaranteed. The value of investments
and the income from them may go down as well as up and investors may not get back the amounts originally invested. Exchange rate changes may cause
the value of investments to fall as well as rise.
1 20 November 1995
2 Total Return NAV, net of fees, GBP.
3 Prior to 31/01/2011 Benchmark was MSCI AC Far East ex Japan
Source: Morningstar, Schroders
8Schroder AsiaPacific Fund plc
Risk considerations
– Past performance is not a guide to future performance and may not be repeated. The value of investments and the income from them may go down as well as up and
investors may not get back the amount originally invested.
– Investors in the emerging markets and the Far East should be aware that this involves a high degree of risk and should be seen as long term in nature. Less developed
markets are generally less well regulated than the UK, they may be less liquid and may have less reliable arrangements for trading and settlement of the underlying
holdings.
– The trust holds investments denominated in currencies other than sterling, investors should note that exchange rates may cause the value of these investments, and
the income from them, to rise or fall.
– The trust invests in smaller companies that may be less liquid than in larger companies and price swings may therefore be greater than investment trusts that invest in
larger companies.
– The trust may borrow money to invest in further investments, this is known as gearing. Gearing will increase returns if the value of the investments purchased increase
in value by more than the cost of borrowing, or reduce returns if they fail to do so.
– Investments such as warrants, participation certificates, guaranteed bonds, etc will expose the fund to the risk of the issuer of these instruments defaulting on paying
the capital back to the fund.
– Gearing will increase returns if the value of the investments purchased increase in value by more than the cost of borrowing, or reduce returns if they fail to do so.
Investments such as warrants, participation certificates, guaranteed bonds, etc will expose the fund to the risk of the issuer of these instruments defaulting on paying
the capital back to the fund.
Source: Schroders.
9Outlook
Asian Outlook
On the face of it, Asia has done a good job dealing with COVID-19
COVID-19 total cases and total deaths1                                                                   COVID-19 new cases2
                                                                                                                        5 day moving average
                                                                                                          260,000
                                        Total Cases                               Total Deaths
                                                                                                          240,000
                     Total Cases          per 1m            Total Deaths             per 1m
                                        population                                 population             220,000
                                                                                                          200,000
USA                       23,631,450              71,169              394,296                  1187
                                                                                                          180,000
India                     10,518,712                7,582             151,871                   109       160,000
UK                          3,211,576             47,175                84,767                 1245       140,000
                                                                                                          120,000
Indonesia                     869,600               3,161               25,246                    92
                                                                                                          100,000
Philippines                   494,605               4,482                9,739                    88       80,000
China                          87,844                  61                4,635                     3       60,000
S. Korea                                                                                                   40,000
                               70,728               1379                  1195                    23
                                                                                                           20,000
Singapore                      59,029             10,047                    29                     5
                                                                                                                  0

                                                                                                                                                                                                        Sep 20
                                                                                                                      Dec 19

                                                                                                                                                                                                                                   Dec 20
                                                                                                                                                          Apr 20

                                                                                                                                                                                      Jul 20
                                                                                                                                        Feb 20

                                                                                                                                                                   May 20

                                                                                                                                                                            Jun 20
                                                                                                                                                 Mar 20
                                                                                                                               Jan 20

                                                                                                                                                                                                                 Oct 20
                                                                                                                                                                                               Aug 20

                                                                                                                                                                                                                          Nov 20
Australia                      28,658               1,117                  909                    35

Hong Kong                       9,415               1250                   161                    21

Taiwan                            842                  35                     7                  0.3
                                                                                                                      USA                           UK                               China                       Australia
                                                                                                                      India                         Singapore                        Hong Kong                   Taiwan
                                                                                                                      Philippines                   Indonesia                        South Korea
Source: : 1Worldometers, January 13, 2021. 2Thomson Reuters Datastream, January 13, 2021.
Countries and regions shown are for illustrative purposes only and should not be viewed as a recommendation to buy or sell.

11
Asian Outlook
COVID-19 – Beneficial demographic profile for some countries in the region
% of population over 65
35
30
25
20
15
10
5
0
UK HK Korea Taiwan Australia Thailand China Singapore Indonesia Malaysia India Philippines
% of population >65
Source: U.S. Census Bureau | International Programs | International Data Base. June 2020.
Countries and regions shown are for illustrative purposes only and should not be viewed as a recommendation to buy or sell.
12Asian Outlook update
‘‘Work from home’, Cloud, 5G, Batteries driving tech demand positive
for Korea & Taiwan
Strong growth in cloud services driving IDC investments A new tech cycle underway?
600 563 559 – Work from Home is driving a resurgence in demand for PC
500 notebooks, smartphones, Wi-Fi devices etc.
400
– Ongoing investments into 5G, Data centres, Cloud services,
300 222 automobile digitisation, IOT, etc
200 162
103 – Higher demand for data and broadband connectivity
100 45
0
– ‘Stay at Home’ also driving replacement upgrade of home
2015 2019 2024E appliances, TVs etc. DIY also seeing strong growth trend
China (RMB bn) US (US$ bn) – Ongoing demand for stronger and longer lasting batteries
Source: Frost & Sullivan, Company filings, CICC research, June 2020
Price / Earnings (X) Price / Book Value (X) Yield (%) Return on Equity (%)
21E 22E 21E 21E 21E
TSMC 29.0 25.0 7.7 1.9 26.5
ASE 15.3 13.6 1.9 3.4 12.6
Novatek 17.4 16.6 5.7 4.5 32.5
SK Hynix 13.0 7.7 1.6 1.1 12.5
Samsung Electronics 15.9 12.2 1.4 2.0 12.2
Hon Hai Precision 12.1 10.7 1.1 4.1 9.3
For illustrative purposes only and should not be viewed as a recommendation to buy or sell.
Source: FactSet (market consensus), as at 20 January 2021. The forecast should be regarded as illustrative of trends. Actual figures will differ from forecasts. Please refer to the important information slide at the
end of this presentation. The stocks shown above are for illustrative purposes only and are not to be considered a recommendation to buy or sell.
13Asian Outlook
Valuations in aggregate not too far from long term averages
Price to book (x) Historic price/earnings (x)
3.0 30
2.7
25
2.4
20
2.1
1.8
15
1.5
10
1.2
0.9 5
2011
1991
1993
1995
1997
1999
2001
2003
2005
2007
2009
2013
2015
2017
2019
1995
2001
1991
1993
1997
1999
2003
2005
2007
2009
2011
2013
2015
2017
2019
Asia Pacific ex Japan price to book ratio Asia Pacific ex Japan price / earnings ratio
Average Average
Average - 10 years December 31, 2020 Average - 10 years December 31, 2020
Source: Citi Investment Research, as at 31 December 2020
14Asian Outlook
Earnings expectations picking up and are being revised up
Earnings expectations picking up1 Earnings revisions turned positive2
Consensus EPS* growth for Pacific ex Japan
30% 2.5
25%
20% 2.0
15%
1.5
10%
5%
1.0
0%
-5%
0.5
-10%
-15% 0.0
2017 2018 2019 2020
2019
1999
2001
2003
2005
2007
2009
2011
2013
2015
2017
2022/2021 2021/2020 2020/2019 2019/2018 2018/2017
MSCI AC Asia Pacific ex Japan Ratio - Ups/Down
3 Month Moving Average
Past performance is not a guide to future performance. The value of investment can go down as well as up and is not guaranteed.
Source: FactSet Estimates, MSCI, as at December 31, 2020. *Earnings Per Share (EPS). 2Schroders, Factset, MSCI, December 31, 2020.
15Asian Outlook
Some of the growth sectors are becoming very stretched
Valuation summary for global OEMs (Original Equipment Asia ex Japan avg retail turnover as % of market cap2
Manufacturer)1
Enterprise Value /
Performance YTD Enterprise Value
unit production
% / Revenue 2021
(USD 000) 2021
Toyota 16 1.4 51
VW -6 0.3 9
Daimler 16 0,3 24
GM 26 0.5 10
BMW 3 1.1 44
SAIC 10 0.3 11
Ford -1 0,2 6
Hyundai 49 0.9 22 Korea margin balance and balance as % mkt cap2
Geely 53 1.6 19
KIA 33 0.3 6
Great Wall 192 0.9 14
Average 36 0.7 20
Tesla 586 12.0 700
NIO 1236 16.0 795
XPEV 203 23.2 794
Li Auto 147 13.2 488
Average 543 16.1 694
Past performance is not a guide to future performance. The value of investment can go down as well as up and is not guaranteed.
Source: 1Bloomberg, company guidance, brokers’ report, December 2020. 2UBS, July 2020, HSBC, January 2021
The forecast should be regarded as illustrative of trends. Actual figures will differ from forecasts. Please refer to the important information slide at the end of this presentation. The stocks shown above are for
illustrative purposes only and are not to be considered a recommendation to buy or sell.
16Asian Outlook
Versus historical ranges “Value” looks ‘cheap’ - “Momentum and growth” ‘stretched’
MSCI Asia ex-Japan: Forward Price / Earnings (PE) ratio peak-to-trough
12M fwd PE (x)
– Banks and property look cheap at
60
bottom of range
Peak
– Pharma, Consumer Services, 50
Retail, HPC and software at the top Avg since 04
of range 40
Current
Trough
30
20
10
0 Cap gds
Energy
Materials
Cons dur
Div fin
Software
H'care
Pharma
Banks
Property
Autos
HPC
Insurance
Transport
Retail
Tech HW
Telecom
FBT
Semis
Fd & drug
Media
Utilities
Cons svcs
Comml svc
Notes: PE data are bottom-up aggregated using rolling MSCI AxJ universe. Data as of 30 September 2020. Historical sector valuations are adjusted for GICS sector classification changes.
Source: Datastream, Factset, CLSA, October 2020.
The sectors shown are for illustrative purposes only and should not be viewed as a recommendation to buy or sell
17Asian Outlook
Memories of the Asian Crisis have kept external debt low
Asia external debt – all look safe except for Malaysia1 Asian balance sheets relatively conservative2
Net debt to equity % (ex financials)
90
Short-term Forex reserves/
External debt
external debt short-term
as % of GDP* 80
as % of GDP* debt
70
China 9.5 7.2 3.4x
India 19.6 3.8 3.7x 60
Indonesia 35.2 4.2 2.5x 50
Korea 28.5 8.3 2.9x
40
Malaysia 60.6 26.1 1.0x
30
Philippines 22.7 4.4 4.8x
20
Taiwan 31.4 29.9 2.6x
2004A
2005A
2006A
2007A
2008A
2009A
2010A
2011A
2012A
2013A
2014A
2015A
2016A
2017A
2018A
2019A
2020F
Thailand 30.2 10.7 3.6x
USA AC Europe Japan AC Pacific ex-JP
Source: 1Haver Analytics, Asianomics, January 2020. Data for Q3 2019. 2Bottom-up aggregated with free float adjustment based on current MSCI universe. Source: Jefferies, FactSet, January 2021.
Countries and regions shown are for illustrative purposes only and should not be viewed as a recommendation to buy or sell. *Gross Domestic Product (GDP)
18Asian Outlook
Virus accelerates the move away from globalisation
Globalisation has peaked1 Regional Comprehensive Economic Partnership2
70%
World Exports & Imports as a share of world GDP (%)
60% Globalization ?
50%
Klasing and Milionis (2014)
Penn World Tables (9.1)
40%
Upper bound
30% Lower bound
20%
De-globalization
10%
Estavadeordal, Frantz and
Taylor, 2003
0%
1500 1550 1600 1650 1700 1750 1800 1850 1900 1950 2000
Source: 1BofA Global Research, Klasing and Milionis (2014), Estevadeordal, Frantz and Taylor (2003), Penn World Tables. January 2020. 2Wikimedia.
19Asian Outlook
De-globalisation – Should I stay or should I go?
Labour costs cheaper outside China…1 …but productivity higher in China…2 …cost of automation falling3
Wages for manufacturing workers relative to China (%)
0 140
China
-10 130
Mexico
-20
120
Indonesia
-30
110
-40 Philippines Forecast
100
-50
Vietnam
90
-60
Cambodia
-70 80
0 1,000 2,000 3,000 4,000
Vietnam
Dec-95
Dec-98
Dec-01
Dec-04
Dec-07
Dec-10
Dec-13
Dec-16
Dec-19
Dec-22
Dec-25
Dec-28
Indonesia
India
Philippines
Malaysia
Thailand
Manufacturing Value Added / Working Age
2012 2017 Population (USD) Industrial robot price index
Source: 1HSBC, April 2019. 2United Nations Population Database, World Bank, June 2020. 3BoJ, BofA Global Research, BCG. Price indexed to 100 in 2011. The forecast should be regarded as illustrative of trends.
Actual figures will differ from forecasts. Please refer to the important information slide at the end of this presentation
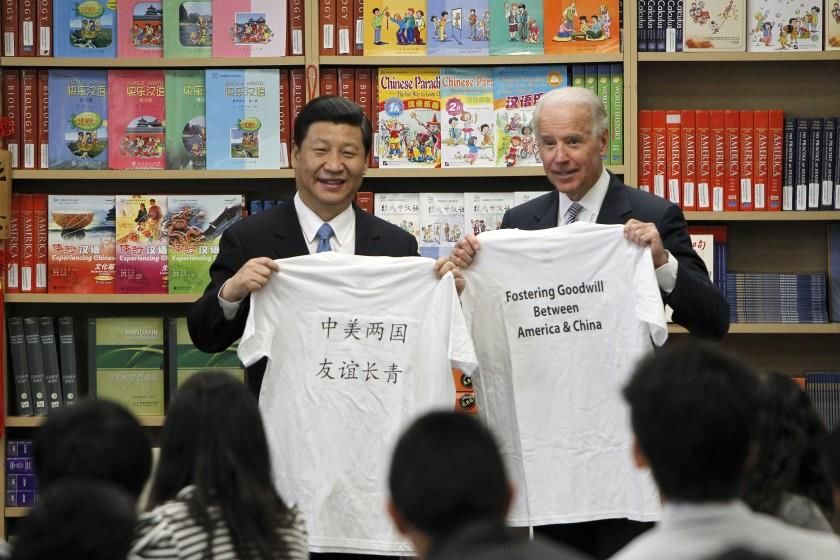
20Asian Outlook “De-globalisation” – All change at The White House? Source www.latimes.com, Joe Biden with China’s Xi Jinping, then his vice presidential counterpart, at the International Studies Learning Center in South Gate in February 2012.(Associated Press)) 21
Asian Outlook
Broad US approach unlikely to change despite a new administration
Harder policy stance towards China popular on both                                                  China way behind on Phase One committments2
sides of the aisle2
       % of people who have a negative opinion of China
 90                                                                                                   35
 80
                                                                                                      30
 70
                                                                                                      25
 60

 50                                                                                                   20

 40                                                                                                   15
 30
                                                                                                      10
 20
                                                                                                        5
 10

     0                                                                                                  0
      2005     2007       2009       2011        2013       2015       2017       2019                      Jan-20              Apr-20             Jul-20       Oct-20

                 Republican Supporters                  Democrat Supporters
                                                                                                               Agricultural Purchases (US$bn)               Agriculture Target

Source: 1Pew Research Center, Schroders Economics Group. 29 September 2020. 2US Census Bureau, PIIE, Schroders Economics Group. 28 October 2020.

22
Asian Outlook
Is there a future for Hong Kong?
72% of offshore RMB payments took place in Hong Alibaba trading volumes2
Kong1 Million
80
Millions
70
60
50
40
30
20
10
0
Mar 19
Mar 20
Aug 19
Jun 19
Jul 19
Sep 19
May 19
Oct 19
May 20
Dec 18
Nov 19
Dec 19
Feb 19
Feb 20
Apr 19
Apr 20
Jan 19
Jan 20
Alibaba - US Alibaba - Hong Kong
Source: 1SWIFT, Morgan Stanley Research, note: RMB payments includes both customer initiated and institutional payments outside of mainland China, May 2020. 2Factset, June 2020. The countries, regions
and stocks shown above are for illustrative purposes only and are not to be considered a recommendation to buy or sell.
23Asian Outlook
The future for Hong Kong as the mainland sees it – perhaps not so bad?
Greater Bay Area – New economic powerhouse
Guangdong-
Hong Kong- Tokyo Bay New York
Indicator Secondary Indicator
Macao Greater Area Bay Area
Bay Area
Area Administrative area (Sq KM) 56,031 36,895 21,478
Permanent residents 71,120,000 44.070,000 20,320,000
Population
% change last 5 years +10% +1% +2%
GDP (US$ hundred million
16,415 19,909 17,177
dollars)
GDP per capita 23,080 45,176 84,529
Economy and
Industry Number of world’s top 500
20 38 19
companies
Number of world’s top 100
5 2 4
universities (QS ranking)
Port throughput (ten
Transport 7,650 807 671
thousand TEUs)
Source: Left Chart: Visual Capitalist, August 2018. Right Chart: Logan, Wind, Bureau of Economics Analysis, Website of Cabinet Office, Government of Japan/Strategic Development Research Office. Comparison
data is for 2018. Countries and regions shown are for illustrative purposes only and should not be viewed as a recommendation to buy or sell.
24Asian Outlook
Why ASEAN is stuck in a middle income trap
Ease of Starting Business rank – remains very tough to Adult Education Attainment (25 years & above) - 20182
start new business in ASEAN countries but easier in
China1 100%
180 14 17
10
17
90% 21 20 20 20
160
80% 45 40
140 70% 27
41
27
120 60% 41 43 39
59
100 53
50%
80 40%
45
60 30% 51 62
49 53
40 20% 39 40 41
26 28
20 10%
14
0% 4
0
Korea
SA
Phil
Indonesia
Brazil
India
US
Turkey
Thailand
Malaysia
India
Poland
Russia
Malaysia
Brazil
Turkey
Thailand
South Africa
Chile
Taiwan
Philippines
China
Indonesia
Korea
No Schooling or Primary Secondary Post Secondary/Teriary
2014 2020
1Source: Source: World Bank, Macquarie Research, January 2020
2Source: ILO, Macquarie Research, September 2019
25Asian Outlook
India slowing very sharply
India growth proxy today1 India capital goods imports and real gross fixed
capital formation (GFCF)2
Source: 1CEIC, June 2020. 2DSGAsia, January 2020.
26Asian Outlook Good Citizenship is Good Business Schroders Context Framework Source: Schroders. December 31 2020. 27
Asian Outlook
Two decades of dynamic change
Top 15 names – MSCI AC Asia ex Japan – December 31, 2000                                                  Top 15 names – MSCI AC Asia ex Japan – December 31, 2020
Stock                                      Country          Sector                      Weight (%)        Stock                                      Country     Sector                   Weight (%)
Hutchison Whampoa                          Hong Kong       Financials                        7.2          Taiwan Semiconductor Manufacturing         Taiwan      Information Technology      6.7

China Mobile                               China           Communication Services            5.5          Alibaba Group                              China       Consumer Discretionary      6.3

Hang Seng Bank                             Hong Kong       Financials                        3.5          Tencent Holdings.                          China       Communication Services      6.0

Sun Hung Kai Properties                    Hong Kong       Financials                        3.3          Samsung Electronics                        Korea       Information Technology      5.1

Taiwan Semiconductor Manufacturing Taiwan                  Information Technology            3.1          AIA Group                                  Hong Kong   Financials                  2.1

Samsung Electronics                        Korea           Information Technology            3.0          Meituan                                    China       Consumer Discretionary      2.0

SK Telecom                                 Korea           Communication Services            2.4          Reliance Industries d                      India       Energy                      1.1

DBS Group                                  Singapore       Financials                        2.0          JD.com                                     China       Consumer Discretionary      1.1

United Microelectronics                    Taiwan          Information Technology            1.8          China Construction Bank                    China       Financials                  1.0

Singapore Airlines                         Singapore       Industrials                       1.7          Ping An Insurance                          China       Financials                  1.0

Korea Electric Power                       Korea           Utilities                         1.6          Pinduoduo                                  China       Consumer Discretionary      1.0

Swire Pacific                              Hong Kong       Financials                        1.5          Hong Kong Exchanges & Clearing             Hong Kong   Financials                  0.9

CLP Holdings                               Hong Kong       Utilities                         1.4          NIO Inc.                                   China       Consumer Discretionary      0.9

Hindustan Unilever                         India           Consumer Staples                  1.3          Xiaomi Corp.                               China       Information Technology      0.9

Singapore Telecommunications               Singapore       Communication Services            1.3          Housing Development Finance                India       Financials                  0.9

Source: MSCI, FactSet. December 31 2020.
The sectors, securities, regions and countries shown above are for illustrative purposes only and are not to be considered a recommendation to buy or sell
28
Positioning
Schroder AsiaPacific Fund plc
Active country positions as at 31 December 2020
Overweight/underweight positions
% of portfolio                               Underweight                                                                                                                                  Overweight
     16.5                         Hong Kong                                                                                                                                         9.1
     5.3                           Singapore                                                                                                                    2.9
     2.1                             Australia                                                                                                             2.1
     1.7                         Netherlands                                                                                                              1.7
     1.7                             Vietnam                                                                                                              1.7
     1.6                    United Kingdom                                                                                                               1.6
     11.6                                India                                                                                                       1.2
     16.3                               Korea                                                                                                        1.1
     1.0                            Germany                                                                                                          1.0
     0.8                                Japan                                                                                                       0.8
     1.9                           Indonesia                                                                                                       0.4
     0.0                             Pakistan                                                                                                0.0
     0.1                          Philippines                                                                                          -0.7
     13.5                              Taiwan                                                                                         -0.9
     0.9                             Thailand                                                                                        -1.2
     0.0                             Malaysia                                                                                      -1.7
     23.9                               China               -20.2
     1.2                               [Cash]                                                                                                        1.2

Source: Schroders. Fund position less benchmark weight. Based on unaudited data. Country examples are for illustrative purposes only and are not a recommendation to buy or sell.

30
Schroder AsiaPacific Fund plc
Active sector positions as at 31 December 2020
Overweight/underweight positions
% of portfolio Overweight
Underweight
30.7 Information Technology 7.6
20.9 Financials 3.0
21.1 Consumer Discretionary 2.0
4.0 Real Estate 0.1
11.6 Communication Services 0.0
4.5 Industrials -0.7
2.0 Energy -0.8
2.2 Materials -2.1
0.0 Utilities -2.2
1.7 Health Care -3.4
0.2 Consumer Staples -4.8
1.2 [Cash] 1.2
Source: Schroders. Fund position less benchmark weight. Based on unaudited data. Sector examples are for illustrative purposes only and are not a recommendation to buy or sell.
31Top 10 holdings by absolute weight Schroder AsiaPacific Fund As at 31 December 2020 Stock Country Sector Portfolio weight (%) Benchmark1 weight (%) Active weight (%) Samsung Electronics Korea Information Technology 10.8 5.9 +4.9 TSMC Taiwan Information Technology 8.8 6.7 +2.1 Tencent China Communication Services 7.0 6.0 +1.1 Alibaba Group China Consumer Discretionary 5.8 6.3 -0.5 Midea China Consumer Discretionary 4.0 0.0 +4.1 AIA Group Hong Kong Financials 3.4 2.1 +1.3 HDFC Bank India Financials 3.2 0.0 +3.2 Galaxy Entertainme Hong Kong Consumer Discretionary 2.7 0.2 +2.5 Samsung SDI Korea Information Technology 2.4 0.5 +2.0 Sea Ltd - Adr Singapore Communication Services 2.3 0.0 +2.3 Total 50.4 27.7 Source: Schroders, FactSet. 1MSCI AC Far East ex Jap to 31/01/2011 then AC Asia ex Jap. The accounting data used by FactSet is un-audited, therefore any subsequent cleaning of data will not be reflected in FactSet. The sectors, securities, regions and countries shown above are for illustrative purposes only and are not to be considered a recommendation to buy or sell 32
What do we like in the region: key investment themes
Tech leadership & innovation, Chinese consumption & service sector, Indian finance

                  World Class Exporters                                                                                                        Chinese Consumption &
                        Techtronics                                                                                                                    Services
                     Johnson Electric                                      Value & Quality                                                              Midea
                  Shenzhou International                                                                                                               Ping An
                       Samsung SDI                                         – Swire Properties,
                                                                                                                                                         AIA
                         Mediatek                                          – Hang Lung Group/Props                                               Galaxy International
                                                                           – BHP                                                                     Sands China
                                                                                                                                                    HK Exchange
                                                                           – Kerry Properties

     The ‘New’ Economy                     Tech Leadership
                                                                                                                                       Indian Domestic       Developed market
           Alibaba                             Samsung
                                                                                                                                           Demand                 banks
           Tencent                               TSMC
                                                                                                                                          HDFC Bank                OCBC
             SEA                            Delta Electronic
                                                                                                                                          ICICI Bank               UOB
           Reliance                          ASM Pacific
                                                                                                                                        Apollo Hospitals         BOC(HK)
                                               SK Hynix
                                                                                                                                         Maruti Suzuki

Source: Schroders The stocks shown above are for illustrative purposes only and are not to be considered a recommendation to buy or sell.
33
Important information Marketing material. Past performance is not a guide to future performance and may not be repeated. The value of investments and the income from them may go down as well as up and investors may not get back the amount originally invested. Exchange rate changes may cause the value of any investments to rise or fall. Schroders has expressed its own views and opinions in this document and these may change. This information is not an offer, solicitation or recommendation to buy or sell any financial instrument or to adopt any investment strategy. Nothing in this material should be construed as advice or a recommendation to buy or sell. Information herein is believed to be reliable but we do not warrant its completeness or accuracy. We recommend you seek financial advice from an Independent Adviser before making an investment decision. If you don't already have an Adviser, you can find one at www.unbiased.co.uk or www.vouchedfor.co.uk Before investing in an Investment Trust, refer to the prospectus, the latest Key Information Document (KID) and Key Features Document (KFD) at www.schroders.co.uk/investor or on request. Any data has been sourced by us and is provided without any warranties of any kind. It should be independently verified before further publication or use. Third party data is owned or licenced by the data provider and may not be reproduced, extracted or used for any other purpose without the data provider’s consent. Neither we, nor the data provider, will have any liability in connection with the third party data. The material is not intended to provide, and should not be relied on for accounting, legal or tax advice. Reliance should not be placed on any views or information in the material when taking individual investment and/or strategic decisions. No responsibility can be accepted for error of fact or opinion. The forecasts included in this presentation should not be relied upon, are not guaranteed and are provided only as at the date of issue. Our forecasts are based on our own assumptions which may change. We accept no responsibility for any errors of fact or opinion and assume no obligation to provide you with any changes to our assumptions or forecasts. Forecasts and assumptions may be affected by external economic or other factors. Any references to securities, sectors, regions and/or countries are for illustrative purposes only. Schroders will be a data controller in respect of your personal data. For information on how Schroders might process your personal data, please view our Privacy Policy available at www.schroders.com/en/privacy-policy or on request should you not have access to this webpage. For your security, communications may be recorded or monitored. 34
Important information
Source for ratings: Morningstar, as at 31 December 2020. © 2019 Morningstar UK Ltd. All rights reserved. The information contained herein: (1) is proprietary
to Morningstar and/or its content providers; (2) may not be copied or distributed; and (3) is not warranted to be accurate, complete, or timely. Neither
Morningstar nor its content providers are responsible for any damages or losses arising from any use of this information. Past performance is no guarantee
of future results. For more detailed information about Morningstar's Analyst Rating, including its methodology, please go to:
http://corporate.morningstar.com/us/documents/MethodologyDocuments/AnalystRatingforFundsMethodology.pdf
For disclosure and detailed information about this fund please refer to full Morningstar Global Fund Report:
http://essentials.morningstar.com/file/downloadEuAnalystRatingReport?IsUKCOUNTRY=false&univ=FO&isFullReport=true&msgType=514,639&MstarId=F0G
BR04DLC&countryId=GBR&languageId=EN

Third party data is owned or licensed by the data provider and may not be reproduced or extracted and used for any other purpose without the data
provider's consent. Third party data is provided without any warranties of any kind. The data provider and issuer of the document shall have no liability in
connection with the third party data. The Prospectus and/or www.schroders.com contains additional disclaimers which apply to the third party data.

Issued in February 2021 by Schroder Unit Trusts Limited, 1 London Wall Place, London EC2Y 5AU. Registered No: 4191730 England. Authorised and regulated
by the Financial Conduct Authority.

35
You can also read