Science of the Total Environment - OceanRep
←
→
Page content transcription
If your browser does not render page correctly, please read the page content below
Science of the Total Environment 775 (2021) 145238

                                                                      Contents lists available at ScienceDirect

                                                          Science of the Total Environment

                                                  journal homepage: www.elsevier.com/locate/scitotenv

Global economic costs of aquatic invasive alien species
Ross N. Cuthbert a,b,⁎, Zarah Pattison c, Nigel G. Taylor d, Laura Verbrugge e,f, Christophe Diagne g,
Danish A. Ahmed h, Boris Leroy i, Elena Angulo g, Elizabeta Briski a, César Capinha j, Jane A. Catford k,l,
Tatenda Dalu m,b, Franz Essl n, Rodolphe E. Gozlan o, Phillip J. Haubrock p,q, Melina Kourantidou r,s,t,
Andrew M. Kramer u, David Renault v,w, Ryan J. Wasserman x,b, Franck Courchamp g
a
  GEOMAR Helmholtz-Zentrum für Ozeanforschung Kiel, 24105 Kiel, Germany
b
  South African Institute for Aquatic Biodiversity, Makhanda 6140, South Africa
c
  Modelling, Evidence and Policy Research Group, School of Natural and Environmental Sciences, Newcastle University, Newcastle upon Tyne NE1 7RU, UK
d
  Tour du Valat, Research Institute for the Conservation of Mediterranean Wetlands, 13200 Arles, France
e
  University of Helsinki, Faculty of Agriculture and Forestry, Department of Forest Sciences, P.O. Box 27, 00014 Helsinki, Finland
f
  Aalto University, Department of Built Environment, Water & Development Research Group, Tietotie 1E, FI-00076 Aalto, Finland
g
  Université Paris-Saclay, CNRS, AgroParisTech, Ecologie Systématique Evolution, 91405 Orsay, France
h
  Center for Applied Mathematics and Bioinformatics (CAMB), Department of Mathematics and Natural Sciences, Gulf University for Science and Technology, P.O. Box 7207, Hawally 32093, Kuwait
i
  Biologie des Organismes et Ecosystèmes Aquatiques (BOREA), Muséum national d'Histoire naturelle, CNRS, IRD, Sorbonne Université, Université Caen-Normandie, Université des Antilles, 43 rue
Cuvier, CP 26, 75005 Paris, France
j
  Centro de Estudos Geográficos, Instituto de Geografia e Ordenamento do Território – IGOT, Universidade de Lisboa, Lisboa, Portugal
k
  Department of Geography, King's College London, Strand WC2B 4BG, UK
l
  School of BioSciences, University of Melbourne, Vic 3010, Australia
m
   School of Biology and Environmental Sciences, University of Mpumalanga, Nelspruit 1200, South Africa
n
  BioInvasions, Global Change, Macroecology-Group, Department of Botany and Biodiversity Research, University Vienna, Rennweg 14, 1030 Vienna, Austria
o
  ISEM UMR226, Université de Montpellier, CNRS, IRD, EPHE, 34090 Montpellier, France
p
  Senckenberg Research Institute and Natural History Museum, Frankfurt, Department of River Ecology and Conservation, Gelnhausen, Germany
q
  University of South Bohemia in České Budějovice, Faculty of Fisheries and Protection of Waters, South Bohemian Research Center of Aquaculture and Biodiversity of Hydrocenoses, Zátiší 728/II,
389 25 Vodňany, Czech Republic
r
  Woods Hole Oceanographic Institution, Marine Policy Center, Woods Hole, MA 02543, United States
s
  Institute of Marine Biological Resources and Inland Waters, Hellenic Center for Marine Research, Athens 164 52, Greece
t
  University of Southern Denmark, Department of Sociology, Environmental and Business Economics, Esbjerg 6705, Denmark
u
  Department of Integrative Biology, University of South Florida, Tampa, FL 33620, United States
v
  Univ Rennes, CNRS, ECOBIO [(Ecosystèmes, biodiversité, évolution)], - UMR 6553, F 35000 Rennes, France
w
   Institut Universitaire de France, 1 Rue Descartes, 75231 Paris cedex 05, France
x
  Department of Zoology and Entomology, Rhodes University, Makhanda 6140, South Africa

H I G H L I G H T S                                         G R A P H I C A L          A B S T R A C T

• Aquatic invasions have cost the global
  economy US$345 billion.
• Most costs are caused by invertebrates,
  in North America and damages to re-
  sources.
• Costs have increased exponentially over
  time, to at least US$23 billion in 2020.
• Aquatic invasion costs are underrepre-
  sented compared to terrestrial invasion
  costs.
• Taxonomic, geographic and tempo-
  ral gaps make these costs severely
  underestimated.

    ⁎ Corresponding author at: GEOMAR, Helmholtz-Zentrum für Ozeanforschung Kiel, 24105 Kiel, Germany.
      E-mail address: rossnoelcuthbert@gmail.com (R.N. Cuthbert).

https://doi.org/10.1016/j.scitotenv.2021.145238
0048-9697/© 2021 The Authors. Published by Elsevier B.V. This is an open access article under the CC BY license (http://creativecommons.org/licenses/by/4.0/).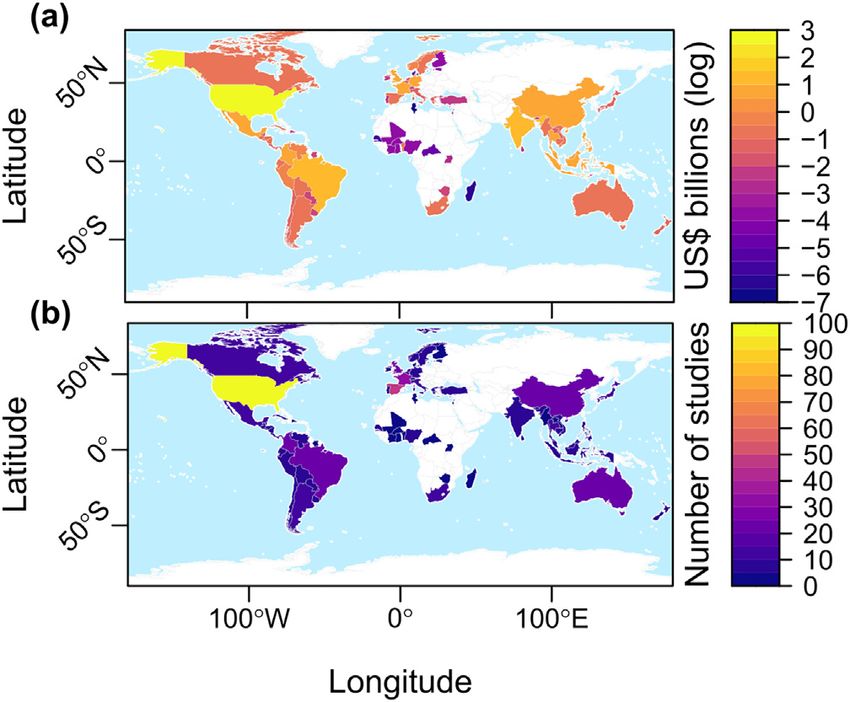
R.N. Cuthbert, Z. Pattison, N.G. Taylor et al.                                                                      Science of the Total Environment 775 (2021) 145238

a r t i c l e             i n f o                a b s t r a c t

Article history:                                 Much research effort has been invested in understanding ecological impacts of invasive alien species (IAS) across
Received 12 November 2020                        ecosystems and taxonomic groups, but empirical studies about economic effects lack synthesis. Using a compre-
Received in revised form 6 January 2021          hensive global database, we determine patterns and trends in economic costs of aquatic IAS by examining: (i) the
Accepted 13 January 2021
                                                 distribution of these costs across taxa, geographic regions and cost types; (ii) the temporal dynamics of global
Available online 20 January 2021
                                                 costs; and (iii) knowledge gaps, especially compared to terrestrial IAS. Based on the costs recorded from the
Editor: Damia Barcelo                            existing literature, the global cost of aquatic IAS conservatively summed to US$345 billion, with the majority at-
                                                 tributed to invertebrates (62%), followed by vertebrates (28%), then plants (6%). The largest costs were reported
Keywords:                                        in North America (48%) and Asia (13%), and were principally a result of resource damages (74%); only 6% of re-
Brackish                                         corded costs were from management. The magnitude and number of reported costs were highest in the United
Freshwater                                       States of America and for semi-aquatic taxa. Many countries and known aquatic alien species had no reported
Habitat biases                                   costs, especially in Africa and Asia. Accordingly, a network analysis revealed limited connectivity among coun-
InvaCost                                         tries, indicating disparate cost reporting. Aquatic IAS costs have increased in recent decades by several orders
Marine
                                                 of magnitude, reaching at least US$23 billion in 2020. Costs are likely considerably underrepresented compared
Monetary impact
                                                 to terrestrial IAS; only 5% of reported costs were from aquatic species, despite 26% of known invaders being
                                                 aquatic. Additionally, only 1% of aquatic invasion costs were from marine species. Costs of aquatic IAS are thus
                                                 substantial, but likely underreported. Costs have increased over time and are expected to continue rising with fu-
                                                 ture invasions. We urge increased and improved cost reporting by managers, practitioners and researchers to re-
                                                 duce knowledge gaps. Few costs are proactive investments; increased management spending is urgently needed
                                                 to prevent and limit current and future aquatic IAS damages.
                                                       © 2021 The Authors. Published by Elsevier B.V. This is an open access article under the CC BY license
                                                                                                                  (http://creativecommons.org/licenses/by/4.0/).

1. Introduction                                                                    generally less well understood than costs of terrestrial IAS, despite
                                                                                   some estimates indicating high costs (Lovell et al., 2006; Aldridge and
    The impacts of invasive alien species (IAS) on biodiversity (Mollot            Oreska, 2011). Comprehensive and systematically-assembled data on
et al., 2017; Spatz et al., 2017; Shabani et al., 2020), ecosystem services        the costs of aquatic IAS would greatly help planning and prioritisation
(Vanbergen, 2013; Blackburn et al., 2019) and human wellbeing                      for their management, in the context of limited resources (McGeoch
(Pejchar and Mooney, 2009) are well recognized (Pyšek et al., 2020). Ac-           et al., 2015). Such data would also provide a useful resource for commu-
cordingly, there are numerous national and international policies, regula-         nications with policymakers and the general public: impacts expressed
tions and mandates in place to prevent new introductions and limit the             in economic terms are more tangible and comprehensible than complex
geographic spread of IAS [e.g. Convention on Biological Diversity (UNEP,           ecological impacts (Diagne et al., 2020a).
2011); European Union Regulation 1143/2014 on IAS]. However, records                   This paper is the first systematic effort to describe global pat-
of IAS are continuously increasing, owing to factors such as habitat distur-       terns and trends in reported costs of aquatic IAS. Our analysis,
bance, climate change, and an increasing diversity, frequency and inten-           based on the recently developed InvaCost database (Diagne et al.,
sity of anthropogenic vectors associated with globalising trade and                2020b), allows us to synthesise standardised costs, identify knowl-
transport networks (Capinha et al., 2015; Seebens et al., 2017, 2018;              edge gaps and provide recommendations for management and fur-
Turbelin et al., 2017; McGeoch and Jetz, 2019). Alien species numbers              ther research. We describe the global monetary costs associated
are burgeoning across geographical regions and habitat types, with the             with aquatic IAS based on taxonomic, geographic and temporal de-
number of established alien species expected to increase by 36% in the             scriptors, as well as between fully aquatic and semi-aquatic taxa. In
next three decades (Seebens et al., 2020).                                         doing so, we examine (i) how costs are structured by implementa-
    Aquatic ecosystems can be severely threatened by IAS, which                    tion method (i.e. observed vs. potential/expected), (ii) reliabilities
contribute to extinctions of individual species, substantially                     of cost estimates and (iii) their typology, i.e., whether costs result
change the structure of native communities, and alter ecosystem                    from damages and losses or management expenditure. Further,
functioning (Vitousek et al., 1997; Ricciardi and MacIsaac, 2011;                  we model the yearly and cumulative dynamics of costs and investi-
Jackson et al., 2017). Aquatic ecosystems provide numerous ser-                    gate whether they are likely to saturate in the near future. Finally,
vices to people, from food provision to flood protection and recrea-                we assess potential biases between aquatic and terrestrial cost
tion; these services can also be critically altered by the presence of             reporting. These biases are then used to identify gaps in manage-
IAS (e.g. Katsanevakis et al., 2014). The vulnerability of aquatic eco-            ment spending between habitats.
systems to invasions is increased by high interconnectedness
among habitats, specifically man-made waterways and shipping,                       2. Materials and methods
as well as other anthropogenic pressures (Strayer and Findlay,
2010; Poulin et al., 2011; Darwall et al., 2018) and climate shifts                2.1. Original data
(Woodward et al., 2010).
    In recent years there have been significant advances across habitat                 For the purpose of quantifying global costs of aquatic IAS, we used the
types in understanding ecological impacts of IAS (Kumschick et al.,                most comprehensive and up-to-date dataset of costs caused by alien spe-
2015; Dick et al., 2017; but see Crystal-Ornelas and Lockwood, 2020)               cies globally, assembled by the InvaCost project (Diagne et al., 2020a,
and the drivers of invasion success (Cuthbert et al., 2019, 2020;                  2020b). At time of writing, this includes 9823 entries in various lan-
Fournier et al., 2019; van Kleunen et al., 2020), as well as methodologi-          guages from systematic and opportunistic literature searches (Diagne
cal advances in assessing the economic dimensions of IAS and their                 et al., 2020b; Angulo et al., 2021; full database version 3 at https://doi.
management (Lovell et al., 2006; Hanley and Roberts, 2019). However,               org/10.6084/m9.figshare.12668570). This database captures any re-
studies of economic aspects of IAS have been limited to certain                    ported economic costs associated with IAS in their novel range, including
taxonomic groups (Bradshaw et al., 2016), communities, or regions                  those for species that have already become invasive (e.g. management,
(Pimentel et al., 2000; 2005; Kettunen et al., 2009; Cuthbert et al.,              damages and losses) and species that may become invasive in the future
2021; Haubrock et al., 2021). In particular, costs of aquatic IAS are              (e.g. prevention and rapid eradication).

                                                                               2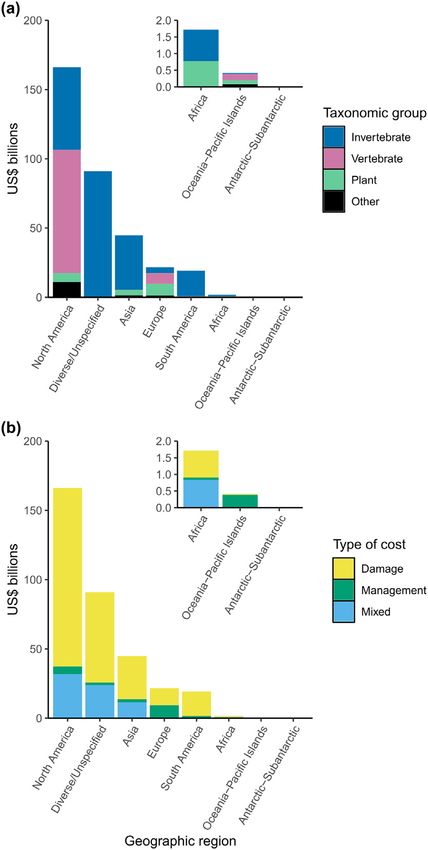
R.N. Cuthbert, Z. Pattison, N.G. Taylor et al. Science of the Total Environment 775 (2021) 145238
The InvaCost version 3 database contains a column ("Environment_ 1). Second, we employed and compared a range of statistical techniques
IAS") which classifies species as either aquatic (species with a close associ- on the resulting data: ordinary least squares regression (linear and qua-
ation with aquatic systems at any life stage, including for reproduction, dratic), robust regression (linear and quadratic), multivariate adaptive
development and/or foraging; n = 2317 cost entries after our below cor- regression splines, generalised additive models (GAMs) and quantile re-
rections) or terrestrial (n = 6433 cost entries after our below correc- gression [0.1 (lower boundary of cost), 0.5 (median cost value), 0.9
tions), independently of where costs occurred. For some analyses, we (upper boundary of cost)].
split out costs for semi-aquatic species: the subset of aquatic species
with a looser association with aquatic systems (see Supplementary 2.5. Trend in cumulated costs for aquatic IAS
Material 1). Remaining entries, linked to species from diverse habitats
(i.e. a mixture of aquatic and terrestrial) or unspecified habitats, were In addition to modelling annual costs, we mathematically described
excluded from analyses. We also carefully screened the published data- temporal changes in cumulated costs of aquatic IAS. We chose to rely on
base, removing clear duplicates and correcting clear mistakes. All mod- a variation of the functional form proposed by Yokomizo et al. (2009)
ifications made in our dataset were sent to updates@invacost.fr as for density-impact curves, where we considered the cumulative cost C
recommended by the database managers. in terms of population density u. By assuming logistic growth in the
Briefly, costs in InvaCost are standardised against a single currency population, C can then be expressed as a function of time and therefore
for comparability (2017 US$); costs in the database may be ‘expanded’ serves as a model for the cumulative temporal cost of impacts (Supple-
so that entries can be considered on an annual basis. That means that mentary Material 1). We used a non-linear regression curve-fitting tool
costs spanning multiple years (e.g. $10 million between 2001 and to estimate the best fit parameters, such as cost saturation Cmax, carrying
2010) are divided according to their duration (e.g. $1 million for each capacity K and intrinsic growth rate α. We quantified the fit by comput-
year between 2001 and 2010); we considered this expanded database ing the squared correlation coefficient (r2) and root mean square error
version in all analyses (Supplementary Materials 1; n = 5682 aquatic en- (RMSE).
tries). Expansion was done using the expandYearlyCosts function of the
‘invacost’ R package (R Core Team, 2020; Leroy et al., 2020). The final, 2.6. Reporting of invasion costs from aquatic IAS compared to terrestrial IAS
unexpanded dataset used in our analyses is provided as Supplementary
Material 2. We note that 1 billion = 1 × 10⁹. We obtained known numbers of established alien species (n =
13,867) in aquatic and terrestrial habitats globally, using databases
2.2. Cost descriptors such as the inventory of IAS in Europe (DAISIE; see Supplementary
Material 1 for full list of sources). Categorising entries originating from
To obtain a general overview of the costs associated with IAS, we either aquatic or terrestrial species, we then counted for the two habi-
first illustrated them across a number of key database descriptors tats in InvaCost: the numbers of species having costs (excluding unspe-
(see Supplementary Material 1 and https://doi.org/10.6084/m9. cific entries), the number of documents reporting these costs, total
figshare.12668570 for complete details). These included (1) broad costs, and costs only reporting management actions (not reporting
taxonomic grouping of species presenting costs (invertebrates, ver- damage). Then, we compared these numbers to the proportions of
tebrates, plants, other), (2) perceived reliability of each cost entry known established IAS between habitats. Finally, we predicted the ex-
(“High” vs. “Low”), (3) cost implementation type (“Observed” vs. pected costs of management actions for aquatic IAS, under the hypoth-
“Potential”), (4) geographic region in which the cost occurred esis of an unbiased expenditure between aquatic and terrestrial habitats
(within continent- and country- scales) and (5) cost type (“Damage” (based on the known proportion of global aliens that are aquatic).
vs. “Management”). We summed the expanded entries (see above)
to quantify cost totals among these descriptors. 3. Results
2.3. Spatial and taxonomic connectivity 3.1. Global costs and taxonomic groupings
We investigated spatial and taxonomic patterns in costs of aquatic Global costs of aquatic IAS summed to US$345 billion, based on 5682
IAS with a network analysis (see Supplementary Material 1). Here, we records from the expanded InvaCost database. These were all published
created a bipartite network composed of two types of nodes: countries since 1971. Semi-aquatic species cost US$185 billion (n = 2971 records)
and IAS. When a species had a reported economic impact in a country, a and fully aquatic species US$149 billion (n = 2518 records), with diverse
link was drawn between the two nodes. The weight of the link was costs (that spanned semi-aquatic and fully aquatic species) comprising
equal to the cumulative cost, since 1960. We defined the size of nodes the remaining US$11 billion (n = 193 records). Only 1% of the cost was
on the network as proportional to their total costs with a log spline, from fully marine species (US$3.6 billion; n = 234 records).
such that country or species nodes with higher costs are easier to distin- Costs were unevenly distributed across taxonomic groups, with the
guish from those with lower economic impacts. majority (62%, US$214 billion) attributed to invertebrates, 28% (US$97
billion) to vertebrates and 6% (US$20 billion) to plants. All other taxo-
2.4. Prediction of annual costs for aquatic IAS nomic groups accounted collectively for 4% (US$14 billion) of the total
costs (Fig. 1). Highly reliable (i.e. peer-reviewed or traceable) sources
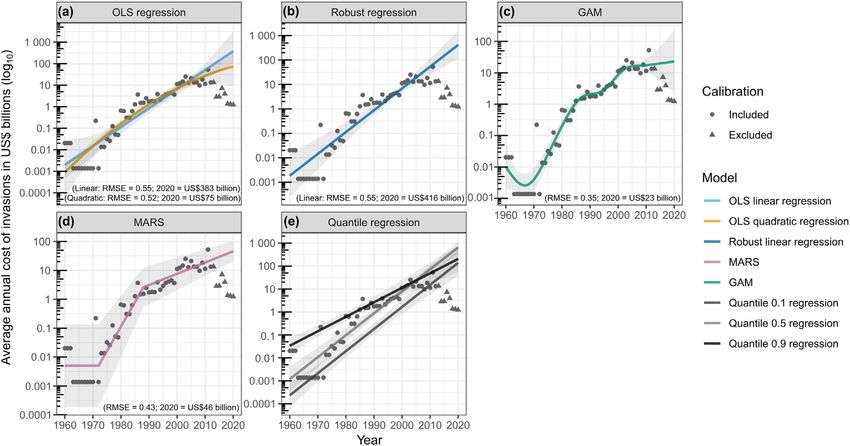
To examine the most appropriate temporal relationship for the accu- contributed 79% (US$274 billion) of the documented total costs of
mulation of costs over time, we used the modelCosts function of the aquatic IAS (Fig. 1a). The majority of the total costs for animals (inverte-
‘invacost’ package (Leroy et al., 2020). We fitted multiple models to brates: 76%; vertebrates: 88%) and plants (65%) were based on highly
the data and identified the best model(s) by quantitative and qualitative reliable sources.
criteria (see Supplementary Material 1). As we were dealing with Most (65%, US$224 billion) of the costs were derived from empirical
econometric data, we selected models that were robust to issues of observations, rather than predictions (Fig. 1b). The majority of costs for
heteroskedasticity, temporal autocorrelation and outliers. We exam- aquatic invertebrates were derived from empirical observations (92%).
ined the long-term trend of annual costs worldwide between 1960 However, just 17% of the costs for aquatic vertebrates and 42% of plant
and 2020, i.e., we predicted costs as a function of years. First, owing to costs, were based on empirical observations.
time lags in cost reporting, we corrected the data by removing the The 10 aquatic genera with the highest documented costs accounted
most recent, thus incomplete years; not making this correction would for US$304 billion (88%) of total costs (Fig. 2). These taxa included four
result in an inherent underestimation of costs (Supplementary Material invertebrates, three vertebrates and three plants. Mosquitoes belonging
3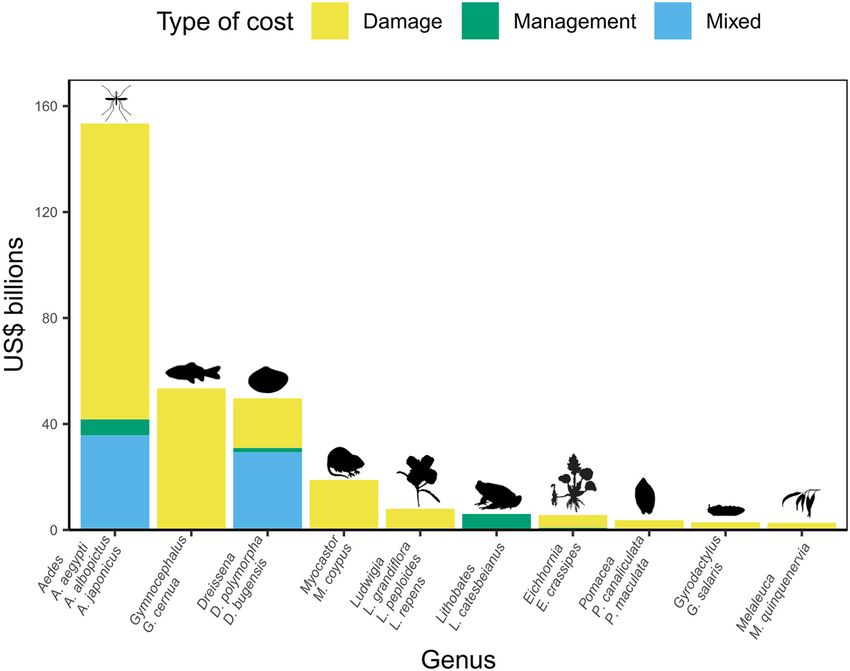
R.N. Cuthbert, Z. Pattison, N.G. Taylor et al.                                                                                          Science of the Total Environment 775 (2021) 145238

Fig. 1. Balloon plots illustrating global monetary costs of aquatic invasive alien species across major taxonomic groupings, with respect to (a) method reliability and (b) implementation
type. Figures below each balloon correspond to the numbers of entries from the expanded database.

to three species of the Aedes genus caused 50% (US$153 billion) of the                           costs (48%, US$166 billion), followed by costs that were not attributed
total top 10 cost. These were followed by ruffes Gymnocephalus cernua                            to specific regions (26%, US$91 billion) and costs from Asia (13%, US
(18%, US$53 billion), mussels Dreissena spp. (two species, 16%, US$50                            $45 billion). The costs in Europe and South America accounted
billion), coypus Myocastor coypus (6%, US$19 billion) and primroses                              collectively for 12% (US$41 billion) of total reported costs, whilst
Ludwigia spp. (three species, 3%, US$8 billion). Contributions from                              Africa, Oceania-Pacific Islands and the Antarctic-Subantarctic, combined
the remaining genera were relatively small. For all genera, excepting                            accounted for 0.6% (US$2.1 billion) (Fig. 3). Regarding cost types, 74%
Lithobates, damages outweighed reported management spending                                      (US$256 billion) of global costs were driven by damages, whereas
(Fig. 2).                                                                                        only 6% (US$21 billion) consisted of management-related expenditure
                                                                                                 (Fig. 3b). Mixed spending (i.e. combined records of damage and
3.2. Geographic regions                                                                          management-related spending) comprised 20% of global costs (US$68
                                                                                                 billion). Further information on taxonomic and cost typology break-
   Reported economic costs of aquatic IAS were unevenly distributed                              downs per region is provided in Supplementary Material 1.
across geographic regions (Fig. 3). North America, owing to costs                                    At the country level, the USA had the highest recorded cost for
primarily from the United States of America (USA), reported the highest                          aquatic IAS, followed by Brazil, India and France (Fig. 4a); other

Fig. 2. Total monetary costs of the top 10 costly aquatic invasive alien genera, alongside species-specific information of underlying data pertaining to each genus. Unspecified species within
each genus were also included. Fills illustrate cost type contributions per genus. Note that “Management” corresponds to expenditure related to activities such as prevention, control,
eradication and research, whilst “Mixed” is a mixture of cost types.

                                                                                             4
R.N. Cuthbert, Z. Pattison, N.G. Taylor et al.                                                                                             Science of the Total Environment 775 (2021) 145238

                                                                                                     Fig. 4. Maps illustrating global distribution of (a) total economic costs and (b) number of
                                                                                                     studies (i.e. unique documents) for aquatic invasive alien species. Costs unattributable to
                                                                                                     individual countries were excluded (US$110 billion, out of a total US$345 billion; n =
                                                                                                     37 study per country data points, out of a total 526). Costs with a known location in the
                                                                                                     territorial waters of each country are also included in the displayed data. Total costs are
                                                                                                     presented on a log10 scale.

                                                                                                     country, several IAS taxa had widespread economic impacts on multiple
                                                                                                     countries, such as Lithobates catesbeianus, M. coypus, Neovison vison,
                                                                                                     Dreissena spp., Hydrocotyle ranunculoides and Eichhornia crassipes. Inter-
                                                                                                     estingly, we found no strong biogeographical structure in the network.
                                                                                                     Australia, for example, shared costly IAS with geographically disparate re-
                                                                                                     gions such as European countries, South Africa, Argentina and Chile.

                                                                                                     3.4. Prediction of annual costs for aquatic IAS

                                                                                                         The linear models projected the highest costs of aquatic IAS in the
                                                                                                     year 2020 (since 1960; data from years 2013 to 2020 were removed
                                                                                                     owing to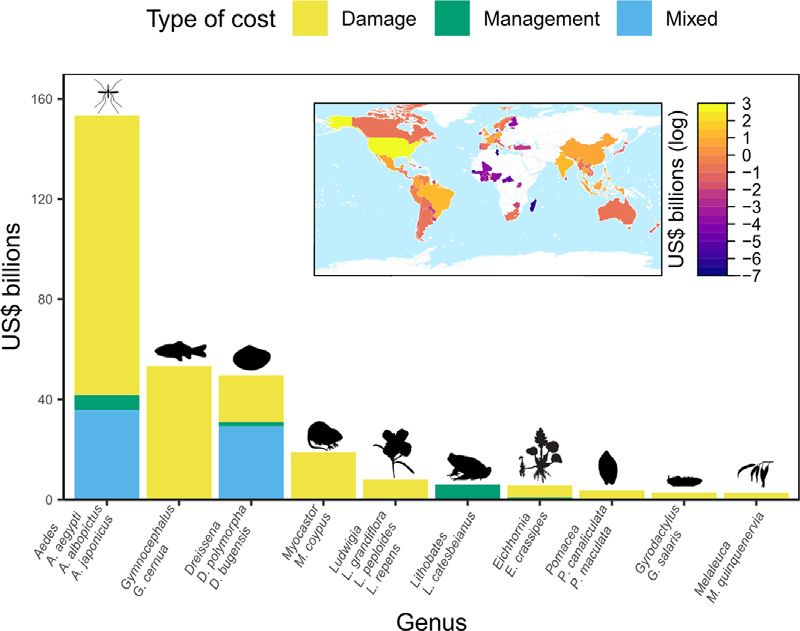
R.N. Cuthbert, Z. Pattison, N.G. Taylor et al. Science of the Total Environment 775 (2021) 145238
Batrachochytrium dendrobatidis
Nymphoides peltata Pseudochattonella verruculosa
Cygnus atratus Paralithodes camtschaticus
Aeromonas salmonicida Phoxinus phoxinus Aphanomyces astaci
Sargassum muticum Mnemiopsis leidyi
Balanus improvisus
Norway
Bulgaria/Georgia/Roumania/Russia/Turkey/Ukraine
Sweden Didemnum vexillum
Ludwigia repens
Gyrodactylus salaris
Estonia
Crassula helmsii
Cygnus olor
Alopochen aegyptiaca
Senegal Crepidula porcellana Ireland
Typha domingensis
Branta canadensis
Anguillicoloides crassus Turkey
Senegal/Mauritania
Carassius auratus
United Kingdom
Ondatra zibethicus Netherlands Elodea nuttallii Lagocephalus sceleratus
Zimbabwe Salvinia natans Pseudorasbora parva Elodea canadensis
Eriocheir sinensis Cyprus
Lagarosiphon major
Oxyura jamaicensis
Salvinia molesta Ludwigia spp.
Sri Lanka
Ludwigia grandiflora Belgium
Myriophyllum aquaticum
Spartina spp. Germany Threskiornis aethiopicus
Ameiurus nebulosus Pacifastacus leniusculus Pterois volitans
Polypedates leucomystax
Rudbeckia laciniata Lithobates catesbeianus Ludwigia peploides
Saururus cernuus
Hydrocotyle ranunculoides
Gymnocoronis spilanthoides Neovison vison Didymosphenia geminata
Japan
Pistia stratiotes Potamogeton sp. Israel
Ludwigia sp.
Lepomis macrochirus New Zealand Rhopilema nomadica
Micropterus salmoides Myocastor coypus
France
Undaria pinnatfida
Chelydra serpentina Trachemys scripta
Dikerogammarus villosus
Egeria densa Burkina Faso Mali Argentina/Chile
Xenopus laevis
Graptemys pseudogeographica Madagascar
Italy Panicum maximum
Sander lucioperca Baccharis halimifolia Central African Republic Argentina
Nymphaea sp. Azolla filiculoides
Chile
Gambusia holbrooki Ghana
Cyprinus carpio Procambarus clarkii South Africa Uganda Philippines/Thailand/Vietnam
Orconectes limosus
Nymphaea mexicana
Spain
Portugal
Benin
Pomacea spp. Castor canadensis Ficopomatus enigmaticus
Typha angustifolia Lepomis gibbosus Eichhornia crassipes
Fundulus heteroclitus
Callinectes sapidus Phragmites australis Lissorhoptrus oryzophilus
China Philippines Limnoperna fortunei
Oncorhynchus mykiss
Mytilopsis trautwineana
Lissorhoptrus brevirostris
Aedes spp.
Uruguay
Sinanodonta woodiana
Alternanthera philoxeroides Colombia
Corbicula fluminea
Melaleuca quinquenervia
Salvador
Dreissena spp.
Solanum tampicense Panama
Sporobolus alterniflorus
Sporobolus pumilus
Perca fluviatilis Esox lucius Indonesia
Cabomba caroliniana Nicaragua
Pterygoplichthys sp.
Mexico
India Brazil Bangladesh/India/Pakistan/Sri Lanka
USA
Cyperus alterniflorus
Silurus glanis Canada/USA Thailand Malaysia Switzerland
Greece
Honduras Peru Anopheles darlingi
Hydrilla verticillata Spartina sp.
Sporobolus anglicus Paraguay Brunei Myanmar
Dominican Republic
Nigeria Petromyzon marinus Caulerpa taxifolia Venezuela Portunus pelagicus
Teredo navalis Singapore
Gymnocephalus cernua
Vietnam
Timor-Leste
Belize Maldives Guatemala
Australia Bolivia Bhutan Cambodia/Malaysia/Thailand
Ascophyllum nodosum Germany/Unspecified Cuba Tunisia
Styela clava
Hydrilla sp. Myriophyllum spicatum Cambodia
Canada Lythrum salicaria Rhinella marina Suriname Ecuador Laos Costa Rica
Eichhornia sp. Spartina spp.
Salvinia spp.
Ciona intestinalis Myriophyllum sp. Lepidium latifolium Australia/Brazil/Venezuela Brazil/Guatemala/Panama/Salvador/Venezuela
Denmark
Codium fragile Sporobolus cynosuroides
Bythotrephes longimanus Bubalus bubalis
Carcinus maenas
Zantedeschia aethiopica Channa argus Salmo trutta
Orconectes rusticus Hymenachne spp.
Panicum repens
Morone chrysops
Hymenachne amplexicaulis
Python bivittatus
Myriophyllum heterophyllum
Brachiaria mutica
Coptodon zillii
Finland Cercopagis pengoi
Fig. 5. Global network of aquatic invasive alien species costs per country. This bipartite network is composed of both species and country nodes. Links indicate the cumulative costs of
species in countries. The thicker the link, the higher the cost. Likewise, node size is proportional to the total cumulative cost, with a log spline. For species nodes, node size represents
the total cost they had over all countries. For country nodes, the node size represents the total cost of all species in that country.
Fig. 6. Five modelling techniques considering global aquatic invasion costs over time [ordinary least squares (OLS) regressions (a), robust regression (b), generalised additive model (GAM)
(c), multivariate adaptive regression splines (MARS) (d) and quantile regressions (e)]. Points are annual total costs. Note the scales differ among subplots. Shaded areas are 95% confidence
intervals, and prediction intervals in the case of MARS. Root mean square error (RMSE) is shown for all appropriate models as well as 2020 cost predictions.
6
R.N. Cuthbert, Z. Pattison, N.G. Taylor et al.                                                                                            Science of the Total Environment 775 (2021) 145238

Fig. 7. Plot of the linear curve model given by Eq. (3) (Supplementary Material 1) against the cumulative cost data. Circular markers represent all the data. We computed best fit parameter
values Cmax = 335.1, K = 26274, α = 0.22 and metric values r2 = 0.996, RMSE =6.73. Square markers represent the adjusted data set, which excludes four upper end extreme values (any
cost value greater than Q3 + 1.5 × IQR = US$14.66 billion, where Q3 is the upper quartile and the IQR is the interquartile range of the dataset), i.e. (2003, US$25.06 billion), (2005, US$21.07
billion), (2009, US$18.34 billion) and (2011, US$52.61 billion), corresponding to times t = 43, 45, 49 and 51, respectively. We found that Cmax = 205.6, K = 2882, α = 0.18, r2 = 0.999 and
RMSE = 2.26. The shaded areas represent 95% confidence regions indicating the range of predicted cumulative costs.

to 74% associated with terrestrial habitats (Fig. 8). Although in InvaCost                         4. Discussion
the number of aquatic species and the number of documents reporting
their costs constituted relatively similar percentages (20% and 28%,                                   Our study reveals that aquatic IAS have likely cost the global economy
respectively), the value of their reported cost comprised just 5% of the                           at least US$345 billion. This estimate is probably highly conservative as it
global total. This increased to just 9% when considering only costs                                only includes costs that have been documented and captured in the
reported from management strategies. If management expenditure                                     InvaCost database. Moreover, the taxonomic, geographic, temporal and
was unbiased between habitat types according to numbers of known                                   habitat trends among these costs suggest that cost reporting is very un-
established aliens, we estimated that a further US$39 billion should                               even, with many IAS and countries entirely lacking reported costs. Most
have been spent on aquatic species to date.                                                        costs were attributed to aquatic invertebrates (US$214 billion), with
                                                                                                   lower costs for vertebrates (US$97 billion) and plants (US$20 billion).
                                                                                                   Our estimate of the costs of aquatic IAS globally in the year 2020 – US
                                                                                                   $23 billion, much higher in magnitude than the cost, for example, of man-
                                                                                                   aging global marine protected areas (US$5–19 billion; Balmford et al.,
                                                                                                   2004) – calls for increased investments in management of IAS.

                                                                                                   4.1. Cost distributions across taxa

                                                                                                       Globally, mosquitoes are major contributors to the burden of
                                                                                                   diseases, with vector-borne pathogens and parasites causing over one
                                                                                                   billion infections and one million deaths annually (Kilpatrick and
                                                                                                   Randolph, 2012; Campbell-Lendrum et al., 2015). The massive costs at-
                                                                                                   tributed to vector-borne diseases from invasive mosquitoes are thus not
                                                                                                   surprising, given the costs to healthcare systems worldwide. In Brazil,
                                                                                                   for example, the government invested approximately US$48 million
                                                                                                   per year from 2015 to 2017 for limiting population outbreaks of
                                                                                                   A. aegypti (Bueno et al., 2017). In Columbia, total medical costs for the
                                                                                                   treatment of dengue-infected patients reached US$3 billion between
                                                                                                   2010 and 2012 (Rodríguez et al., 2015), and the recent chikungunya
                                                                                                   outbreak cost about US$76 million to the healthcare system (Cardano
                                                                                                   et al., 2015). Mosquitoes can also lead to economic losses associated
                                                                                                   with recreation and tourism, as they discourage people from carrying
                                                                                                   out certain activities or visiting certain sites (Claeys-Mekdade and
                                                                                                   Morales, 2002). In the present study, damages to sectors such as health
                                                                                                   comprised 73% of mosquito costs, with just 4% spent on management.
                                                                                                   Future range expansions of invasive mosquitoes are expected to in-
                                                                                                   crease their economic impact (Iwamura et al., 2020). Although mosqui-
Fig. 8. Proportions of known established alien species, and with respect to InvaCost
estimates: numbers of species, documents, total costs and management costs between
                                                                                                   toes vector diseases in their terrestrial-based adult life stage, where most
terrestrial and aquatic habitats. Raw values are presented per habitat type; abbreviations:        costs are incurred, larval and pupal life stages are invariably spent in
b. = billion.                                                                                      water where management is often targeted, with the characteristics

                                                                                               7
R.N. Cuthbert, Z. Pattison, N.G. Taylor et al.                                                                    Science of the Total Environment 775 (2021) 145238

and distribution of aquatic habitat patches determining mosquito distri-          well-known impacts on human wellbeing (Appleton et al., 2009;
butions at various scales via key trait- and density-mediated processes           Ellender and Weyl, 2014; Weyl et al., 2020; Robinson et al., 2020).
(Pintar et al., 2018; Cuthbert et al., 2019).                                     However, we captured no monetary costs for such taxa. Similarly,
    The Eurasian ruffe (G. cernua) was second most costly and has                 in other African countries, IAS without formally documented or
caused declines of native fish by predation and competition, with con-             quantified costs are known to affect human societies via impacts
siderable economic impacts through reductions in commercially- and                to biological communities, local fisheries and water storage infra-
recreationally-valuable fish species (Leigh, 1998). In turn, the zebra             structures (e.g. Nile perch in East Africa; Harris et al., 1995; Kwena
and quagga mussels (Dreissena polymorpha and Dreissena bugensis)                  et al., 2012; Aloo et al., 2017, and crayfish in Lake Naivasha, Kenya;
are hyper-successful macrofouling freshwater bivalves, which are                  Kafue River, Zambia; Madzivanzira et al., 2020). Limited cost
highly costly to infrastructure through impeding navigation structures,           reporting in Africa and Asia is likely reflective of a low priority
obstruction of water flow in pipes and occlusion of water filters                   given to IAS research, or capabilities (Pyšek et al., 2008), despite
(Sousa et al., 2014). The coypu (M. coypus) has caused substantial eco-           high levels of introduction via, for example, aquaculture (Lin
nomic losses through agricultural impacts, as well as infrastructural             et al., 2015). However, there may have been some bias introduced
damage (Panzacchi et al., 2007). The primroses (Ludwigia spp.) are                by the original InvaCost search string, as no currencies from these
known to reduce water quality that can affect economically important              continents were explicitly included as search terms (even if
taxa such as fish, and can be extremely costly to control (Williams                searches were performed in 15 non-English languages, Angulo
et al., 2010).                                                                    et al., 2021).
    Costs attributed to invasive aquatic invertebrates such as the zebra              Nonetheless, limited cost reporting in Africa and Asia is alarming
and quagga mussels were deemed highly reliable and mostly based on                given that invasions in these countries may disproportionately impact
empirical observations rather than extrapolations. In contrast, a large           livelihoods, given high levels of poverty, limited resources for research
share of vertebrate costs was potential costs, as in the case of the              and management, and an overall limited preparedness to meet chal-
three most costly vertebrate taxa, Eurasian ruffe G. cernua, coypu                lenges brought by IAS (Early et al., 2016). Limited cost reporting also
M. coypus and American bullfrog L. catesbeianus. Therefore, realised ver-         hinders management actions, as the extent of IAS cost is not fully
tebrate costs require improved validation and reporting to the extent             realised by managers.
possible from their actual invaded habitat. Similarly, reported costs of              Network analyses additionally revealed a distinct lack of global
plants, including the highly damaging Ludwigia species and broad-                 structuring of costs, whereby clustering appeared disparate across
leaved paper bark M. quinquenervia, were primarily potential costs,               taxa and countries, insinuating a largely random distribution of costs
not incurred at the time of estimation. Although ecological impacts of            and vast gaps in cost reporting of well-known aquatic IAS. That is, for
aquatic plants have been well-studied by invasion scientists (Pyšek               many countries, there was generally only one cluster, indicating unique
et al., 2008; Gallardo et al., 2016), there is scope for more thorough re-        combinations of economic impacts associated with particular species,
cording of realised economic impacts.                                             despite some of these species being highly widespread. One example
                                                                                  of an exception to this is Aedes spp., which had a consistent and pan-
4.2. Cost distributions across geographic regions and types                       tropical impact, resulting in a distinct cost cluster. Nonetheless, other
                                                                                  context-dependencies, such as differences in climate and pathways,
    The costs of aquatic IAS were also unevenly distributed across                likely also influence IAS compositions.
geographic regions, with particularly high reported costs in North
America (US$166 billion) and Asia (US$45 billion). In turn, a substantial         4.3. Temporal trends in costs
proportion (26%) of the costs were unattributed to specific geographic
regions. Moreover, most costs were driven by damages (74%), whilst                    The majority of fitted models indicated exponentially increasing
management (principally control-related) costs were just 6%. It may               annual costs of aquatic IAS since 1960 over several magnitudes, to a
be expected that management costs are lower than damage or loss                   best-fit extrapolated annual global cost of US$23 billion in 2020.
costs: if the inverse were true, management would not be economically             Model differences in recent years likely reflect differential sensitivities
justifiable. However, the InvaCost search strategy may have exacerbated            to time lags in cost reporting. Model predictions of cost increases over
this difference. Reports of management costs may have been dispropor-             time align with increasing rates of biological invasions worldwide
tionately missed by the systematic literature searches because manage-            (Seebens et al., 2017), as globalisation and intensification of trade and
ment studies often do not mention costs, economics or other InvaCost              transport networks result in high propagule and colonisation pressures
search terms (Diagne et al., 2020b) in their title, abstract or keywords          from novel source pools (Seebens et al., 2018). Given that invasion rates
(e.g. Sandodden and Johnsen, 2010).                                               will increase further in future (Seebens et al., 2020), we can expect fur-
    At the country scale, the USA exhibited both the highest magnitude            ther increases in economic costs – although investments in manage-
of costs and the greatest number of studies compared to all other coun-           ment, especially prevention and rapid eradication, could limit realised
tries. The high degree of cost reporting in the USA is unsurprising given         costs (Leung et al., 2002). Moreover, these results align with the find-
that early estimates of costs focused on this country (Pimentel et al.,           ings of Bradshaw et al. (2016) who have suggested, specifically for
2000, Pimentel et al., 2005), which sparked research efforts to better            invasive insects such as mosquitoes, that costs are generally largely
understand costs and provide a more refined spatial and temporal de-               underestimated and are expected to increase through time. Our
scription for those costs. The USA also scores highly on several socio-           mathematically-modelled density-impact curves also suggest that
economic variables that have been found to correlate positively with re-          costs of IAS to the global economy will continue to increase, as
ported costs of IAS (Haubrock et al., 2021; Kourantidou et al., 2021),            they were far from an asymptotic plateau, even where extreme
such as GDP (1st in world), human population (3rd), international tour-           values were removed and time lags not incorporated. Moreover,
ism arrivals (3rd) and research expenditure (9th).                                this population-level approach does not account for unreported
    In contrast, the InvaCost database contains no aquatic IAS costs at all       costs or those arising from future IAS spread, and this likely results
for many countries, particularly in Asia and Africa. However, even in             in further underestimation.
countries such as South Africa, where research on biological invasion is
leading (van Wilgen et al., 2020), large gaps in our knowledge of eco-            4.4. Reporting of invasion costs of aquatic IAS compared to terrestrial IAS
nomic costs are evident. For example, South Africa is a global invasion
hotspot for freshwater fish and has been invaded by numerous inverte-                 Despite over one quarter of known alien species using aquatic envi-
brate taxa in freshwater, estuarine and marine environments, with                 ronments, only 5% of the total cost in the InvaCost database was

                                                                              8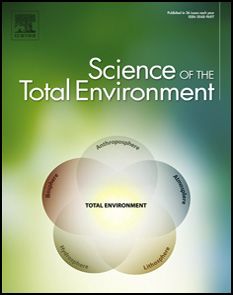
R.N. Cuthbert, Z. Pattison, N.G. Taylor et al.                                                                              Science of the Total Environment 775 (2021) 145238

attributed to aquatic species. Further, the majority (54%) of these costs           Declaration of competing interest
were from semi-aquatic rather than fully aquatic species. On one
hand, this finding potentially reflects a bias in cost reporting towards                 The authors declare that they have no known competing financial
terrestrial systems, in line with ecological research in general (Menge             interests or personal relationships that could have appeared to influ-
et al., 2009; Richardson and Poloczanska, 2008). With respect to man-               ence the work reported in this paper.
agement costs of IAS, if investments of equivalent magnitude to terres-
trial were made for aquatic systems, one would anticipate a further US              Acknowledgements
$39 billion to have been spent to date. Note that this extrapolation
does not consider potentially lower costs in aquatic ecosystems (i.e.                   The authors acknowledge the French National Research Agency
less infrastructure to damage) or differences in management efficien-                (ANR-14-CE02-0021) and the BNP-Paribas Foundation Climate Initia-
cies between terrestrial and aquatic environments. On the other hand,               tive for funding the InvaCost project that allowed the construction of
the disparity between aquatic and terrestrial costs may thus reflect gen-            the InvaCost database. The present work was conducted following a
uinely lower costs of aquatic – particularly marine – IAS relative to ter-          workshop funded by the AXA Research Fund Chair of Invasion Biology
restrial IAS. There are limited human assets and infrastructures in aquatic         and is part of the AlienScenarios project funded by BiodivERsA and
systems, limiting the scope for easily-quantifiable damages and resulting            Belmont-Forum call 2018 on biodiversity scenarios. RNC is funded
in minimal investments in prevention and management. For example,                   through a Humboldt Research Fellowship from the Alexander von
terrestrial agricultural practices are heavily impacted by crop pests               Humboldt Foundation. DAA is funded by the Kuwait Foundation for
(Paini et al., 2016; Ahmed and Petrovskii, 2019), whereas agricultural ac-          the Advancement of Sciences (KFAS) (PR1914SM-01) and the Gulf
tivities in aquatic systems (e.g. rice fields) are relatively scarce. However,       University for Science and Technology (GUST) internal seed fund
aquatic systems do offer highly valuable ecosystem services that could be           (187092). CD was funded by the BiodivERsA-Belmont Forum Project
affected by IAS, such as aquaculture, and often through cascading effects           AlienScenarios (BMBF/PT DLR 01LC1807C). EA was funded by the AXA
that are difficult to predict (Walsh et al., 2016). Thus, we encourage in-           Research Fund Chair of Invasion Biology of University Paris Saclay. CC
vestment in management of IAS in aquatic systems to limit future costs              was supported by Portuguese National Funds through Fundação para a
that stem from damage and loss (Leung et al., 2002).                                Ciência e a Tecnologia (CEECIND/02037/2017; UIDB/00295/2020 and
                                                                                    UIDP/00295/2020). TD acknowledges funding from National Research
5. Conclusions                                                                      Foundation (NRF_ZA) (Grant Number: 117700). FE appreciates funding
                                                                                    by the Austrian Science Foundation (FWF project no I 4011-B32). AMK
    Urgent and coordinated management actions are required globally to              was supported by the NSF Macrosystems Biology program under grant
reduce economic and ecological impacts from aquatic IAS. Whilst costs of            1834548. DR thanks InEE-CNRS who supports the French national
aquatic IAS are escalating, knowledge of impacts across major taxonomic             network Biological Invasions (Groupement de Recherche InvaBio,
groupings, geographic regions and habitat types remains diffuse. These              2014–2022).
knowledge gaps suggest costs of aquatic IAS are underestimated, partic-
ularly relative to their ecological impacts and to the more intensively-            Appendix A. Supplementary material
studied terrestrial species. Equally, geographical biases in reported
costs highlight the need for increased and improved cost reporting,                     Underlying data are publicly available in an online repository
given that allocation of finite resources to manage IAS is underpinned               (https://doi.org/10.6084/m9.figshare.12668570). The dataset used for
by adequate understandings of costs. We urge our results to be applied              analysis is provided in the Supplementary Material. Supplementary
as an incentive for managers, stakeholders and scientists to increase               data to this article can be found online at doi:https://doi.org/10.1016/j.
and improve cost reporting and invest in a more adequate protection                 scitotenv.2021.145238.
of aquatic ecosystems.
                                                                                    References
CRediT authorship contribution statement
                                                                                    Ahmed, D.A., Petrovskii, S.V., 2019. Analysing the impact of trap shape and movement be-
                                                                                        haviour of ground-dwelling arthropods on trap efficiency. Methods Ecol. Evol. 10,
    Ross N. Cuthbert: Conceptualization, Data curation, Formal analysis,                1246–1264.
Visualization, Writing - original draft, Writing - review & editing. Zarah          Aldridge, D.C., Oreska, M.P.J., 2011. Estimating the financial costs of freshwater invasive
                                                                                        species in Great Britain: a standardized approach to invasive species costing. Biol. In-
Pattison: Conceptualization, Data curation, Writing - review & editing.
                                                                                        vasions 13, 305–319.
Nigel G. Taylor: Conceptualization, Data curation, Writing - review &               Aloo, P.A., Njiru, J., Balirwa, J.S., Nyamweya, C.S., 2017. Impacts of Nile perch, Lates
editing. Laura Verbrugge: Conceptualization, Data curation, Writing -                   niloticus, introduction on the ecology, economy and conservation of Lake Victoria,
review & editing. Christophe Diagne: Conceptualization, Data curation,                  East Africa. Lakes Reserv. Res. Manag. 22, 320–333.
                                                                                    Angulo, E., Diagne, C., Ballesteros-Mejia, L., Akulov, E.N., Dia, C.A.K.M., Adamjy, T., et al.,
Writing - review & editing. Danish A. Ahmed: Conceptualization,                         2021. Non-English languages enrich scientific data: the example of the costs of bio-
Formal analysis, Visualization, Writing - review & editing. Boris                       logical invasions. Sci. Total Environ. (in press).
Leroy: Conceptualization, Data curation, Formal analysis, Visualiza-                Appleton, C.C., Forbes, A.T., Demetriades, N.T., 2009. The occurrence, bionomics and po-
                                                                                        tential impacts of the invasive freshwater snail Tarebia granifera (Lamarck, 1822) in
tion, Writing - review & editing. Elena Angulo: Conceptualization,
                                                                                        South Africa. Zoölogische Medelingen 83, 525–536.
Data curation, Writing – review & editing. Elizabeta Briski: Conceptu-              Balmford, A., Gravestock, P., Hockley, N., McClean, C.J., Roberts, C.M., 2004. The worldwide
alization, Writing - review & editing. César Capinha: Conceptualization,                costs of marine protected areas. Proc. Natl. Acad. Sci. 101, 9694–9697.
Writing - review & editing. Jane A. Catford: Conceptualization, Writing -           Blackburn, T.M., Bellard, C., Ricciardi, A., 2019. Alien versus native species as drivers of re-
                                                                                        cent extinctions. Front. Ecol. Environ. 17, 203–207.
review & editing. Tatenda Dalu: Conceptualization, Writing - review &
                                                                                    Bradshaw, C.J., Leroy, B., Bellard, C., Roiz, D., Albert, C., et al., 2016. Massive yet grossly
editing. Franz Essl: Conceptualization, Writing - review & editing.                     underestimated global costs of invasive insects. Nat. Commun. 7, 12986.
Rodolphe E. Gozlan: Conceptualization, Writing - review & editing.                  Bueno, C.C., Almeida, P.R., Retamero, A., Clark, L.G., 2017. Aedes aegypti: economic impact
Phillip J. Haubrock: Conceptualization, Writing - review & editing. Melina              of prevention versus palliation of diseases caused by the mosquito. Value Health 20,
                                                                                        A929.
Kourantidou: Conceptualization, Writing - review & editing. Andrew M.               Campbell-Lendrum, D., Manga, L., Bagayoko, M., Sommerfeld, J., 2015. Climate change and
Kramer: Conceptualization, Formal analysis, Visualization, Writing -                    vector-borne diseases: what are the implications for public health research and pol-
review & editing. David Renault: Conceptualization, Data curation,                      icy? Philos. Trans. R. Soc. B 370, 20130552.
                                                                                    Capinha, C., Essl, F., Seebens, H., Moser, D., Pereira, H.M., 2015. The dispersal of alien spe-
Writing - review & editing. Ryan J. Wasserman: Conceptualization,
                                                                                        cies redefines biogeography in the Anthropocene. Science 348, 1248–1251.
Writing - review & editing. Franck Courchamp: Conceptualization, Data               Cardano, J.A., Villamil-Gómez, W.E., Jimenez-Canizales, C.E., Castañeda-Hernández, D.M.,
curation, Writing - review & editing.                                                   Rodríguez-Morales, A.J., 2015. Estimating the burden of disease and the economic

                                                                                9
R.N. Cuthbert, Z. Pattison, N.G. Taylor et al. Science of the Total Environment 775 (2021) 145238
cost attributable to chikungunya, Colombia, 2014. Tropical Medicine and Hygiene McGeoch, M.A., Genovesi, P., Bellingham, P.J., Costello, M.J., McGrannachan, C., et al., 2015.
109, 793–802. Prioritizing species, pathways, and sites to achieve conservation targets for biological
Claeys-Mekdade, C., Morales, A., 2002. Moustiques et démoustication: une enquête invasion. Biol. Invasions 18, 299–314.
sociologique auprès des Arlésiens et des Camarguais. Rapport final de l'Etude Menge, B.A., Chan, F., Dudas, S., Eerkes-Medrano, D., Grorud-Colvert, K., et al., 2009. Ter-
d'impact d'un éventuel traitement au B.t.i. sur le territoire du Parc naturel régional restrial ecologists ignore aquatic literature: asymmetry in citation breadth in ecolog-
de Camargue. DESMID-IMEP. ical publications and implications for generality and progress in ecology. J. Exp. Mar.
Crystal-Ornelas, R., Lockwood, J.L., 2020. The ‘known unknowns’ of invasive species im- Biol. Ecol. 377, 93–100.
pact measurement. Biol. Invasions 22, 1513–1525. Mollot, G., Pantel, J.H., Romanuk, T.N., 2017. Chapter two - the effects of invasive species
Cuthbert, R.N., Callaghan, A., Dick, J.T.A., 2019. A novel metric reveals biotic resistance po- on the decline in species richness: a global meta-analysis. Adv. Ecol. Res. 56, 61–83.
tential and informs predictions of invasion success. Sci. Rep. 9, 15314. Paini, D.R., Sheppard, A.W., Cook, D.C., De Barro, P.J., Worner, S.P., et al., 2016. Global threat
Cuthbert, R.N., Kotronaki, S.G., Dick, J.T.A., Briski, E., 2020. Salinity tolerance and geo- to agriculture from invasive species. Proc. Natl. Acad. Sci. 113, 7575–7579.
graphic origin predict global alien amphipod invasions. Biol. Lett. 16, 20200354. Panzacchi, M., Cocchi, R., Genovesi, P., Bertolini, S., 2007. Population control of coypu
Cuthbert, R.N., Bartlett, A.C., Turbelin, A., Haubrock, P.J., Diagne, C., et al., 2021. Economic Myocastor coypus in Italy compared to eradication in UK: a cost-benefit analysis.
costs of biological invasions in the United Kingdom. NeoBiota (in press). Wildl. Biol. 13, 159–171.
Darwall, W., Bremerich, V., De Wever, A., Dell, A.I., Freyhof, J., et al., 2018. The Alliance for Pejchar, L., Mooney, H.A., 2009. Invasive species, ecosystem services and human well-
Freshwater Life: a global call to unite efforts for freshwater biodiversity science and being. Trends Ecol. Evol. 24, 497–504.
conservation. Aquat. Conserv. Mar. Freshwat. Ecosyst. 28, 1015–1022. Pimentel, D., Lach, L., Zuniga, R., Morrison, D., 2000. Environmental and economic costs of
Diagne, C., Catford, J.A., Essl, F., Nuñez, M.A., Courchamp, F., 2020a. What are the economic nonindigenous species in the United States. BioScience 50, 53–66.
costs of biological invasions? A complex topic requiring international and interdisci- Pimentel, D., Zuniga, R., Morrison, D., 2005. Update on the environmental and economic costs
plinary expertise. NeoBiota 63, 25–37. associated with alien-invasive species in the United States. Ecol. Econ. 52, 273–288.
Diagne, C., Leroy, B., Gozlan, R.E., Vaissiere, A.C., Assailly, C., et al., 2020b. InvaCost: a public Pintar, M.R., Bohenek, J.R., Eveland, L.L., Restarits Jr., W.J., 2018. Colonization across gradi-
database of the economic costs of biological invasions worldwide. Scientific Data 7, ents of risk and reward: nutrients and predators generate species-specific responses
277. among aquatic insects. Funct. Ecol. 32, 1589–1598.
Dick, J.T.A., Laverty, C., Lennon, J.J., Barrios-O’Neill, D., Mensink, P.J., et al., 2017. Invader Poulin, M., Natacha, F., Line, R., 2011. Restoration of pool margin communities in cutover
Relative Impact Potential: a new metric to understand and predict the ecological im- peatlands. Aquat. Bot. 94, 107–111.
pacts of existing, emerging and future invasive alien species. J. Appl. Ecol. 54, Pyšek, P., Richardson, D.M., Pergl, J., Jarošík, V., Weber, E., 2008. Geographical and taxo-
1259–1267. nomic biases in invasion ecology. Trends Ecol. Evol. 23, 237–244.
Early, R., Bradley, B., Dukes, J., Lawler, J.J., Olden, J.D., et al., 2016. Global threats from inva- Pyšek, P., Hulme, P.E., Simberloff, D., Bacher, S., Blackburn, T.M., et al., 2020. Scientists’
sive alien species in the twenty-first century and national response capacities. Nat. warning on invasive alien species. Biol. Rev. 95, 1511–1534.
Commun. 7, 12485. R Core Team, 2020. R: A Language and Environment for Statistical Computing. R Founda-
Ellender, B.R., Weyl, O.L.F., 2014. A review of current knowledge, risk and ecological im- tion for Statistical Computing, Vienna.
pacts associated with non-native freshwater fish introductions in South Africa. Ricciardi, A., MacIsaac, H.J., 2011. Impacts of biological invasions on freshwater ecosys-
Aquat. Invasions 9, 117–132. tems. In: Richardson, D.M. (Ed.), Fifty Years of Invasion Ecology: The Legacy of Charles
Fournier, A., Penone, C., Pennino, M.G., Courchamp, F., 2019. Predicting future invaders Elton, 1st Wiley-Blackwell, Chichester.
and future invasions. Proc. Natl. Acad. Sci. 116, 7905–7910. Richardson, A.J., Poloczanska, E.S., 2008. Under-resourced, under threat. Science 320,
Gallardo, B., Clavero, M., Sánchez, M.I., Vilà, M., 2016. Global ecological impacts of invasive 1294–1295.
species in aquatic ecosystems. Glob. Chang. Biol. 22, 151–163. Robinson, T.B., Peters, K., Brooker, B., 2020. Coastal invasions: The South African context.
Hanley, N., Roberts, M., 2019. The economic benefits of invasive species management. In: van Wilgen, B.W., Measey, J., Richardson, D.M., Wilson, J.R., Zengeya, T.A. (Eds.), Bi-
People and Nature 1, 124–137. ological Invasions in South Africa. Springer, Berlin.
Harris, C.K., Wiley, D.S., Wilson, D.C., 1995. Socioeconomic impacts of introduced species Rodríguez, P.C., Galera-Galvez, K., Yescas, J.G.L., Rueda-Gallardo, J.A., 2015. Costs of dengue
in Lake Victoria fisheries. In: Pitcher, T.J., Hart, P.J.B. (Eds.), Impact of Species Changes to the health system and individuals in Colombia from 2010 to 2012. Am. J. Trop.
in African Lakes. Chapman and Hall, London. Med. Hyg. 9, 709–714.
Haubrock, P.J., Turbelin, A.J., Cuthbert, R.N., Novoa, A., Angulo, E., et al., 2021. Economic Sandodden, R., Johnsen, S.I., 2010. Eradication of introduced signal crayfish Pasifastacus
costs of invasive alien species across Europe. NeoBiota (in press). leniusculus using the pharmaceutical BETAMAX VET.®. Aquat. Invasions 5, 75–81.
Iwamura, T., Guzman-Holst, A., Murray, K.A., 2020. Accelerating invasion potential of dis- Seebens, H., Blackburn, T.M., Dyer, E.E., Genovesi, P., Hulme, P.E., et al., 2017. No saturation
ease vector Aedes aegypti under climate change. Nat. Commun. 11, 2130. in the accumulation of alien species worldwide. Nat. Commun. 8, 14435.
Jackson, M.C., Wasserman, R.J., Grey, J., Ricciardi, A., Dick, J.T.A., et al., 2017. Novel and Seebens, H., Blackburn, T.M., Dyer, E.E., Genovesi, P., Hulme, P.E., et al., 2018. Global rise in
disrupted trophic links following invasion in freshwater ecosystems. Adv. Ecol. Res. emerging alien species results from increased accessibility of new source pools. Proc.
57, 55–97. Natl. Acad. Sci. 115, E2264–E2273.
Katsanevakis, S., Wallentinus, I., Zenetos, A., Leppäkoski, E., Çinar, M.E., et al., 2014. Im- Seebens, H., Bacher, S., Blackburn, T.M., Capinha, C., Dawson, W., et al., 2020. Projecting the
pacts of invasive alien marine species on ecosystem services and biodiversity: a continental accumulation of alien species through to 2050. Glob. Chang. Biol. (in press).
pan-European review. Aquat. Invasions 9, 391–423. Shabani, F., Ahmadi, M., Kumar, L., Sohljouy-fard, S., Tehrany, M.S., et al., 2020. Invasive
Kettunen, M., Genovesi, P., Gollasch, S., Pagad, S., Starfinger, U., et al., 2009. Technical Sup- weed species’ threats to global biodiversity: future scenarios of changes in the num-
port to EU Strategy on Invasive Alien Species (IAS). Institute for European Environ- ber of invasive species in a changing climate. Ecol. Indic. 116, 106436.
mental Policy (IEEP), Brussels, p. 44. Sousa, R., Novais, A., Costa, R., Strayer, D.L., 2014. Invasive bivalves in fresh waters: im-
Kilpatrick, A.M., Randolph, S.E., 2012. Drivers, dynamics, and control of emerging vector- pacts from individuals to ecosystems and possible control strategies. Hydrobiologia
borne zoonotic diseases. Lancet 380, 1946–1955. 735, 233–251.
van Kleunen, M., Xu, X., Yang, Q., Maurel, N., Zhang, Z., et al., 2020. Economic use of plants Spatz, D.R., Zilliacus, K.M., Holmes, N.D., Butchart, S.H.M., Genovesi, P., et al., 2017. Glob-
is key to their naturalization success. Nat. Commun. 11, 3201. ally threatened vertebrates on islands with invasive species. Sci. Adv. 3, e1603080.
Kourantidou, M., Cuthbert, R.N., Haubrock, P.J., Novoa, A., Taylor, N.G., et al., 2021. Eco- Strayer, D.L., Findlay, S.E., 2010. Ecology of freshwater shore zones. Aquat. Sci. 72,
nomic costs of invasive alien species in the Mediterranean basin. NeoBiota (in press). 127–163.
Kumschick, S., Gaertner, M., Vilà, M., Essl, F., Jeschke, J.M., et al., 2015. Ecological impacts Turbelin, A.J., Malamud, B.D., Francis, R.A., 2017. Mapping the global state of invasive alien
of alien species: quantification, scope, caveats, and recommendations. BioScience 65, species: patterns of invasion and policy responses. Glob. Ecol. Biogeogr. 26, 78–92.
55–63. UNEP, 2011. The Strategic Plan for Biodiversity 2011–2020 and the Aichi Biodiversity Tar-
Kwena, Z.A., Bukusi, E., Omondi, E., Ng’ayo, M., Holmes, K.K., 2012. Transactional sex in the gets. COP CBD Tenth Meeting UNEP/CBD/COP/DEC/X/2. Nagoya.
fishing communities along Lake Victoria, Kenya: a catalyst for the spread of HIV. Afr. Vanbergen, A.J., the Insect Pollinators Initiative, 2013. Threats to an ecosystem service:
J. AIDS Res. 11, 9–15. pressures on pollinators. Front. Ecol. Environ. 11, 251–259.
Leigh, P., 1998. Benefits and costs of the ruffe control program for the Great Lakes fishery. Vitousek, P.M., D’antonio, C.M., Loope, L.L., Rejmanek, M., Westbrooks, R., 1997. Intro-
J. Great Lakes Res. 24, 351–360. duced species: a significant component of human-caused global change. N. Z.
Leroy, B., Kramer, A., Vaissière, A.-C., Courchamp, F., Diagne, C., 2020. Analysing global J. Ecol. 21, 1–16.
economic costs of invasive alien species with the invacost R package. biorXiv Walsh, J.R., Carpenter, S.R., Zanden, M.J.V., 2016. Invasive species triggers a massive loss of
https://doi.org/10.1101/2020.12.10.419432. ecosystem services through a trophic cascade. Proc. Natl. Acad. Sci. 113, 4081–4085.
Leung, B., Lodge, D.M., Finnoff, D., Shogren, J.F., Lewis, M.A., et al., 2002. An ounce of pre- Weyl, O.L.F., Ellender, B.R., Wasserman, R.J., Truter, M., Dalu, T., et al., 2020. Alien Freshwa-
vention or a pound of cure: bioeconomic risk analysis of invasive species. Proc. R. Soc. ter Fauna in South Africa. In: van Wilgen, B.W., Measey, J., Richardson, D.M., Wilson,
B Biol. Sci. 269, 2407–2413. J.R., Zengeya, T.A. (Eds.), Biological Invasions in South Africa. Springer, Berlin.
Lin, Y.P., Gao, Z.X., Zhan, A.B., 2015. Introduction and use of nonnative species for aquacul- van Wilgen, B., Measey, J., Richardon, D.M., Wilson, J.R., Zengeya, T.A., 2020. Biological In-
ture in China: status, risks and management solutions. Rev. Aquac. 7, 28–58. vasions in South Africa. Springer, Berlin.
Lovell, S.J., Stone, S.F., Fernandez, L., 2006. The economic impacts of aquatic invasive spe- Williams, F., Eschen, R., Harris, A., Djeddour, D., Pratt, C., et al., 2010. The Economic Cost of
cies: a review of the literature. Agricultural and Resource Economics Review 35, Invasive Non-native Species to Great Britain. CABI, Egham, Egham.
195–208. Woodward, G., Perkins, D.M., Brown, L.E., 2010. Climate change and freshwater ecosys-
Madzivanzira, T.C., South, J., Wood, L.E., Nunes, A.L., Weyl, O.L.F., 2020. A review of fresh- tems: impacts across multiple levels of organization. Philosophical Transactions of
water crayfish introductions in Africa. Reviews in Fisheries Science and Aquaculture. the Royal Society B: Biological Sciences 365, 2093–2106.
(in press). Yokomizo, H., Possingham, H., Thomas, M., Buckley, Y., 2009. Managing the impact of in-
McGeoch, M.A., Jetz, W., 2019. Measure and reduce the harm caused by biological inva- vasive species: the value of knowing the density-impact curve. Ecol. Appl. 19,
sions. One Earth 1, 171–174. 376–386.
10You can also read