Sea Level Rise and Flood Risk Assessment for a Select Disaster Prone Area Along the Western Cape Coast Phase B: Overberg District Municipality ...
←
→
Page content transcription
If your browser does not render page correctly, please read the page content below
Department of Environmental Affairs
      and Development Planning

    Sea Level Rise and Flood Risk
Assessment for a Select Disaster Prone
 Area Along the Western Cape Coast
Phase B: Overberg District Municipality

 Phase 3 Report: Overberg District
Municipality Sea Level Rise and Flood
      Hazard Risk Assessment

                 Final

              March 2012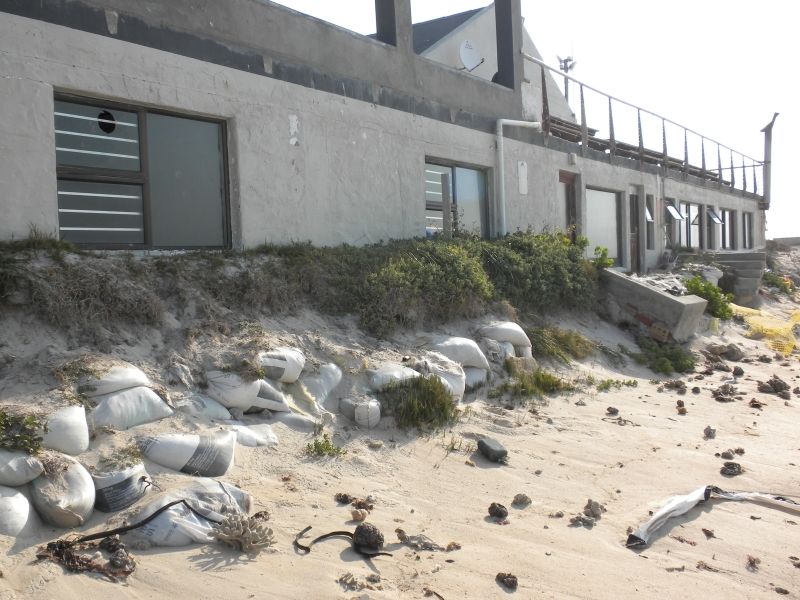
REPORT TITLE                            :          Phase 3 Report: Overberg District
                                                   Municipality Sea Level Rise and Flood
                                                   Hazard Risk Assessment

CLIENT                                  :          Provincial Government of the Western
                                                   Cape Department of Environmental
                                                   Affairs and Development Planning:
                                                   Strategic Environmental Management

PROJECT                                 :          Sea Level Rise and Flood Risk
                                                   Assessment for a Select Disaster Prone
                                                   Area Along the Western Cape Coast.
                                                   Phase B: Overberg District Municipality

AUTHORS                                 :          D. Blake

                                        :
REPORT STATUS                                      Final

REPORT NUMBER                           :          790/3/2/2012

DATE                                    :          March 2012

APPROVED BY                             :

S. Imrie                                           D. Blake
Project Manager                                    Task Leader

This report is to be referred to in bibliographies as:

Department of Environmental Affairs and Development Planning. (2011). Sea Level Rise and
Flood Risk Assessment for a Select Disaster Prone Area Along the Western Cape Coast.
Phase B: Overberg District Municipality. Phase 3 Report: Overberg District Municipality Sea
Level Rise and Flood Hazard Risk Assessment. Prepared by Umvoto Africa (Pty) Ltd for the
Provincial Government of the Western Cape Department of Environmental Affairs and
Development Planning: Strategic Environmental Management (March 2012).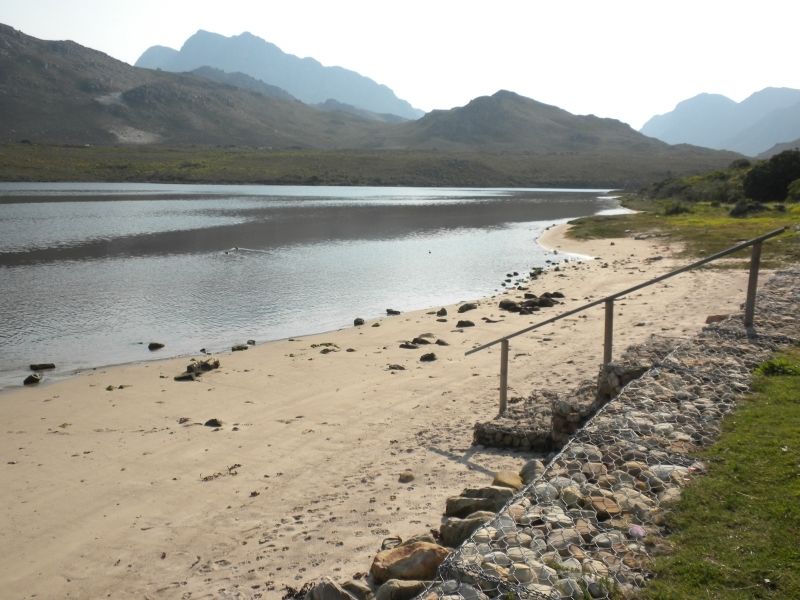
Phase 3: Overberg DM Sea Level Rise and Flood Hazard Risk Assessment 2012

                              EXECUTIVE SUMMARY

INTRODUCTION

Umvoto Africa (Pty) Ltd was appointed by the Western Cape Department of Environmental
Affairs and Development Planning (DEA&DP) to undertake a sea level rise and flood risk
assessment for a select disaster prone area along the Western Cape coast. The Phase B
assessment area was defined as the Western Cape coastline within the Overberg District
Municipality (DM), from Blousteen at Kogel Bay (at the boundary of the City of Cape Town)
to Infanta near the Breede River mouth (at the district municipal boundary with the Eden
DM). The Western Cape DEA&DP required that a literature assessment of current global
and local understanding and knowledge with regards to climate change and sea level rise be
undertaken, in association with the development of a sea level rise and flood inundation
Geographic Information System (GIS) model for this project. Umvoto Africa proposed a
three-phase work approach, namely: Phase 1 – Inception and Data Acquisition, Phase 2 –
GIS Model Development, and Phase 3 – Risk Assessment. This report describes the coastal
hazard risk assessment undertaken during Phase 3.

COASTAL HAZARD RISK ASSESSMENT METHODOLOGY

For this study, the Overberg DM coastline was subdivided into 24 sections, termed Coastal
Zone Management Units (CZMUs). The risk of each CZMU to three coastal hazards was
qualitatively assessed using a modified version of the rapid risk assessment methodology
described in Blake and Hartnady (2009). The three coastal hazard types that were selected
in order to undertake the West Coast DM coastal risk assessment were sea level rise
induced coastal erosion and inundation, groundwater contamination from saltwater intrusion
(as a result of sea level rise) and extreme coastal events (storm surges, estuarine flooding
and tsunamis).

The risk of each CZMU to each specific hazard can be determined by using the classic risk
equation, where Risk (R) = (Hazard (H) x Vulnerability (V)) / Coping Capacity (C). Hazard,
vulnerability and coping capacity were in turn scored from 1 to 5 (with 1 representing very
low and 5 representing very high) for each CZMU for each hazard, allowing the risk to be
calculated.

Hazard scores for each CZMU were calculated by determining the severity and probability of
each specific hazard. Severity and hazard were both given a score out of 5 based. The
equation Hazard (H) = (Probability (P) + Severity (S)) / 2 was then used to calculate a final
hazard score out of 5.

Vulnerability (V) was divided into three types, namely social (So), environmental (En) and
economic (Ec) vulnerability. Social vulnerability was based on the possible amount of human
deaths, economic vulnerability on the total approximate economic cost in Rands, and
environmental vulnerability on the possible environmental damage to a specific ecosystem
(i.e. whether sensitive/protected or not) that may result from a specified hazard or disaster.
Each vulnerability type was scored out of 5 based on the variables, and a final vulnerability
score was calculated using the equation V = (En + Ec + So) / 3.

Coping capacity defines the resilience a community or area has to a disaster i.e. to what
extent will a community be affected by and how long it will take to recover from a disaster.
Each CZMU was given a coping capacity score for each hazard, based on the
implementation of the various stages of the Hyogo Framework for Action (HFA): Priorities for
Action. The HFA priority areas strive to reduce the impact of disasters through gender
sensitive disaster preparedness and risk reduction i.e. by increasing the coping capacity.
Executive Summary                                                                       Page i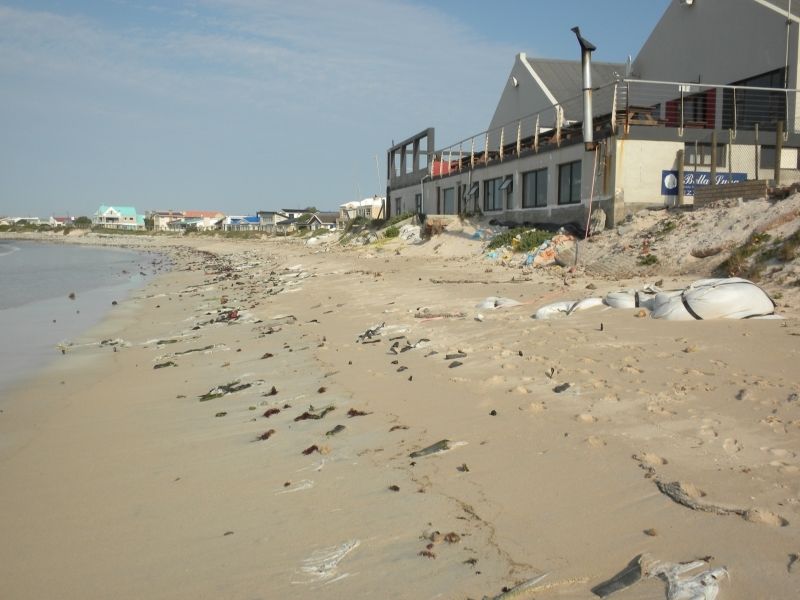
Phase 3: Overberg DM Sea Level Rise and Flood Hazard Risk Assessment 2012

Each HFA priority area was given a score out of 5, depending on whether there was none to
very limited implementation (1), limited implementation (2), partially implemented (3), mainly
implemented (4) and fully implemented (5). The final coping capacity was then calculated
using the equation: C = (HFA1 + HFA2 + HFA3 + HFA4 + HFA5) / 5.

Full implementation of all the HFA priority areas will result in a CZMU having a high coping
capacity, ensuring that it is able to deal with coastal disasters. Little to no implementation of
the HFA priority areas will result in coastal communities within the CZMU being highly
affected by and taking a long period of time to recover from coastal disasters. The CZMUs
along the Overberg DM coastline have low coping capacities, due to minor implementation of
the HFA priority areas. HFA1 is the highest scoring priority area, due to the development of
national, provincial, and in some cases local coastal legislation, policies and frameworks to
deal with ICZM and coastal hazards. Little to no implementation of HFAs 2 to 5 has occurred
across the entire Overberg DM coastline however.

The risk equation of R = H x V / C shows that coping capacity has a significant influence on
the final risk assessment, and hence the importance in developing coping capacity
mechanisms to deal with disasters in order to reduce the final risk e.g. even if a specific
CZMU had the highest H x V ranking possible of 25, a coping capacity of 5 (i.e. full
implementation of all five HFA priority areas) would reduce the risk of the CZMU to that
hazard or possible disaster to 5 (moderate risk). The benefit of strong coping capacity is
highlighted with regards to possible groundwater contamination at Hermanus, where strong
monitoring systems and public awareness/participation have reduced the risk of saltwater
intrusion.

COASTAL HAZARD RISK ASSESSMENT RESULTS

The majority of the Overberg DM CZMUs are at a low risk to sea level rise induced coastal
erosion and inundation (58% of total CZMUs), with the remaining CZMUs at moderate risk
(predominantly the stretch from Pearly Beach to De Hoop Vlei). The regions most at risk
(although still at moderate risk) include sandy coastal sections linked with larger estuaries
(Bot River, Klein River and Walker Bay CZMUs), and the coastal stretch between Pearly
Beach and De Hoop Vlei (with the exception of rockier coastal areas at Aasvontein and
Ryspunt). The areas of low risk reflect moderate to high gradient coastal areas, often with
rocky coastlines or high backing coastal dune systems, with relatively little development in
lower elevation areas or within the coastal foredune. Areas of moderate risk in turn reflect
relatively low gradient coastal areas, often with extensive beaches or large estuaries, in
association with areas of development (or possible future development) close to the
shoreline.

The majority of the Overberg CZMUs are at a low risk to groundwater contamination from
salt water intrusion related to sea level rise (58% of total CZMUs), with the exception being
the Overstrand (Vermont to Kleinbaai, moderate risk) and Cape Agulhas/Struisbaai regions
(moderate to high risk). The at risk areas of the Overberg DM are comprised of hydraulically
conductive and therefore vulnerable primary (Bredasdorp Group) and fractured quartzitic
(Peninsula and Skurweberg Formation) aquifers, which are used to a large extent for
groundwater supply in towns such as Hermanus and Struisbaai. Vulnerability and risk may
increase over time, due to possible future potable water shortages in the area as a result of
climate change, and the associated increased exploitation of groundwater resources. The
introduction of real time telemetry monitoring, in association with aquifer wellfield modelling
and regional ecological and groundwater monitoring, can reduce the risk of over abstraction
and salt water intrusion, as evidenced by the monitor-model-manage approach employed in
Hermanus for the abstraction of groundwater from the coastal Peninsula Formation aquifer.

Executive Summary                                                                         Page ii
Phase 3: Overberg DM Sea Level Rise and Flood Hazard Risk Assessment 2012
The majority of the Overberg DM CZMUs are at a low (46% of total CZMUs) to moderate
(50% of total CZMUs) risk from extreme coastal events such as large storm surges and
tsunamis. The regions at most risk include the relatively low gradient sandy and rocky
coastal sections of Struisbaai (focused wave energy north of the harbour), Quoin Point
(direct exposure of the fishing community of Buffeljagsbaai to large swell), Cape Agulhas and
Vermont-Sandbaai (large proportion of shore fronting properties close to the high water
mark), Klein River and Bot River (estuarine systems prone to flooding). The areas of low to
moderate risk reflect moderate to high gradient coastal areas, often with rocky coastlines or
high backing coastal dune systems, with relatively little development in lower elevation areas
or within the coastal foredune e.g. Kleinmond, Hermanus and Gansbaai, where development
is well above the 10 mamsl contour.
The coastal risk hazard assessment for the Overberg DM identifies six CZMUs that have an
average risk score of greater than 3.5. These CZMUS are Struisbaai, Cape Agulhas, Quoin
Point, Pearly Beach, Vermont-Sandbaai and Klein River.
SEA LEVEL RISE ADAPTATION
There are three different options for sea level rise adaptation, namely:
Protection – protect the coastline from sea level rise by structures;
Managed retreat – retreat from or reduce development in coastal areas; and
Accommodation – modify land use and infrastructure to accommodate coastal
hazards.
The best option for South African and Overberg DM managers (especially with regards to
any possible future development of currently pristine sandy or low relief rocky coastal
sections along the Overberg DM e.g. westwards of Pearly Bay and northeastwards of
Struisbaai) is the “no-regrets” approach, as recommended to the City of Cape Town with
regards to sea level rise. This involves a collective response, from both municipalities and
local residents, where long term institutional, accommodation, retreat and soft protective
approaches are undertaken to understand and manage long term coastal evolution, instead
of haphazard, reactive hard protective approaches to specific extreme events. The no-
regrets approach, which should be undertaken even if sea level rise does not occur as it
forms good coastal management practice, includes:
no further land reclamation;
the development and management of healthy natural systems, i.e. the conservation
and rehabilitation of wetlands, estuaries, kelp beds, dune cordons etc.;
decentralisation of strategic infrastructure, in order to ensure sea level rise does not
affect large areas;
maintenance of current sea walls, dolosse etc., but no development of new hard
protective structures, with other adaptation options being preferred;
insurance market correction i.e. incorporate sea level rise into long term economical
risk assessments (which isn’t currently done), which will increase coastal premiums
and affect current coastal land owners in the short term, but will prevent further future
excessive coastal development and reduce future liabilities;
Executive Summary Page iii
Phase 3: Overberg DM Sea Level Rise and Flood Hazard Risk Assessment 2012
develop coastal management capacity in municipalities and other local, regional and
national institutions;
build disaster management capabilities and incorporate the HFA priority areas into all
future coastal planning and disaster management activities;
public (community and individual) and private (businesses and industry) coastal
education drive in order to build an accountable and responsible coastal community,
as well as increasing the resilience of coastal communities through poverty
alleviation; and
undertaking of detailed risk assessments, development of sustainable coastal
management plans (SCMPs), and the development of basic early warning systems
e.g. combination of tidal information and storm forecasts to determine if there is an
extreme storm surge hazard a few days prior to an actual event.
RECOMMENDATIONS
It is recommended that:
Overberg District Municipality level:
o Employ the “no-regrets” approach in an ICZM framework along the Overberg
DM coastline.
o The HFA Priorities for Action are integrated into all phases of planning, and
disaster risk reduction is made a necessity in municipal structures (if not
already incorporated in line with the Disaster Management Act (Act 57 of
2002)), especially with respect to coastal zone hazards.
o CZMSs are developed for all the LMs of the Overberg DM.
o CZMUs are identified and delineated for each LM (using the initial CZMUs
defined here as a working template if desired).
o SCMPs, such as the Kogelberg Coast Integrated Management Plan, should
be developed for each CZMU, with the six highest risk CZMUs identified in the
risk assessment (Struisbaai, Cape Agulhas, Quoin Point, Pearly Beach,
Vermont-Sandbaai and Klein River) receiving the highest priority.
o Aquifer monitoring systems, similar to that employed in Hermanus, are
initiated in the Cape Agulhas/Struisbaai area.
o Detailed adaptation studies on each high risk CZMU are conducted, in order
to determine which best combination of methodologies should be developed
to adapt to sea level rise induced hazards.
Conceptual studies:
o Begin to undertake architectural research into alternative housing technology
e.g. lift houses, used in the Netherlands, Germany and flood prone areas of
the United States of America. These new housing technologies take into
account rising water levels due to storm surges or floods, and can be used in
developed estuary zones along the Bot, Klein and Uilkraals River estuaries.
Executive Summary Page ivPhase 3: Overberg DM Sea Level Rise and Flood Hazard Risk Assessment 2012
TABLE OF CONTENTS
Chapter Description Page
1. INTRODUCTION 1
1.1 Scope of work 1
1.2 Global and regional sea level rise 2
2. COASTAL HAZARD RISK ASSESSMENT METHODOLOGY 4
2.1 Coastal Zone Management Units 4
2.2 Hazard 4
2.3 Vulnerability 8
2.4 Coping capacity 8
2.5 Risk 11
3. COASTAL HAZARD RISK ASSESSMENT RESULTS 12
3.1 Sea level rise induced coastal erosion and inundation 12
3.2 Groundwater contamination 12
3.3 Extreme events 12
4. SEA LEVEL RISE ADAPTATION 19
5. RECOMMENDATIONS 23
6. REFERENCES 24
Table of Contents Page iPhase 3: Overberg DM Sea Level Rise and Flood Hazard Risk Assessment 2012
LIST OF FIGURES
Figure 2-1 Initial delineated CZMUs for the Overberg DM (refer to Table 2-1 for CZMU names). 6
Figure 3-1 Risk assessment for the Overberg DM with respects to coastal erosion/inundation. 15
Figure 3-2 Risk assessment for the Overberg DM with respects to groundwater contamination. 16
Figure 3-3 Risk assessment for the Overberg DM with respects to extreme events. 17
Figure 4-1 Gabion structure at the edge of the Palmiet Caravan Park, Palmiet River estuary. 19
Figure 4-2 Use of normal fabric (instead of geofabric) bags filled with sediment at Struisbaai. 20
LIST OF TABLES
Table 2-1 Initial delineated CZMUs for the Overberg DM. 5
Table 2-2 Hazard scoring methodology for each hazard. 7
Table 2-3 Vulnerability scoring methodology. 8
Table 2-4 Key indicators for assessing coping capacity based on the HFA priority areas. 9
Table 2-5 Risk scoring methodology. 11
Table 2-6 Qualitative risk assessment, based on H x V / C equation. 11
Table 3-1 Number/percent of risk ranked CZMUs per coastal hazard. 13
Table 3-2 Risk assessment for the Overberg DM with respects to coastal erosion/inundation. 13
Table 3-3 Risk assessment for the Overberg DM with respects to groundwater contamination. 14
Table 3-4 Risk assessment for the Overberg DM with respects to extreme events. 14
Table 3-5 Summarised coastal hazard risk assessment scores and highest risk CZMUs. 18
Table of Contents Page iiPhase 3: Overberg DM Sea Level Rise and Flood Hazard Risk Assessment 2012
LIST OF ABBREVIATIONS
% - percent
~ - approximately
AR4 - Fourth Assessment Report
C - coping capacity
cm - centimetre
CCRC - Climate Change Research Centre
CZMS - coastal zone management strategy
CZMU - Coastal Zone Management Unit
DM - District Municipality
DRR - disaster risk reduction
DP&R - disaster preparedness and response
DEA&DP - Department of Environmental Affairs and Development Planning
Ec - economic vulnerability
En - environmental vulnerability
e.g. - for example
etc. - etcetera
et al. - as well as
GIS - Geographic Information System
H - hazard
HAT - Highest Astronomical Tide
HFA - Hyogo Framework for Action
i.e. - that is
ICZM - Integrated Coastal Zone Management
IPCC - Intergovernmental Panel on Climate Change
km - kilometre
KZN - KwaZulu-Natal
LM - Local Municipality
m - metre
mm - millimeter
mamsl - metres above mean sea level
No. - number
P - probability
R - Rand
R - risk
RA - risk assessment
S - severity
So - social vulnerability
SLR - sea level rise
SCMP - sustainable coastal management plan
UNSW - University of New South Wales
UN/ISDR - United Nations International Strategy for Disaster Reduction
V - vulnerability
WBGU - German Advisory Council on Global Change
Table of Contents Page iiiPhase 3: Overberg DM Sea Level Rise and Flood Hazard Risk Assessment 2012
1. INTRODUCTION
1.1 SCOPE OF WORK
Umvoto Africa (Pty) Ltd was appointed by the Western Cape Department of Environmental
Affairs and Development Planning (DEA&DP) to undertake a sea level rise and flood risk
assessment for a select disaster prone area along the Western Cape coast. The
assessment area was defined as the Western Cape coastline within the Overberg District
Municipality (DM), from Blousteen at Kogel Bay (at the boundary of the City of Cape Town)
to Infanta near the Breede River mouth (at the district municipal boundary with the Eden
DM). This forms the second phase (in association with the West Coast DM, completed in
July 2011 – see DEA&DP, 2011a, 2011b and 2011c) of a sea level rise and flood risk
assessment for the Western Cape coastline (other than the City of Cape Town municipal
area), with the Eden DM being completed as part of the first phase in 2010 (DEA&DP,
2010a, 2010b and 2010c). This project is being done in association with a coastal setback
line study for the Overberg DM (see SSI, 2011), with the coastal setback line methodology
being established and tested in the City of Cape Town and Saldanha Bay Local Municipality
(LM) in 2010 (DEA&DP, 2010d and 2010e). Umvoto Africa proposed a three-phase work
approach, namely:
Phase 1 – Inception and Data Acquisition: Collection of GIS data to be used in the
development of the sea level rise and flood inundation model; collection and review of
literature on both the global and local aspects of climate and sea-level change, as well as all
national, provincial and local coastal legislation; and finalisation of the GIS and risk
assessment model methodologies to be used.
Phase 2 – GIS Model Development: Development of a sea level rise and flood inundation
model, based on specific sea level rise scenarios that were determined from literature.
Phase 3 – Risk Assessment: Undertaking of a coastal zone hazard risk assessment for
identified Coastal Zone Management Units (CZMUs) within the Overberg DM, based on a
refined rapid assessment methodology described by Blake and Hartnady (2009) and used in
the Eden DM and West Coast DM sea level rise risk assessment (DEA&DP, 2010c and
2011c).
This report describes the coastal hazard risk assessment undertaken during Phase 3.
Chapter 1 provides a brief overview of the literature review, and shoreline evolution, extreme
sea level and estuary flooding modelling conducted in the Phase 1 and 2 reports
respectively. Chapter 2 describes the methodology used to undertake the coastal hazard
risk assessment. The results from coastal hazard risk assessment are described in Chapter
3. Chapter 4 describes various adaptation methods that could be employed to reduce the
risk to sea level rise induced hazards, while Chapter 5 concludes this report and provides
recommendations.
The Phase 1 report details the literature and current understanding with regards to sea level
rise both globally and regionally along the South African coastline, as well as the different
sets of national, regional and local South African policies that have been developed to deal
with future climate change induced coastal hazards. The Phase 2 report describes the
shoreline evolution, extreme sea level and estuary flooding modelling that was undertaken
along the Overberg DM coastline.
Page 1Phase 3: Overberg DM Sea Level Rise and Flood Hazard Risk Assessment 2012
1.2 GLOBAL AND REGIONAL SEA LEVEL RISE
Due to the dynamic interaction of biophysical factors from both the Earth’s land surface and
ocean, and the high human population present, coastal areas are often at risk to natural and
human-induced hazards. One such hazard, which is focused on in this study, is climate
change induced sea level rise. Sea level rise causes shoreline retreat through coastal
erosion and dune migration, and coastal inundation and flooding through enhanced tidal
reaches and an increase in the of frequency of storm surges (whose intensity may also
increase as a result of climate change). Rising sea levels can also cause groundwater and
fresh coastal surface water contamination (with associated impacts on agriculture and
aquaculture due to the decrease in soil and water quality), the loss of cultural and
archaeological resources, and the possible destruction of important coastal habitats such
wetlands, mangroves, estuaries etc.
Long term projections from coupled climate models are still uncertain with respects to global
mean sea level rise and regional variations, due to the relatively unknown dynamic response
of ice sheets to climate change, and the affects of regional climate circulation models
(Cazenave et al., 2009). Tidal gauge and (since 1993) satellite altimetry measurements
have shown that sea level has risen 20 cm since 1870, with the rise during the 20 th century
being approximately 17 cm (University of New South Wales (UNSW) Climate Change
Research Centre (CCRC), 2009). This rise of ~ 1.7 mm/year is an order of magnitude
greater than sea level rise during the last 2000 years (Church et al., 2008). Satellite altimetry
measurements since 1993 have shown that sea level has risen by 3.4 mm/year since 1993.
Current future predictions taking into account new ice sheet understanding are twice the
range of the Intergovernmental Panel on Climate Change (IPCC) Fourth Assessment Report
(AR4) projections, with an upper limit of sea level rise of 2 m expected by 2100 (Rahmstorf,
2007, Vermeer and Rahmstorf, 2009 and the UNSW CCRC, 2009). Mather et al. (2009)
recently conducted the first detailed analysis of all tide gauge sites along the southern
African coastline. The analysis shows that over the past 50 years, both eustatic and regional
sea level rise along the southern African coastline has not been constant, varying between
0.42 and 1.87 mm/year (West Coast), 1.48 and 1.97 mm/year (South Coast) 3.55 and 2.74
mm/year (East Coast) respectively (Mather et al., 2009).
Sea level rise is often felt most not via the gradual advance of mean sea level, but by the
increased frequency of storms and associated storm surge with the higher tidal regime.
Higher sea levels cause an increase in the frequency of storm surge events due to the higher
sea base level, even if storm intensities themselves do not increase due to warming oceans
(Church et al., 2008) i.e. a storm surge event with a 1:100 year return period may start to
have a return period of 1:25 years due to smaller storms having the same effect on higher
sea levels. The combination of cut off and coastal low generated swell systems during
spring highs in February, March and September, and swell generated by winter cold fronts
are responsible for the present highest sea levels along the Overberg DM coastline. A
30-year storm of +39 cm on a Highest Astronomical Tide (HAT) for Simons Town of
1.24 metres above mean sea level (mamsl), which would be a 1:500 year event at present,
could turn into a 1:30 year event by the end of the next decade with an additional 15 cm of
sea level rise (Brundrit, 2008). The 19th and 20th March 2007 storm along the KwaZulu-Natal
(KZN) coastline provides a modern analogue for what damage such an event can cause. A
1:35 year wave height of 8.5 m and 1:100 year storm surge of +55 cm occurred on a tide of
1.33 mamsl, which was very close to HAT for Durban (HAT in turn occurred on the
21st March 2007) (Brundrit, 2008, Smith et al., 2007 and Smith et al., 2010). This
combination represented a 1:500 year extreme sea level event and caused R1 billion
damage (Mather, 2008 and Theron and Rossouw, 2008). 1:100 year flood lines from the sea
caused by possible extreme events (in association with climate change) of 4-10.8 mamsl
have been modelled for the proposed Bantamsklip Eskom Nuclear-1 site (between Pearly
Beach and Buffeljagsbaai), while a maximum water level caused by a combination of a
possible tsunami with storm surge, high tides and run-ups was modelled at 11 mamsl
Page 2Phase 3: Overberg DM Sea Level Rise and Flood Hazard Risk Assessment 2012 (Eskom Holdings Ltd, 2009a and 2009b). By 2100, extreme sea level events of this nature may occur every 2 weeks on spring highs with the combination of a small to moderate storm (Theron and Rossouw, 2008). Erosion modelling along the Bantamsklip coastline was also undertaken for up to 2100 (Eskom Holdings Ltd, 2009b and 2009c), with a sea level rise of 0.8 m modelled to cause 35 m of retreat and seasonal erosion 14 m of retreat, while storm events may cause ~75-85 m of lateral shoreline retreat (leading to a total retreat of between 90-135 m by 2100). These modelling trends at Bantamsklip of large storm erosion retreat in comparison to minor seasonal retreat can be confirmed by observations at Struisbaai, with only minor seasonal erosion (
Phase 3: Overberg DM Sea Level Rise and Flood Hazard Risk Assessment 2012
2. COASTAL HAZARD RISK ASSESSMENT METHODOLOGY
Rapid desktop risk assessments provide an excellent tool for identifying vulnerable and at
risk areas, and assisting the management of and adaptation to various hazards that these
areas may be subjected too. For this study, the Overberg DM coastline was subdivided into
24 sections, termed Coastal Zone Management Units (CZMUs). The risk of each CZMU to
three coastal hazards was qualitatively assessed using a modified version of the rapid risk
assessment methodology described in Blake and Hartnady (2009). The three coastal hazard
types that were selected in order to undertake the Overberg DM coastal risk assessment
were:
Sea level rise induced coastal erosion and inundation;
Groundwater contamination from saltwater intrusion (as a result of sea level rise); and
Extreme coastal events (storm surges, estuarine flooding and tsunamis).
The risk of each CZMU to each specific hazard can be determined by using the classic risk
equation, where Risk (R) = (Hazard (H) x Vulnerability (V)) / Coping Capacity (C). Hazard,
vulnerability and coping capacity were in turn scored from 1 to 5 (with 1 representing very
low and 5 representing very high) for each CZMU for each hazard, allowing the risk to be
calculated.
2.1 COASTAL ZONE MANAGEMENT UNITS
Integrated coastal zone management (ICZM) can often be complex, due to the various
coastal habitats and types that can occur along a single stretch of coastline. Specific coastal
units are therefore delineated in order to assist in ICZM, as well as to ensure that
management decisions taken at one section of coastline do not negatively affect another
section e.g. the building of a seawall in one coastal area may cause erosion further along the
coastline, if the coastal section occurs within the same sedimentary cell. The City of Cape
Town Coastal Zone Management Strategy (CZMS) (2003) delineated the coastline under its
jurisdiction into 43 sections, and termed them CZMUs. This delineation was based on
biophysical factors such as geology, geomorphology, habitat type, land use type e.g.
residential development, harbour, power station etc., and administrative features. These
same variables were used to delineate CZMUs for the individual LMs of the Overberg DM
(see Table 2-1 and Figure 2-1). The CZMUs defined here provide an initial, large-scale
coastal subdivision for each LM. As each LM develops its own CZMS, different CZMUs can
be delineated or defined according to that LM’s specific coastal management requirements.
2.2 HAZARD
Hazard scores for each CZMU were calculated by determining the severity and probability of
each specific hazard. Severity and hazard were both given a score out of 5 based on Table
2-2 below. The equation Hazard (H) = (Probability (P) + Severity (S)) / 2 was then used to
calculate a final hazard score out of 5.
For both sea level rise induced erosion and inundation, and groundwater contamination, a
probability score of 3 was given for all CZMUs. This is based on a high-end sea level rise
prediction of 2 m by 2100 occurring gradually over the next 90 years, which could be seen as
Page 4Phase 3: Overberg DM Sea Level Rise and Flood Hazard Risk Assessment 2012
a slow onset 1:100 year event. The predicted increased frequency of extreme sea level
events (with the exception of tsunamis) due to a higher sea level base and increased wind
regimes resulted in a probability score of 4 being given to all CZMUs for the extreme event
hazard. Exceptions included Hermanus (Os8; high sea cliff protection), Kleinbaai (Os12;
Danger Point headland protection) and Infanta (Sd1; Kaap Infate headland protection), which
were given a probability score of 3 due to only a 1:100 year extreme event possibly having
any effect on the CZMUs. Tsunamis, whether nearshore/local (e.g. meteo-tsunamis or edge
waves, and submarine landslides along the Cape Town and Agulhas Slumps) or
transoceanic (e.g. Sumatra megathrust near Mentawai in Indonesia, South Sandwich Island
arc in the South Atlantic near South America, and Marion Island volcanic induced flank
collapse) in origin (see Roberts (2008) for details on potential sources of tsunami along the
South African coast), are difficult to predict and hence the probability score of 4 for extreme
sea level events in association with tsunamis is kept in most cases.
Table 2-1 Initial delineated CZMUs for the Overberg DM.
LM Overstrand
CZMU
Os1 Os2 Os3 Os4 Os5 Os6 Os7 Os8 Os9 Os10 Os11 Os12 Os13 Os14 Os15
No.
Vermont-Sandbaai
Kaap Hangklip
Pearly Beach
Quoin Point
Walker Bay
Betty's Bay
Klein River
Kleinmond
Hermanus
Gansbaai
Bot River
Kleinbaai
Hawston
Uilkraals
Rooiels
CZMU
Name
LM Cape Agulhas WCDMA03 Swellendam
CZMU
Ca1 Ca2 Ca3 Ca4 Ca5 Wo1 Wo2 Wo3 Sd1
No.
Waenhuiskrans
Cape Agulhas
De Hoop Vlei
Aasvontein
Struisbaai
De Mond
Ryspunt
Potberg
Infanta
CZMU
Name
Page 5Phase 3: Overberg DM Sea Level Rise and Flood Hazard Risk Assessment 2012
Figure 2-1 Initial delineated CZMUs for the Overberg DM (refer to Table 2-1 for CZMU names).
Page 6Phase 3: Overberg DM Sea Level Rise and Flood Hazard Risk Assessment 2012
The severity of each hazard is dependent on the geology and geomorphology of each
CZMU, with the scores defined in Table 2-2 below. Groundwater contamination refers to the
increased landward intrusion of highly saline seawater into freshwater aquifer systems, due
to a rise in sea level. Primary (unconsolidated sediment e.g. Bredasdorp Group) and
fractured (faulted and folded quartzites and sandstones e.g. Peninsula and Skurweberg
Formations of the Table Mountain Group) aquifers are generally more susceptible to all
forms of contamination in comparison to regolith aquifers (weathered soil and regolith e.g.
Bokkeveld Group shales and siltstones), due to their higher hydraulic conductivity i.e. ability
to transmit water. The extent of aquifer use (qualitatively determined by the amount of
National Groundwater Database registered boreholes within and in the vicinity of each
CZMU) will also affect the severity of saltwater intrusion, as high groundwater use draws the
freshwater-saltwater interface landwards and upwards, closer to the ground surface. The
severity of sea level rise induced erosion/inundation and extreme events can be affected by
various factors, including mean wave height, the amount of sea level rise, tidal range,
geomorphology, coastal slope and rates of accretion/erosion (Thieler and Hammar-Klose,
1999). The mean wave height, rate of sea level rise and tidal range is generally the same
along the Overberg DM coastline, and the detailed rates of accretion/erosion are unknown,
therefore geomorphology and coastal slope were the two variables used to assess the
severity of both hazards. Low gradient sandy coastlines with no backing foredunes generally
experience the greatest coastal erosion and inundation, with steep gradient rocky coastlines
experiencing the least. Headland and inlet bay beaches usually experience the highest
swash run-ups during extreme storm/sea level events, due to the headland geomorphology
and bathymetry often funneling wave energy directly towards the adjacent beaches.
Sheltered sandy and steep rocky coastlines generally receive minor swash run-ups during
extreme storms, tsunamis etc., reducing the severity of the event.
Table 2-2 Hazard scoring methodology for each hazard.
Severity Probability
Score SLR induced erosion Groundwater
Extreme events Frequency of return
/ inundation contamination
Steep gradient rocky Unused regolith
1 Steep rocky coastline Negligible
coastline aquifer
Steep gradient sandy Unused Sheltered sandy
coastline; low- primary/fractured coastline; low-
2 1 : 1000 year event
moderate gradient aquifer; moderately moderate gradient
rocky coastline used regolith aquifer rocky coastline
Low gradient sandy Moderately used
coastline with steep primary/fractured Exposed sandy
3 1 : 100 year event
backing foredune or aquifer; highly used coastline
cliffs regolith aquifer
Low gradient sandy Highly used Headland/inlet bay
4 coastline with minor primary/fractured beach or low gradient 1 : 10 year event
backing foredune aquifer coastline with estuary
Very low gradient Very highly used
Head/inlet bay beach
5 sandy coastline with primary/fractured Yearly
with large estuary
no backing foredune aquifer
Page 7Phase 3: Overberg DM Sea Level Rise and Flood Hazard Risk Assessment 2012
2.3 VULNERABILITY
Vulnerability (V) was divided into three types, namely social (So), environmental (En) and
economic (Ec) vulnerability. Social vulnerability was based on the possible amount of human
injuries or deaths, economic vulnerability on the total approximate economic cost in Rands,
and environmental vulnerability on the possible environmental damage to a specific
ecosystem (i.e. whether sensitive/protected or not) that may result from a specified hazard or
disaster (see Table 2-3). Each vulnerability type was scored out of 5 based on the variables
in Table 2-3, and a final vulnerability score was calculated using the equation:
V = (En + Ec + So) / 3.
With the Overberg DM’s and associated coastal LM’s 2011/2012 budget being in the range
of approximately R 840 million i.e. R 420 million per year, each economic vulnerability score
represents a percentage value of the budget increasing in factors of ten, ranging from
0.002 % of the total annual budget (R 1 million – score of 1) to ~ 2400 % of the total budget
(R 10 billion – score of 5). An extreme coastal event comparable to the KZN March 2007
storm could cause damage almost the entire total annual budget of the Overberg DM and
five coastal LM’s combined, if every developed coastal area was severely affected. This is
unlikely however (as described in previous reports), due to a large proportion of
developments occurring on relatively elevated rocky outcrop. An extreme event in the form
of a very large storm surge or tsunami would cause the highest amount of injuries or loss of
life, as well as the greatest infrastructural and environmental damage, and hence the highest
vulnerabilities are associated with this hazard. Sea level rise induced coastal erosion and
inundation is a gradual process, and hence loss of human life or injury is unlikely. Evolving
shorelines can have a high economic and environmental cost over time however, as
indicated in the risk assessment. Groundwater contamination may indirectly cause sickness
or loss of life and affect economic activity, due to the destruction of possible future potable
water resources. This is especially the case of towns along the Overberg DM coastline such
as Hermanus and Struisbaai that already use groundwater to a large extent, and where salt
water contamination has already caused contamination of the Peninsula Formation at
Struisbaai (Toens et al., 1998). Environmental vulnerability is based on the sensitivity of the
ecosystem in a regional sense.
Table 2-3 Vulnerability scoring methodology.
Social Economic Environmental
Score
No. injuries/deaths Cost (Rand)
No sensitive
1 0 - 10 0 - R1 million
ecosystem
R1 million -
2 10 - 100 Sensitive ecosystem
R10 million
R10 million - Protected
3 100 - 1 000
R100 million ecosystem
R100 million -
4 1 000 - 10 000 National Park
R1 billion
R1 billion - World Heritage or
5 10 000 - 100 000
R10 billion RAMSAR Site
2.4 COPING CAPACITY
Coping capacity defines the resilience a community or area has to a disaster i.e. to what
extent will a community be affected by and how long it will take to recover from a disaster.
Page 8Phase 3: Overberg DM Sea Level Rise and Flood Hazard Risk Assessment 2012
Each CZMU was given a coping capacity score for each hazard, based on the
implementation of the various stages of the Hyogo Framework for Action (HFA): Priorities for
Action (United Nations International Strategy for Disaster Reduction (UN/ISDR), 2005)
(detailed in Table 2-4 below). The HFA priority areas strive to reduce the impact of disasters
through gender sensitive disaster preparedness and risk reduction i.e. by increasing the
coping capacity. Each HFA priority area was given a score out of 5, depending on whether
there was:
None to very limited implementation – 1
Limited implementation – 2
Partially implemented – 3
Mainly implemented – 4
Fully implemented – 5
The final coping capacity was then calculated using the equation:
C = (HFA1 + HFA2 + HFA3 + HFA4 + HFA5) / 5
Full implementation of all the HFA priority areas will result in a CZMU having a high coping
capacity, ensuring that it is able to deal with coastal disasters. Little to no implementation of
the HFA priority areas will result in coastal communities within the CZMU being highly
affected by and taking a long period of time to recover from coastal disasters. The CZMUs
along the Overberg DM coastline generally have low coping capacities, due to minor
implementation of the HFA priority areas. HFA1 (see Table 2-4) is the highest scoring
priority area, due to the development of national and provincial, and in some cases policies
and frameworks to deal with ICZM and estuary management. Little to no implementation of
HFAs 2 to 5 has occurred across the entire Overberg DM coastline however.
Table 2-4 Key indicators for assessing coping capacity based on the Hyogo Framework for
Action (HFA) priority areas (UN/ISDR, 2005).
HFA Priority Core Tasks for Disaster Risk
Key Indicators
Areas Reduction
HFA 1 Engage in multi-stakeholder dialogue to Legal framework exists with explicit responsibilities
Making Disaster establish foundations defined for all levels
Risk a Priority
Create or strengthen mechanisms for National multi-stakeholder platform
systematic coordination
Assess and develop institutional basis National policy framework exists that requires plans and
activities at all levels
Prioritize and allocate appropriate resources Dedicated adequate resources to implement plans at all
levels
HFA 2 Establish an initiative for country wide risk National RA based on H and V info/data and include RA
Improving Risk assessments (RA) for key sectors
Information and
Early Warning Review availability of risk related info and Systems are in place to monitor, archive and disseminate
capacities for data collection and use data on H and V
Assess capacities and strengthen early Early warning in place for all major hazards
warning
Page 9Phase 3: Overberg DM Sea Level Rise and Flood Hazard Risk Assessment 2012
HFA Priority Core Tasks for Disaster Risk
Key Indicators
Areas Reduction
Develop communication and dissemination Early warnings reach and serve people at community
mechanisms level
HFA 3 Develop a programme to raise awareness National awareness strategy exists that reaches all
Building a culture communities and people of all education
of safety and
resilience Include disaster risk reduction (DRR) in School curricula at all levels includes DRR elements and
education system and research community instructors are trained in DRR at all levels
Develop DRR training for key sectors
Enhance the compilation, dissemination and
use of DRR info
HFA 4 Environment: DRR is incorporated into Environmental protection and natural resource
Reducing the environmental and natural resource management and climate change policies include DRR
Risks in Key management elements
Sectors
Social needs: establish mechanisms for Specific policies and plans are implemented to reduce
increased resilience of the poor and most vulnerability of impoverished groups
vulnerable
Physical planning: establish measures to Land-use development zoning, plans and building codes
incorporate DRR in urban and land use exist, include DRR elements and are strongly enforced
planning
Structures: strengthen mechanisms for Long term national programme to protect schools, health
improved building safety and protection of facilities and critical infrastructure from common natural
critical facilities hazards
Stimulate DRR activities in production and Procedure in place to assess the DRR implications of
service sector major infrastructure project proposals
Financial/economic instruments: create
opportunities for Private sector involvement in
DRR
Disaster Recovery: develop a recovery
planning process that includes DRR
HFA 5 Develop a common understanding and Disaster preparedness and contingency plans at all levels
Strengthen activities to support preparedness with regular training drills and rehearsals to test and
Preparedness for develop disaster preparedness and response (DP&R)
Response
Assess preparedness, capacities and Independent assessment done and responsibilities for
readiness implementing recommendations and resources schedule
assigned
Strengthen planning and programming for All organisations, personnel and volunteers responsible
response, recovery and review for maintaining preparedness are equipped and trained
for effective DP&R
Financial and contingency mechanisms are in place to
support effective response and recovery
Procedures are in place to document experience during
hazard events and disasters and to undertake post event
reviews
Page 10Phase 3: Overberg DM Sea Level Rise and Flood Hazard Risk Assessment 2012
2.5 RISK
The risk calculation, colour coding for the risk maps, and simplified conceptual spread of the
ranking is shown in below in Table 2-5 and Table 2-6 (the entire risk matrix is too large for
this document, containing ~ 2500 possible values compared to 70 shown in Table 2-6). The
risk calculation shows that coping capacity has a significant influence on the final risk
assessment, and hence the importance in developing coping capacity mechanisms to deal
with disasters in order to reduce the final risk e.g. even if a specific CZMU had the highest
H x V ranking possible of 25, a coping capacity of 5 (i.e. full implementation of all five HFA
priority areas) would reduce the risk of the CZMU to that hazard or possible disaster to 5
(moderate risk). The benefit of strong coping capacity is highlighted with regards to possible
groundwater contamination at Hermanus (Os18). The hazard and vulnerability scores for
groundwater contamination are high in Hermanus, due to the town being highly dependent
on groundwater from the fractured Peninsula Formation aquifer (that is likely to be connected
to the ocean in the area). However, the aquifer is highly monitored, and early warning
telemetry systems are in place to stop pumping if water levels drop below 5 mamsl, or
salinities increase too rapidly (Seyler et al., 2009). The public is also continuously notified
and educated of groundwater developments through the Onrus Monitoring Committee.
Table 2-5 Risk scoring methodology.
Score Risk Ranking
0 - 1.5 Very Low
1.50 - 3 Low
3.0 - 6 Moderate
6.0 - 15 High
15.0 - 25 Very High
Table 2-6 Qualitative risk assessment, based on the hazard and vulnerability score (H x V) and
coping capacity score.
Coping Capacity (C)
1 2 3 4 5
1 1.0 0.5 0.3 0.3 0.2
2 2.0 1.0 0.7 0.5 0.4
Hazard x Vulnerability (H x V)
3 3.0 1.5 1.0 0.8 0.6
4 4.0 2.0 1.3 1.0 0.8
5 5.0 2.5 1.7 1.3 1.0
6 6.0 3.0 2.0 1.5 1.2
8 8.0 4.0 2.7 2.0 1.6
9 9.0 4.5 3.0 2.3 1.8
10 10.0 5.0 3.3 2.5 2.0
12 12.0 6.0 4.0 3.0 2.4
15 15.0 7.5 5.0 3.8 3.0
16 16.0 8.0 5.3 4.0 3.2
20 20.0 10.0 6.7 5.0 4.0
25 25.0 12.5 8.3 6.3 5.0
Page 11Phase 3: Overberg DM Sea Level Rise and Flood Hazard Risk Assessment 2012
3. COASTAL HAZARD RISK ASSESSMENT RESULTS
3.1 SEA LEVEL RISE INDUCED COASTAL EROSION AND INUNDATION
The majority of the Overberg DM CZMUs are at a low risk to sea level rise induced coastal
erosion and inundation (58% of total CZMUs), with the remaining CZMUs at moderate risk
(predominantly the stretch from Pearly Beach to De Hoop Vlei; see Table 3-1, Table 3-2 and
Figure 3-1). The regions most at risk (although still at moderate risk) include sandy coastal
sections linked with larger estuaries (Bot River, Klein River and Walker Bay CZMUs), and the
coastal stretch between Pearly Beach and De Hoop Vlei (with the exception of rockier
coastal areas at Aasvontein and Ryspunt). The areas of low risk reflect moderate to high
gradient coastal areas, often with rocky coastlines or high backing coastal dune systems,
with relatively little development in lower elevation areas or within the coastal foredune.
Areas of moderate risk in turn reflect relatively low gradient coastal areas, often with
extensive beaches or large estuaries, in association with areas of development (or possible
future development) close to the shoreline.
3.2 GROUNDWATER CONTAMINATION
The majority of the Overberg CZMUs are at a low risk to groundwater contamination from
salt water intrusion related to sea level rise (58% of total CZMUs), with the exception being
the Overstrand (Vermont to Kleinbaai, moderate risk) and Cape Agulhas/Struisbaai regions
(moderate to high risk; see Table 3-1, Table 3-3and Figure 3-2). The at risk areas of the
Overberg DM are comprised of hydraulically conductive and therefore vulnerable primary
(Bredasdorp Group) and fractured quartzitic (Peninsula and Skurweberg Formation) aquifers,
which are used to a large extent for groundwater supply in towns such as Hermanus and
Struisbaai. Vulnerability and risk may increase over time, due to possible future potable
water shortages in the area as a result of climate change, and the associated increased
exploitation of groundwater resources. The introduction of real time telemetry monitoring, in
association with aquifer wellfield modelling and regional ecological and groundwater
monitoring, can reduce the risk of over abstraction and salt water intrusion, as evidenced by
the monitor-model-manage approach employed in Hermanus for the abstraction of
groundwater from the coastal Peninsula Formation aquifer (Seyler et al., 2009).
3.3 EXTREME EVENTS
The majority of the Overberg DM CZMUs are at a low (46% of total CZMUs) to moderate
(50% of total CZMUs) risk from extreme coastal events such as large storm surges and
tsunamis (see Table 3-1, Table 3-4and Figure 3-3). The regions at most risk include the
relatively low gradient sandy and rocky coastal sections of Struisbaai (focused wave energy
north of the harbour), Quoin Point (direct exposure of the fishing community of Buffeljagsbaai
to large swell), Cape Agulhas and Vermont-Sandbaai (large proportion of shore fronting
properties close to the high water mark), Klein River and Bot River (estuarine systems prone
to flooding). The areas of low to moderate risk reflect moderate to high gradient coastal
areas, often with rocky coastlines or high backing coastal dune systems, with relatively little
development in lower elevation areas or within the coastal foredune e.g. Kleinmond,
Hermanus and Gansbaai, where development is well above the 10 mamsl contour.
Page 12Phase 3: Overberg DM Sea Level Rise and Flood Hazard Risk Assessment 2012
Table 3-1 Number/percent of risk ranked CZMUs per coastal hazard.
SLR induced coastal Groundwater
Extreme events
Score Risk Ranking erosion/inundation contamination
No. % No. % No. %
0 - 1.5 Very Low 0 0 0 0 0 0
1.50 - 3 Low 14 58 14 58 11 46
3.0 - 6 Moderate 10 42 9 38 12 50
6.0 - 15 High 0 0 1 4 1 4
15.0 - 25 Very High 0 0 0 0 0 0
Table 3-2 Risk assessment for the Overberg DM with respects to sea level rise induced coastal
erosion and inundation (refer to Table 2-5 for risk ranking values).
Local CZMU Hazard Vulnerability Coping Capacity Risk
CZMU Nam e
Municipality Code P S H Ec So En V HFA1 HFA2 HFA3 HFA4 HFA5 C R
Os1 Rooiels 3 2 2.5 1 1 3 1.7 4 2 1 2 1 2 2.1
Os2 Kaap Hangklip 3 2 2.5 1 1 2 1.3 4 2 1 2 1 2 1.7
Os3 Betty's Bay 3 2 2.5 3 1 3 2.3 4 2 1 2 1 2 2.9
Os4 Kleinmond 3 1 2.0 1 1 3 1.7 4 2 1 2 1 2 1.7
Os5 Bot River 3 4 3.5 2 1 3 2.0 4 2 1 2 1 2 3.5
Os6 Haw ston 3 3 3.0 1 1 2 1.3 3 1 1 2 1 1.6 2.5
Os7 Vermont-Sandbaai 3 2 2.5 2 1 2 1.7 3 1 1 2 1 1.6 2.6
Overstrand Os8 Hermanus 3 1 2.0 1 1 2 1.3 3 1 1 2 1 1.6 1.7
Os9 Klein River 3 3 3.0 3 1 3 2.3 4 2 1 2 1 2 3.5
Os10 Walker Bay 3 3 3.0 1 1 3 1.7 3 1 1 2 1 1.6 3.1
Os11 Gansbaai 3 1 2.0 1 1 2 1.3 3 1 1 2 1 1.6 1.7
Os12 Kleinbaai 3 2 2.5 2 1 2 1.7 3 1 1 2 1 1.6 2.6
Os13 Uilkraals 3 3 3.0 2 1 3 2.0 4 2 1 2 1 2 3.0
Os14 Pearly Beach 3 4 3.5 2 1 3 2.0 3 1 1 2 1 1.6 4.4
Os15 Quoin Point 3 2 2.5 2 1 3 2.0 3 1 1 2 1 1.6 3.1
Ca1 Aasvontein 3 2 2.5 1 1 3 1.7 3 1 1 2 1 1.6 2.6
Ca2 Cape Agulhas 3 2 2.5 2 1 4 2.3 3 1 1 2 1 1.6 3.6
Cape
Ca3 Struisbaai 3 4 3.5 3 1 2 2.0 3 1 1 2 1 1.6 4.4
Agulhas
Ca4 De Mond 3 3 3.0 1 1 5 2.3 4 2 2 1 2 2.2 3.2
Ca5 Waenhuiskrans 3 3 3.0 2 1 2 1.7 3 1 1 2 1 1.6 3.1
Wo1 Ryspunt 3 3 3.0 1 1 2 1.3 3 1 1 2 1 1.6 2.5
WCDMA03 Wo2 De Hoop Vlei 3 3 3.0 1 1 5 2.3 4 2 2 1 2 2.2 3.2
Wo3 Potberg 3 1 2.0 1 1 3 1.7 3 1 1 2 1 1.6 2.1
Sw ellendam Sd1 Infanta 3 2 2.5 1 1 2 1.3 3 1 1 2 1 1.6 2.1
Page 13Phase 3: Overberg DM Sea Level Rise and Flood Hazard Risk Assessment 2012
Table 3-3 Risk assessment for the Overberg DM with respects to groundwater contamination
(refer to Table 2-5 for risk ranking values).
Local CZMU Hazard Vulnerability Coping Capacity Risk
CZMU Nam e
Municipality Code P S H Ec So En V HFA1 HFA2 HFA3 HFA4 HFA5 C R
Os1 Rooiels 3 2 2.5 1 1 3 1.7 4 1 1 1 1 1.6 2.6
Os2 Kaap Hangklip 3 2 2.5 1 1 2 1.3 4 1 1 1 1 1.6 2.1
Os3 Betty's Bay 3 2 2.5 1 1 3 1.7 4 1 1 1 1 1.6 2.6
Os4 Kleinmond 3 3 3.0 2 2 2 2.0 4 3 1 1 1 2 3.0
Os5 Bot River 3 1 2.0 1 1 3 1.7 4 1 1 1 1 1.6 2.1
Os6 Haw ston 3 2 2.5 1 1 2 1.3 3 1 1 1 1 1.4 2.4
Os7 Vermont-Sandbaai 3 4 3.5 3 2 2 2.3 4 3 1 2 2 2.4 3.4
Overstrand Os8 Hermanus 3 5 4.0 4 3 3 3.3 4 5 1 3 4 3.4 3.9
Os9 Klein River 3 3 3.0 1 1 2 1.3 3 2 1 1 1 1.6 2.5
Os10 Walker Bay 3 3 3.0 1 1 3 1.7 3 1 1 1 1 1.4 3.6
Os11 Gansbaai 3 4 3.5 2 1 2 1.7 4 2 1 1 1 1.8 3.2
Os12 Kleinbaai 3 3 3.0 2 1 2 1.7 3 2 1 1 1 1.6 3.1
Os13 Uilkraals 3 2 2.5 1 1 3 1.7 4 2 1 1 1 1.8 2.3
Os14 Pearly Beach 3 2 2.5 1 1 3 1.7 3 1 1 1 1 1.4 3.0
Os15 Quoin Point 3 2 2.5 1 1 3 1.7 3 1 1 1 1 1.4 3.0
Ca1 Aasvontein 3 3 3.0 1 1 3 1.7 3 1 1 1 1 1.4 3.6
Ca2 Cape Agulhas 3 5 4.0 2 2 4 2.7 4 2 1 1 1 1.8 5.9
Cape Agulhas Ca3 Struisbaai 3 5 4.0 4 3 2 3.0 4 2 1 1 1 1.8 6.7
Ca4 De Mond 3 2 2.5 2 1 4 2.3 4 2 2 1 2 2.2 2.7
Ca5 Waenhuiskrans 3 3 3.0 2 1 2 1.7 3 1 1 1 1 1.4 3.6
Wo1 Ryspunt 3 2 2.5 1 1 2 1.3 3 1 1 1 1 1.4 2.4
WCDMA03 Wo2 De Hoop Vlei 3 3 3.0 1 1 5 2.3 4 2 2 1 2 2.2 3.2
Wo3 Potberg 3 2 2.5 1 1 3 1.7 4 1 1 1 1 1.6 2.6
Sw ellendam Sd1 Infanta 3 2 2.5 1 1 2 1.3 3 1 1 1 1 1.4 2.4
Table 3-4 Risk assessment for the Overberg DM with respects to extreme events (refer to Table
2-5 for risk ranking values).
Local CZMU Hazard Vulnerability Coping Capacity Risk
CZMU Nam e
Municipality Code P S H Ec So En V HFA1 HFA2 HFA3 HFA4 HFA5 C R
Os1 Rooiels 4 2 3.0 2 1 3 2.0 4 2 1 2 1 2 3.0
Os2 Kaap Hangklip 4 2 3.0 2 1 2 1.7 4 2 1 2 1 2 2.5
Os3 Betty's Bay 4 2 3.0 3 1 3 2.3 4 2 1 2 1 2 3.5
Os4 Kleinmond 4 2 3.0 1 1 3 1.7 4 2 1 2 1 2 2.5
Os5 Bot River 4 4 4.0 2 1 3 2.0 4 2 1 2 1 2 4.0
Os6 Haw ston 4 2 3.0 1 1 2 1.3 3 1 1 2 1 1.6 2.5
Os7 Vermont-Sandbaai 4 2 3.0 4 2 2 2.7 3 1 1 2 1 1.6 5.0
Overstrand Os8 Hermanus 3 1 2.0 1 1 2 1.3 3 1 1 2 1 1.6 1.7
Os9 Klein River 4 4 4.0 3 2 2 2.3 4 2 1 2 1 2 4.7
Os10 Walker Bay 4 2 3.0 1 1 3 1.7 3 1 1 2 1 1.6 3.1
Os11 Gansbaai 4 1 2.5 1 1 2 1.3 3 1 1 2 1 1.6 2.1
Os12 Kleinbaai 3 2 2.5 2 1 2 1.7 3 1 1 2 1 1.6 2.6
Os13 Uilkraals 4 2 3.0 2 1 3 2.0 4 2 1 2 1 2 3.0
Os14 Pearly Beach 4 2 3.0 2 1 3 2.0 3 1 1 2 1 1.6 3.8
Os15 Quoin Point 4 3 3.5 2 2 3 2.3 3 1 1 2 1 1.6 5.1
Ca1 Aasvontein 4 2 3.0 1 1 3 1.7 3 1 1 2 1 1.6 3.1
Ca2 Cape Agulhas 4 2 3.0 3 2 4 3.0 4 1 1 2 1 1.8 5.0
Cape
Ca3 Struisbaai 4 4 4.0 4 2 2 2.7 3 1 1 2 1 1.6 6.7
Agulhas
Ca4 De Mond 4 3 3.5 1 1 5 2.3 4 2 2 1 2 2.2 3.7
Ca5 Waenhuiskrans 4 3 3.5 2 1 2 1.7 3 1 1 2 1 1.6 3.6
Wo1 Ryspunt 4 3 3.5 1 1 2 1.3 3 1 1 2 1 1.6 2.9
WCDMA03 Wo2 De Hoop Vlei 4 3 3.5 1 1 5 2.3 4 2 2 1 2 2.2 3.7
Wo3 Potberg 4 1 2.5 1 1 3 1.7 3 1 1 2 1 1.6 2.6
Sw ellendam Sd1 Infanta 3 2 2.5 1 1 2 1.3 3 1 1 2 1 1.6 2.1
Page 14Phase 3: Overberg DM Sea Level Rise and Flood Hazard Risk Assessment 2012
Figure 3-1 Risk assessment for the Overberg DM with respects to sea level rise induced
coastal erosion and inundation (refer to Table 2-5 for risk ranking values).
Page 15Phase 3: Overberg DM Sea Level Rise and Flood Hazard Risk Assessment 2012
Figure 3-2 Risk assessment for the Overberg DM with respects to groundwater contamination
(refer to Table 2-5 for risk ranking values).
Page 16Phase 3: Overberg DM Sea Level Rise and Flood Hazard Risk Assessment 2012
Figure 3-3 Risk assessment for the Overberg DM with respects to extreme events (refer to Table
2-5 for risk ranking values).
Page 17Phase 3: Overberg DM Sea Level Rise and Flood Hazard Risk Assessment 2012
The coastal risk hazard assessment for the Overberg DM identifies six CZMUs that have an
average risk score of greater than 3.5, which are highlighted by the top six CZMU names and
orange blocks in the Average Risk column in Table 3-5. These CZMUS are: Struisbaai
(Ca3), Cape Agulhas (Ca2), Quoin Point (Os15), Pearly Beach (Os14), Vermont-Sandbaai
(Os7) and Klein River (Os9).
Table 3-5 Summarised coastal hazard risk assessment scores and highest risk CZMUs.
SLR Induced
CZMU Groundwater
CZMU Name Erosion and Extreme Events Average Risk
Code Contamination
Inundation
Ca3 Struisbaai 4.4 6.7 6.7 5.9
Ca2 Cape Agulhas 3.6 5.9 5.0 4.9
Os15 Quoin Point 3.1 3.0 5.1 3.7
Os14 Pearly Beach 4.4 3.0 3.8 3.7
Os7 Vermont-Sandbaai 2.6 3.4 5.0 3.7
Os9 Klein River 3.5 2.5 4.7 3.6
Ca5 Waenhuiskrans 3.1 3.6 3.6 3.4
Wo2 De Hoop Vlei 3.2 3.2 3.7 3.4
Os10 Walker Bay 3.1 3.6 3.1 3.3
Os5 Bot River 3.5 2.1 4.0 3.2
Ca4 De Mond 3.2 2.7 3.7 3.2
Ca1 Aasvontein 2.6 3.6 3.1 3.1
Os3 Betty's Bay 2.9 2.6 3.5 3.0
Os12 Kleinbaai 2.6 3.1 2.6 2.8
Os13 Uilkraals 3.0 2.3 3.0 2.8
Wo1 Ryspunt 2.5 2.4 2.9 2.6
Os1 Rooiels 2.1 2.6 3.0 2.6
Os6 Hawston 2.5 2.4 2.5 2.5
Wo3 Potberg 2.1 2.6 2.6 2.4
Os8 Hermanus 1.7 3.9 1.7 2.4
Os4 Kleinmond 1.7 3.0 2.5 2.4
Os11 Gansbaai 1.7 3.2 2.1 2.3
Sd1 Infanta 2.1 2.4 2.1 2.2
Os2 Kaap Hangklip 1.7 2.1 2.5 2.1
Page 18Phase 3: Overberg DM Sea Level Rise and Flood Hazard Risk Assessment 2012
4. SEA LEVEL RISE ADAPTATION
There are three different options for sea level rise adaptation, namely (German Advisory
Council on Global Change (WBGU), 2006):
Protection – protect the coastline from sea level rise by structures;
Managed retreat – retreat from or reduce development in coastal areas; and
Accommodation – modify land use and infrastructure to accommodate coastal
hazards.
Shoreline protection can be in the form of engineering or hard structures, or
biological/geomorphic or soft structures. Hard structures include sea walls, dykes, dolosse,
groynes, gabions, revetments and offshore artificial reefs. Hard structures are often very
expensive protective options with regards to construction and maintenance, are aesthetically
unpleasing, and can form a hazard to bathers and other beach users (Breetzke et al., 2008).
They also often only have a positive effect at the exact site (although they can exacerbate
the effects of sea level rise on site in some cases), and can cause changes in and increased
stress upon neighbouring ecological and littoral systems e.g. triggering or acceleration of
erosion due the disruption of longshore sediment transport, and the reduction of wetlands on
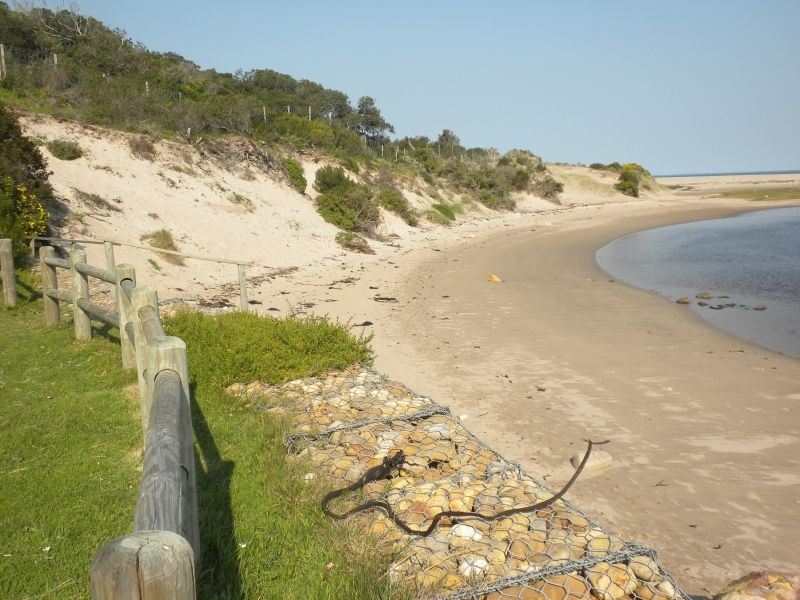
the landward side of the barrier due to reduced water inflow (WBGU, 2006) (see Figure 4-1).
Figure 4-1 Gabion structure at the edge of the Palmiet Caravan Park, Palmiet River estuary (left
image). Increased erosion along the estuary bank to the southeast of the gabion,
possibly as a result of the structure (right image).
Soft protective structures can either be biological e.g. the conservation, rehabilitation and
protections of wetlands, mangroves, kelp beds and dune vegetation, or geomorphological in
nature e.g. dune cordons and offshore natural sedimentary bars/rock outcrop/reefs, geofabric
bags, and beach nourishment, water pump and beach drainage systems. Soft structures
(especially natural systems) are often more cost effective and offer better protection than
hard structures, although they are difficult to implement and also require continuous
maintenance (Breetzke et al., 2008). Soft structures have a reduced safety hazard, are more
flexible and usually allow for the continuation of natural processes. Human developed soft
structures have to be implemented properly in order for them to be effective however e.g.
Page 19You can also read