Sea Level Rise Impacts and Adaption Measures for Sandakan, Sabah - ICHE 2014
←
→
Page content transcription
If your browser does not render page correctly, please read the page content below
ICHE 2014, Hamburg - Lehfeldt & Kopmann (eds) - © 2014 Bundesanstalt für Wasserbau ISBN 978-3-939230-32-8

Sea Level Rise Impacts and Adaption Measures for Sandakan, Sabah
N.A. Awang, A. Mohd Shah, A. Ahmad, Y. Anak Benson & M.R. Abd. Hamid
National Hydraulic Research Institute Malaysia (NAHRIM), Selangor, Malaysia

ABSTRACT: Sea level rise (SLR) can give various impacts such as inundation in the low-lying areas, in-
crease the coastal erosion and extreme events such as storm surge, wave overtopping, salt intrusion and
damage to existing coastal infrastructure, hence affects the socio-economy and the livelihood of the
coastal communities. The projected SLR along the Sandakan coast for the year 2020, 2040 and 2060 are
0.1 m, 0.25 m and 0.5 m, respectively. This study was carried out to assess the impacts of SLR to Sanda-
kan coast for 2020, 2040 and 2060; and to recommend some relevant adaptation measures to reduce the
impact. Hydrodynamic model with simulations of 2020 and 2040 projected SLR show no significant
change in Sandakan Town when compared to the existing condition, probably due to its high platform
level. However, model simulations for 2060 projected SLR show that the wave heights may increase by
0.18 m compared to the existing 2.6 m, although the wave heights in Teluk Sandakan will not change
much. Similarly, the maximum current velocities will increase by 0.15 m/s in 2060, compared to the ex-
isting condition of 0.3 - 0.5 m/s. Overall, more impacts of SLR can be observed at Pulau Duyong due to
its low-lying area. There will be a reduction in land area; about 958 hectares out of the existing 1,800 hec-
tares of mangrove forests and coastal vegetation will be lost due to inundation and erosion, generated by
the 0.5 m projected SLR in 2060. Construction of railings, low walls and rock bunds are recommended as
an adaptation measures to ensure the safety of the people living along the Sandakan coast. There is also a
need to raise the bund and platform levels for jetties and slipways at the Marine Police Complex to avoid
inundation. The estimated cost for the recommended adaptation measures is about RM18.25 Million.

Keywords: Malaysia, Impact, Inundation, Adaptation, Wave, Current

1 INTRODUCTION

In 2010, the National Hydraulic Research Institute of Malaysia (NAHRIM) had carried out “The Study of
the Impact of Climate Change on Sea Level Rise in Malaysia” where Sea Level Rise (SLR) Projections
for the year 2020, 2040, 2060, 2080 and 2100 were produced based on the statistical analysis of the tide
gauge data obtained from the Malaysian Department of Survey and Mapping (JUPEM) and satellite
altimeter data observed along the Malaysian coast. The result shows that the projected SLR along Sabah
coastline for the year 2100 will be between 0.6 to 1.0 m (NAHRIM, 2010).
    Consequently, NAHRIM was requested by the Economic Planning Unit (EPU) of the Prime Minister’s
Department, to undertake a comprehensive study on the SLR impacts along Sandakan coast because of its
high population; its outstanding socio-economic development; and vulnerability towards prone tsunami
event and coastal erosion (TRPD, 1996; SSMP, 2005).
    The objective of this study is to assess the impact of SLR to the potential hydrodynamics surrounding
the coast of Sandakan due to climate change and global temperature rise. This study will evaluate the
potential inundated area that may be caused by the projected sea level rise for the year 2020, 2040 and
2060; and their impacts to the low lying and risk area in Sandakan, hence recommend some relevant miti-
gation and adaptation measures to be implemented to reduce their impacts (EPU, 2012).

                                                       1017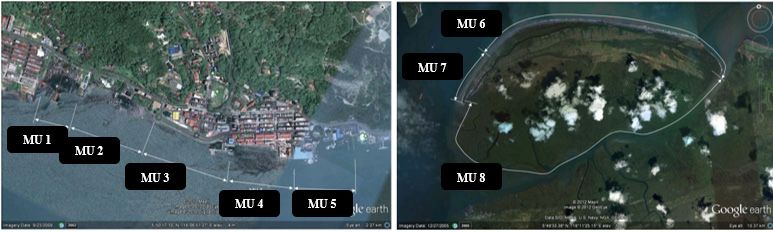
2 STUDY AREA
This study focuses on the two key locations which are most at risk i.e. the coast from Bandar Sandakan
(Sandakan Town) up to the Malaysian Maritime Enforcement Agency (APMM) Jetty, involving about 2.3
km coastline; and the entire coast of Pulau Duyong (Duyong Island) (EPU, 2012). The town is developing
rapidly with residential, industrial and ports. Some coastal protection structure such as the sea wall has
been built to protect the coastal town of Sandakan (EPU, 2012). On the other hand, Pulau Duyong is less
developed, consists of sandy beaches with gentle slope at the northern area while the southern area is
muddy. About 70% of Pulau Duyong is dominated by mangrove forests (EPU, 2012). Most of the popula-
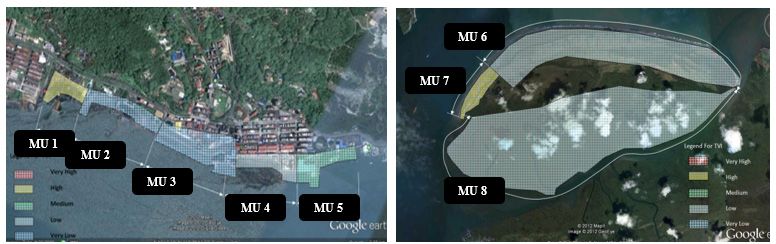
tion in Sandakan comprises of fishermen, labourers and hawkers. Figure 1 shows the location of the study
area which cover both Sandakan Town and Pulau Duyong.
Figure 1. Location of the study area
3 METHODOLOGY
Marine data collection such as the tide level; current velocity and direction; wave height and direction;
water quality; bathymetry and profile surveys; was carried out in May 2012. These data were then used as
input, calibration and analysis of MIKE21 numerical model simulation to study the hydraulic behaviour
around Sandakan coast (EPU, 2012).
Numerical modeling simulations were carried out based on the projected SLR for the year 2020, 2040,
and 2060 with the estimated increase of 0.1 m, 0.25 m and 0.5 m, respectively; taking into account the
effects of changes in tidal heights, waves and current speeds (EPU, 2012).
The vulnerability assessment of the Sandakan coast has also been done using the Management Unit
(MU) approach to identify its vulnerability against the sea level rise in terms of physical, ecological and
socio-economic (Figure 2). In addition, the socio-economic assessment was also carried out in the vicinity
of the study area in order to obtain feedbacks from local residents regarding the issue of rising sea levels.
Figure 2. Management Units (MUs) for Sandakan coast: Sandakan Town (left) and Pulau Duyung (Right) (Source: EPU,
2012)
10184 RESULTS AND DISCUSSION
Hydrodynamic modeling results produced some simulation parameters such as height of the water level,
waves and current speeds. Based on the simulation results, it can be seen that the increased in the water
level for the year 2060 is quite discernible when compared to the baseline (existing) condition.
For the baseline condition, the hydrodynamic simulation results show the maximum water level of be-
tween 1.56 to 1.92 m measured at Mean Sea Level (MSL) while the maximum water level for the 2020
projection is between 1.68 to 2.04 m (MSL) (EPU, 2012). Similarly, the maximum water level for the
2040 and 2060 projections found their respective increase of between 1.8 to 2.16 m and 2.04 to 2.28 m
(EPU, 2012).
In addition, the comparative analysis of the Highest Astronomical Tide (HAT) (NHC, 2012) for the
baseline condition and the projection for the 2060 shows an occurrences of water level differences from
0.01 to 0.51 m (Table 1).
Table 1. Comparison of the Highest Astronomical Tide (HAT) (Source: EPU, 2012)
_______________________________________________________________________
No Item
Observed (m) Forecast (m) *Difference (m)
_______________________________________________________________________
1 HAT 1.2 1.58 - -
2 Model 0.51 - 1.57 0.01
3 Existing condition (current) - 1.64 -
4 Projection 2020 0.11 1.75 0.11
5 Projection 2040 0.25 1.91 0.27
6_______________________________________________________________________
Projection 2060 0.50 1.45 0.51
* Difference between the current forecasts and projection forecasts
Based on the analysis carried out on the numerical modelling results, there is an increase in the wave
heights that propagate towards the coastline, in line with the rising sea level and these may cause changes
to the current flow pattern. The results of this study is quite reasonable in its degree where the higher the
sea level rise, then the distant the waves penetrate onshore will also increase.
Simulation results does not show significant changes on the SLR impacts for the year 2020 and 2040
compared to the baseline condition. However, simulations for 2060 indicates significant changes in terms
of wave heights in the study area. Although the risk of the increasing wave heights in Sandakan Town is
quite minimal, Pulau Duyong face a higher risk with an increase of 0.18 m.
Hydrodynamic modelling results also indicate that the increase of current speed is proportionate with
the increase in SLR, depending on the depth of the seabed. Based on the baseline condition, the average
current speed recorded highest in the vicinity of the canal between Pulau Duyong and Sandakan Town i.e.
between 0.3 - 0.5 m/s. The coastal areas around Sandakan Town which is protected by Pulau Berhala
shows lower current speeds with an average of about 0.1 m/s.
Based on the statistical maximum current speed, the area surrounding the canal between the Sandakan
Town and Pulau Duyong experience speeds above 0.9 m/s in the baseline condition; and this value is ex-
pected to spread wider to the rest of the canal by the year 2060. When SLR occurs, some beaches with
shallow profiles show higher current speeds while other beaches with deeper profiles indicate a reduction
in the current speeds.
Comparison between the baseline and the 2020 and 2040 current speeds shows no significant changes.
However, comparison between the baseline and 2060 current speeds indicates a maximum increase of
0.15 m/s. Figure 3 shows the modelled current speeds for the baseline condition; current speeds generated
by the projected sea level rise for year 2060; and the difference between them.
Table 2 shows the distribution of the Management Unit (MU) for the study area and the analysis of
vulnerability and the impact of rising sea level on the Physical, Ecology and Socio-economy aspects in
the study area. These Physical, Ecology and Socio-economic Indexes are then combined to produce the
Total Vulnerability Index (TVI) as summarised in Figure 4 and Table 3. Some of the adaptation measures
often used in addressing rising sea level are increasing the level of the rock revetment; building sea walls,
improving the existing structures by installing fence or railing as the sea barriers; reclamation; raising the
platform level of the jetty/pier/port; and relocation of residents to a higher ground.
There are also other methods of adaptation, such as building raft houses; floating houses; as well as the
construction of houses on stilts or piles. This study has also recommended some suitable adaptation
measures with an estimated cost to face the phenomenon of the rising sea levels (until the year 2060) as
shown in Tables 4 - 6.
1019A)
B)
C)
Figure 3. Modelled current speed (m/s): A) Maximum values baseline; B) Maximum values Projected 2060; and C)
Difference in current speed (2060 – baseline) (Source: EPU, 2012)
1020Table 2. Distribution of the Management Units (MU) in the study area and the analysis of their Physical, Ecology and socio-
economic aspects (Source: EPU, 2012)
MU Study Physical Socio-economy Ecology Note
area
1 Sandakan Town Water village - Majority population – Natural beach Floating rubbish and
(Taman Ramai- coastal length immigrants. sanitation
Ramai to Custom about 250 m Main activity - trading &
Office) fisheries
2 Sandakan Town Administration Main activity - fisheries Developed beach (jetty High platform level
(Post Office to buildings and jet- & sea wall) and protected by sea
Library) ty - coastal length wall
about 490 m
3 Sandakan Town Coastal road and Trading and commercial Developed beach (jetty Highest platform
(Roundabout protected by rock area & sea wall) level and protected
beside Post revetment – by sea wall
Office to APMM coastal length -
Jetty) 520 m
4 Sandakan Town Coastal road and Bustling with economic Developed beach (jetty Commercial
(Navy Base to walkway, com- activities, popular with & sea wall) buildings very close
Central Market) mercial buildings local and foreign to the sea
and tourist (hotel, shopping
protected by rock mall & restaurants)
revetment –
coastal length -
390 m
5 Sandakan Town Coastal road, sea Commercial, landing ar- Developed beach (jetty Platform level is
(Central Market front, commercial ea for small boats, & sea wall) rather low &
to Marine Police buildings and jet- passengers, vessels & almost inundated
Complex) ty – coastal length fishing boats during high tides
- 370 m
6 Pulau Duyong Low lying sandy Fishermen activities Common island flora Subjected to direct
(northern coast beaches with no from Kampong such as Casuarina eq- propagation of
with no development Tanjung Aru uisetifolia, Terminalia waves during the
population) catappa, Cinnamomun monsoon season
sp. & Hibiscus tilia-
ceus
7 Pulau Duyong Well planned Fishing & agricultural Common island flora, Houses built on
(Kampong community with economic activities some has been re- stilts
Tanjung Aru) impressive houses moved to make way for
and school public school for com-
munity development
8 Pulau Duyong Muddy beaches Fishermen activities Mangrove species such mudflats and
(southern area with mangrove from Kampong as Rhizophora mangrove forests -
with no forest Tanjung Aru mucronata; Rhizopho- exposed to coastal
population) ra apiculata; Avicennia erosion
sp.; Bruguiera sp. &
Sonneratia sp.
1021Figure 4. Total Vulnerability Index (TVI) for Sandakan Town (left); and Pulau Duyong (right) (Source: EPU, 2012)
Table 3. Summary of the vulnerability and impacts for each Management Unit (MU) for year 2060 and their adaptation
measures for Sandakan coast (Source: EPU, 2012)
MU Total Description Impacts Adaptation Measures
Vulnerability
Index (TVI)
1 High Low lying beach profiles Inundation is the major problem here Adaptation measures
High population at the water Land lost due to inundation is about 0.6 are incorporated in
villages along the coastline ha periodic maintenance
by local residence
2 Very low Coastline is bounded by high Freeboard is approximately 0.5 m None
vertical wall No damage or land lost occur from
Comprise of government SLR due to the high sea wall
buildings and amenities i.e.
library, custom complex etc.
3 Very low The coastline is protected by Freeboard is approximately 0.6 m but None
rock revetment varies places to places
Comprises of commercial No damage or loss due to SLR
buildings and Navy base
4 Low The coastline is protected by No damage or loss due to SLR Low wall or railling
rock revetment Freeboard will be reduced from 0.9 m
Comprises of commercial to 0.4 m in year 2060
buildings and tourist area Reduction in comfort level
5 Mederate The coastline is protected by Loading Jetty at the Market Building Raise platform levels
sea wall will be inudated and this jetty has to be for jetties and slipways
Comprises of Market Build- rebuilt
ing and Marine Police Com- The freeboard at Marine Police Jetty
plex will be reduced to 0.1 m in the year
2060. The platform levels need to be
raised or rebuilt
Most of the slipway at Marine Police
Jetty will be inundated in year 2060
and this will jeorpodise its operation.
Thus the slipway levels need to be
raised
6 Low The coastal areas is mainly Inundation can go as far as 150 m None
covered by coastal forests landward, increase in wave heights and
No human settlement current speed is 0.175 m and 0.3 m/s,
respectively during the monsoon
season
Loss of land about 94 ha due to 0.5 m
SLR
1022MU Total Description Impacts Adaptation Measures
Vulnerability
Index (TVI)
7 High The coastline is low and flat increase in wave heights and current Rock bund with
Consists of picturesque and speed is 0.18 m and 0.15 m/s suitable toe at shoreline
well organised water village respectively, may lead to shoreline
erosion and steepening of the beach
profile
Loss of land about 16 ha due to 0.5 m
SLR
8 Low The coastal areas is mainly Loss of about 958 ha of mangrove area None
covered by mangroves due to 0.5 m SLR
No human settlement In monetary terms, this translates to
about RM 8.8 million
Table 4. Cost estimates for 2020 adaptation measures (Source: EPU, 2012)
MU Adaptation Measures Cost / m (RM) Length Estimated Cost
(RM)
1 None - - -
2 None - - -
3 None - - -
4 None - - -
5 Raise jetty and slipway platform
levels
Jetty at Market Building 30,000 150 4,500,000
Jetty at Marine Police Complex - - -
Slipway at Marine Police Complex - - -
6 None - - -
7 Rock Bund 5,000.00 1000 5,000,000.00
8 None - - -
Total 9,500,000.00
Table 5. Cost estimates for 2040 adaptation measures (Source: EPU, 2012)
MU Adaptation Measures Cost / m (RM) Length (m) Estimated Cost
(RM)
1 None - - -
2 None - - -
3 None - - -
4 None - - -
5 Raise jetty and slipway platform levels
Jetty at Market Building - - -
Jetty at Marine Police Complex - - -
Slipway at Marine Police Complex - - -
6 None - - -
7 Rock bund - - -
8 None - - -
Total 0.00
1023Table 6. Cost estimates for 2060 adaptation measures (Source: EPU, 2012)
MU Adaptation Measures Cost / m (RM) Length (m) Estimated Cost
(RM)
1 None - - -
2 None - - -
3 Raise jetty platform level - - -
4 Low wall / railing 2,000.00 500 1,000,000.00
5 Raise jetty and slipway platform
levels - - -
Jetty at Market Building
Jetty at Marine Police Complex 40,000.00 100 4,000,000.00
Slipway at Marine Police Complex 50,000.00 75 3,750,000.00
6 None - - -
7 Rock bund - - -
8 None - - -
Total 8,750,000.00
5 CONCLUSION
The projected SLR in Sandakan has been estimated to be around 0.1 m, 0.25 m and 0.5 m for the year
2020, 2040, and 2060 respectively. These values have been derived from the simulation using the
AOGCM models. Hydrodynamic modeling works have shown that these increase in sea levels will result
in corresponding change in the nearshore wave and hydrodynamic flow patterns. In general, the hydraulic
modeling shows that the wave height at the shoreline tends to increase with the water level, as the higher
water levels will allow the waves to penetrate closer to the shoreline. For the year 2020 and 2040 scenari-
os, the hydrodynamic model results did not show any significant change compared to the existing (base-
line) conditions. However, for the 2060 scenario, there will be no change in the wave heights in Sandakan
Bay (existing height is about 0.2 m), while that at Pulau Duyong is much larger, an increase of 0.18 m
compared to the existing height of 2.6 m.
Similarly, hydrodynamic modeling shows that some of the shoreline and shallower areas tend to expe-
rience increase in velocity while some of the deeper areas tend to show a decrease in velocity. Since the
tidal flow is still the same, the increase in water levels will create bigger flow area which results in a de-
crease in velocity. In contrast, for shoreline and shallow areas, as water level increases, there is less fric-
tional effects from the sea bed which results in higher velocity. For the 2060 scenario, the maximum in-
crease in current speed is 0.15 m/s, compared to the current velocities of around 0.3 to 0.5 m/s.
Overall, the impact of the SLR is more pronounced in Pulau Duyong compared to Sandakan Town.
This is probably because Sandakan Town is built up on a raised platform level that is relatively safe from
the projected SLR for the year 2060. On the other hand, majority of Pulau Duyong which comprise of a
low lying area and covered by mangrove forests that grow below the Mean High Water (MHW) mark. It
is anticipated that there will be a reduction of about 53% of the existing 1,800 hectares of mangrove forest
(about 958 hectares) due to erosion and inundation caused by the rise of 0.5 m sea level in the year 2060.
The loss is estimated to be around RM8.8 million.
Some adaptation measures have been proposed to minimise the impact of SLR in the study area, such
as the construction of low walls or railings to give comfort to the pedestrians around Sandakan Town (in
MU 4). It is also recommended that the existing jetties and slipways near the Market Buildings and Ma-
rine Police Jetty (in MU 5) to be raised to a higher level to avoid flooding. Construction of dykes and re-
vetment was proposed in Kampung Air, Pulau Duyong (in MU 7) to protect the area from waves and cur-
rents action. Overall, the total cost of adaptation involved is estimated to be about RM 18.25 million.
ACKNOWLEDGEMENT
The authors greatly acknowledge all the relevant agencies involved in providing the fund, information
and support throughout the preparation of this paper.
1024REFERENCES
EPU (Economic Planning Unit) (2012). Study to assess the impacts of sea level rise at Sandakan, Sabah. Economic of Climate
Change for Malaysia. Prime Minister’s Department, Malaysia. Prepared by: National Hydraulic Research Institute of Ma-
laysia (NAHRIM). 155 pages.
NAHRIM (2010). The study of the impact of climate change on sea level rise in Malaysia. Final Report, National Hydraulic
Research Institute Malaysia, 172 pages.
NHC (National Hydrographic Centre) (2012). Tide Tables: Malaysia. Volume 2. Covering Malaysia, Singapore.
SSMP (Sabah shoreline management plan) (2005), baseline report, Vol. 0 Executive summary, vol. I—Data report, vol. II—
Baseline modelling report, vol. IIIA— Sectoral review, vol. IIIB—Coastline description. Report prepared by DHI Malaysia
for Environment Protection Department, Project no. MY-5189, 2005.
TRPD (Town and Regional Planning Department) (1996). ICZM (Integrated Coastal Zone Management) in the States of
Penang, Sabah and Sarawak, Malaysia: SABAH PILOT PROJECT COMPONENT. By: The Coastal Zone Management Unit,
Town and Regional Planning Department, Ministry of Local Government and Housing, Sabah. December 1996. 35 pages.
1025You can also read