Sea levels in and around Sydney Harbour 1886 to 2018 - (shorter version) - The Saltbush Club
←
→
Page content transcription
If your browser does not render page correctly, please read the page content below
Sea levels in and around
    Sydney Harbour
      1886 to 2018
         (shorter version)

                              An essay by Dr G M Derrick
                                      Brisbane, Australia
                             E: geoffd@powerup.com.au
                                          February 2019

                1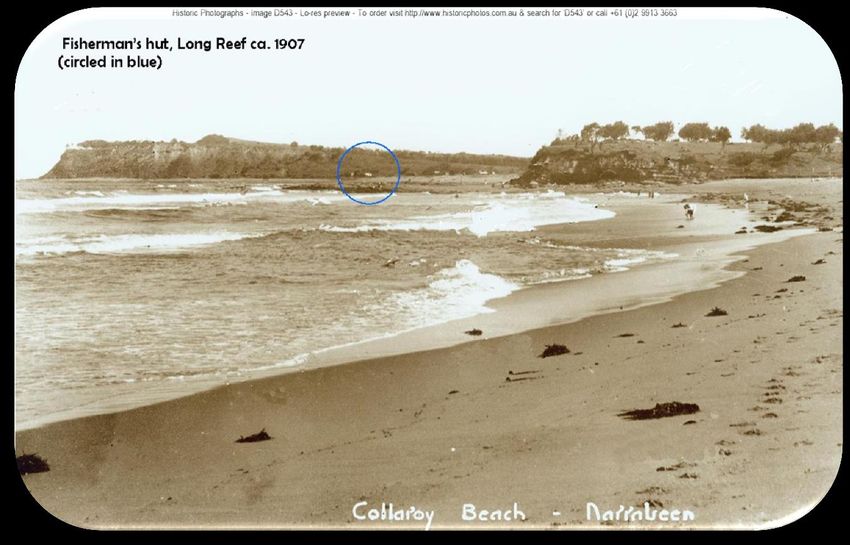
Executive Summary

  1. There has been NO significant sea level rise in the harbour
    for the past 120 years, and what little there has been is
    about the height of a matchbox over a century.

2. Along the northern beaches of Sydney, at Collaroy there
   has been no suggestion of any sea level rise there for the
   past 140 years. Casual observations from Bondi Beach
   1875 to the present also suggest the same benign
   situation.

3. A rush to judgement by local councils and State
   Governments by legislating harsh laws and building
   covenants along our coastlines now seems misplaced.

4. The falsehoods and mendacity of the IPCC and climate
   alarmists should be rejected out of hand, and efforts be
   made to ensure that science, not propaganda, defines our
   school curricula in matters of climate and sea levels

                               2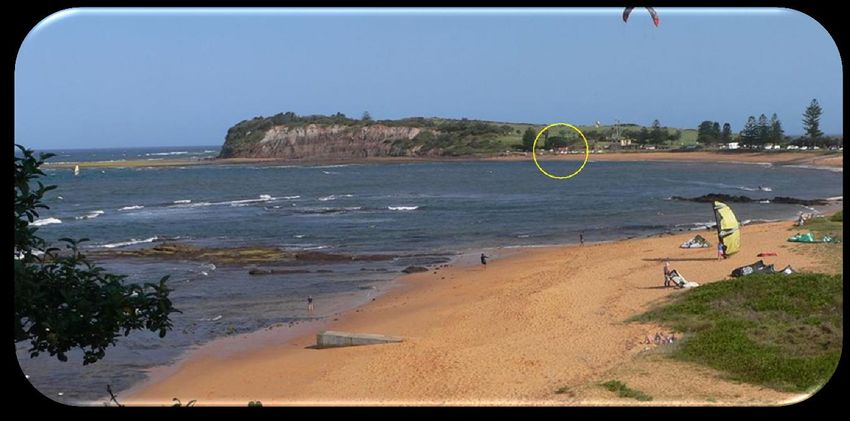
1: The Tide-gauge sea-level arrangements in Sydney Harbour
Our story of sea levels in Sydney Harbour, like the temperature story, also begins at the time of the First
Fleet in 1778, when Captain Arthur Phillip turned his attention to building his new colony. From Sydney
Cove he had a reasonable view of an island of rock sitting in the blue harbour waters a short distance
away, and which was destined to become the site of tidal gauges in the harbour.

This island, about 1 km northeast of Sydney Cove, and only a few hundred square metres in area, was
named “Rock Island” by Phillip. Not only did Captain Phillip have competent recorders of temperature
with him in the First Fleet—he also had stonemasons and plenty of penal labour, and so he set to work
quarrying the top from Rock Island in order to supply the new colony with building stone.

Although much smaller than the infamous Alcatraz, Philip also used the island for punishing convicts for
perceived wrongdoings, and the meagre rations associated with this punishment gave rise to the
alternative name ‘Pinchgut”. With the island (Figure 1) now flattened, it became a splendid foundation
for some fort building. The Fort was designed in 1839, and was built between 1841 and 1857, (You et al.,
2009) characterised by the rounded Martello Tower design popular in European fort-making in the 19th
Century.

As an aside, this style of architecture should not be confused with an Australian thoroughbred
racehorse also called ‘Martello Towers’, a champion who famously won four Class 1 events in 1959,
including the ABC Derby at Randwick in Sydney. His grand dam was named ‘Fort Denison’, so in 1956
the owners of this young foal quite logically named the grey champion ‘Martello Towers”, shown here in
racing fitout in 1959.

Figure 1: Rock Island, or Pinchgut, or Fort Denison, in 1885, built
                 in the style of Martello Towers.

                                                         3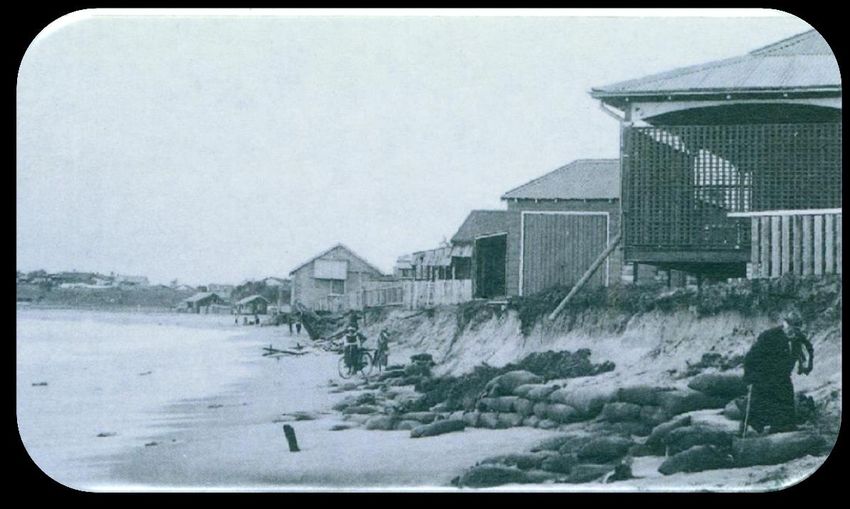
The modern-day Fort Denison is shown in Figure 2. The first tide gauge was installed as Station 65,
which operated from 1886 to 1993. A PSMSL location map, Figure 3 below, suggests that this station
was not actually on or at Fort Denison, but on the nearby shoreline at Cremorne Point. It was replaced
over a period by Station 196, Fort Denison 2, which operated from 1914 to 2013.

Figure 2: View of Fort Denison in Sydney Harbour, looking west through the Sydney Harbour Bridge; Observatory
Hill, site of early to modern temperature measurement, is located west of the freeway, behind the Opera House.

Figure 3: Location map of the three tide gauges, Sydney Harbour; the main two are named Fort Denison 1 and 2,
and this map from the website of PSMSL —. http://www.psmsl.org/data/ suggests that Fort Denison 1 was
located near Cremorne Point, and not actually on Fort Denison Island.

                                                      4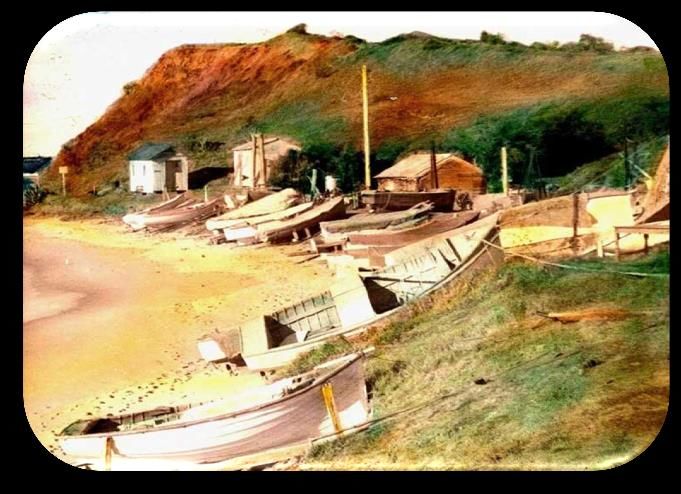
2. The Advent of Sea Level Alarmism around Sydney
With current tide gauge records showing a benign sea level regime, there is less public alarmism in
2018-19 about sea levels generally in New South Wales. To their credit, current governments have
removed alarmist-type comments from many of their development guidelines, but it was not always
thus. From 2008 there were Labor (i.e. Left-wing) governments entrenched in power federally (Prime
Minister Rudd) and at State Level (Premier Nathan Rees).

In 2008 the State (Labor) government of NSW undertook a study of Fort Denison and its long term
future in light of IPCC-predicted sea level rises. Watson and Lord (2008) produced a report on the so-
called ‘vulnerability’ of Fort Denison based on sea level rises due to climate change of from around 4-
38cm and 16-89cm by 2050 and 2100, respectively. They noted that the Fort could cope with up to
20cm of sea level rise, but beyond that the Fort would require major internal reconstruction to cope
with rising sea levels.

This seduction of State Governments by the IPCC resulted in the state government adopting as policy
sea level benchmarks of 40cm above 1990 levels by 2050, and 90cm above 1990 levels by 2100. These
levels were proscribed and mandated to apply to local council development decisions up and down the
NSW coastline, resulting in confusion and despair as property owners saw their coastal land devalued
overnight, with the looming prospect of houses and property being demolished and removed from
coastal land threatened by projected sea level rise. With the election of a Conservative state
government in 2011, this policy was reviewed, resulting in its removal. The following new guidelines
were introduced, passing responsibility for coastal management to local councils viz.

       “Councils will be responsible for selecting a medium to long term sea level rise
       scenario that is appropriate for their local situation. Depending on competent
       scientific opinion, Councils may choose from low or high sea level rise projections. “

Despite this apparent relaxation of harsh planning laws, there remains a level of alarmism within
bureaucracies and both state political parties. Aspiring politicians appear quick to declare that ‘climate
change is real and the science is settled”, despite all evidence to the contrary. The issue of climate
catastrophe was trotted out in full view during major severe coastal storms in June 2016, which had
strong wind directions, (and hence strong wave actions) from the northeast.

                                                                      These storms produced major
                                                                       erosion along Collaroy beach, where
                                                                       major house and unit development
                                                                       flourished right along the original
                                                                       dune system. Large rock walls are
                                                                       the only defence available against
                                                                       storm-induced erosion that has
                                                                       happened periodically through
                                                                       recent history. Rising sea levels had
                                                                       no influence on this erosional
                                                                       mayhem at Collaroy (see Figures
                                                                       5,6, and 7)

Figure 4: Collaroy beach viewed to the NNW, 1920s; note the holiday home development along the tops of active
dune systems. It was this area that suffered most in storms directed from the NE.

                                                      5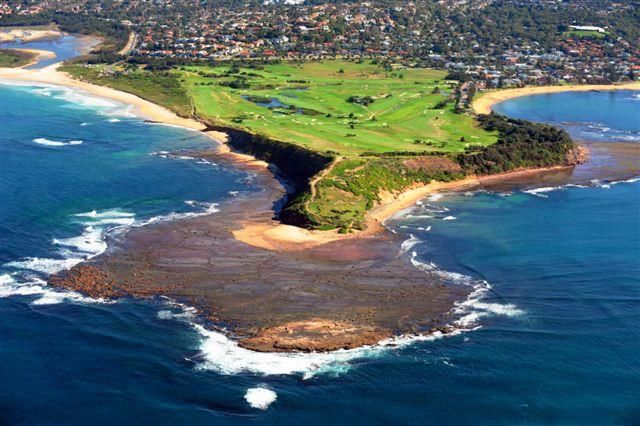
Figure 5:
                                       Historic beach
                                       erosion at
                                       Collaroy in the
                                       1920s. View to
                                       South

Figure 6: Beach erosion
at Collaroy beach, 6th
June 2016; note
swimming pool as
reference point

                              Figure 7: Same beach
                              erosion as in Figure 6, 6th
                              June      2016;       note
                              swimming        pool     as
                              reference point. Current
                              regulations along the
                              coast do not allow any
                              future building along the
                              dune foreshore

                          6
3: The Tide-gauge sea-level record in Sydney Harbour
We have seen earlier the locations of tide gauges in Sydney Harbour. From these gauges there is a
continuous recording of sea levels in the harbour for about 130 years, from 1886 to the present. A
graphical representation of observations is shown in Figures 8 (Station 65) and Figure 9 (Station 196).
This data comes from the Permanent Service for Mean Sea Level, or PSMSL, based in the UK at
Liverpool. The data here is also used by NOAA in its contribution to Sea Level discussion.

                     Station 65—Ft Denison 1

Figure 8: Sea level data from Station 65 at Fort Denison 1, Sydney Harbour, 1886-1993 —data source PSMSL.

             Station 196 –Ft Denison 2

Figure 9: Sea Level data from station 196 at Fort Denison 2, Sydney Harbour, 1914—2017; data source PSMSL.

                                                      7
Data for the Camp Cove station is shown in Figure 10 below. The record for Camp Cove is relatively
short, being the 41 years from 1948 to 1989. Of all three available records, this Camp Cove data shows
statistically ZERO sea level rise.

                    Station 549 –Camp Cove

Figure 10: Sea Level data from station 196 at Camp Cove, Sydney Harbour, 1948—1989; data source PSMSL

The NOAA data (http://tidesandcurrents.noaa.gov) is shown in Figure 11 below, and appears to combine
readings from the two stations 65 and 196 on Fort Denison, providing a sea level record of 124 years
from 1886 to 2010. The trend of 0.65mm/yr is below the world average of about 3.1mm/year, and
indicates long term stability of the coastal environment in the vicinity of Sydney.

Figure 11: Sea level data combined from two stations on Fort Denison, 1886-2007; the linear regression is given
as 0.65 ± 0.10 mm per year (Watson 2011)

Watson (2011) reported that Fort Denison showed sea level rise of 68mm
between 1940 and 2000, with a decelerating trend of 0.04mm/yr. You, Lord
and Watson (2009) reported a linear regression trend of
0.63±0.14mm/year, which over a century is 63mm, or about the
height of a matchbox. These trends are BELOW global estimates of sea
level rise of about 3.1±0.4mm /year reported by Judith Curry in 2018.

                                                        8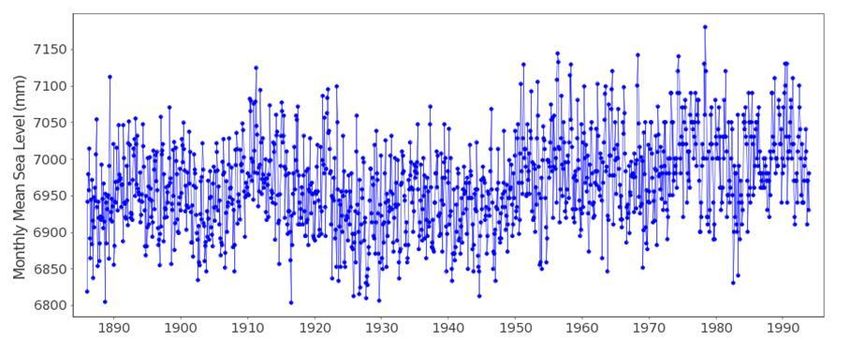
The tide gauge observations for Sydney and environs are replicated in many other places across the
globe. One example used here because of the longevity of the recording is for Honolulu, where sea level
rise is close to 1.5mm/year, measured over the period 1905 to the present.

As depicted in Figure 12, the sea level patterns appear independent of CO2 emissions.

                     Figure 12: Tide gauge data for Honolulu, 1905 to 2018 from PSMSL)

                                                    9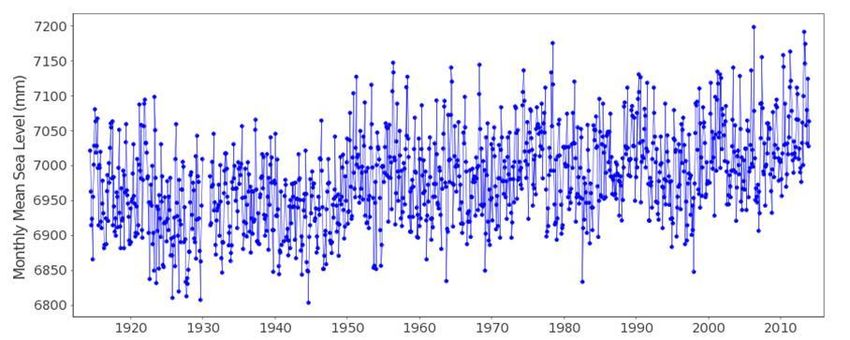
4: Sea level observations for Collaroy beach and Long Reef Headland, 1875
to 2018
Sydney is famous for its beaches, located as they are so close to one of the world’s great cities. Office
workers may take a short ride from the city after work, to enjoy white sandy beaches and curling cooling
blue Pacific Ocean waves at the end of a long summer’s day.
There are no tide gauges on these beaches, but there are long-standing markers which provide visual,
everyday observations about whether the coastal landscape has been bedevilled and altered by sea
level change in the lifetime of most Sydney residents since the mid-19th Century. Most attention is
given to Collaroy beach, about 20km north of Fort Denison in Sydney Harbour, but similar conclusions
can be drawn for Bondi beach. Locations of both Collaroy and Bondi beaches are shown in Figure 13.
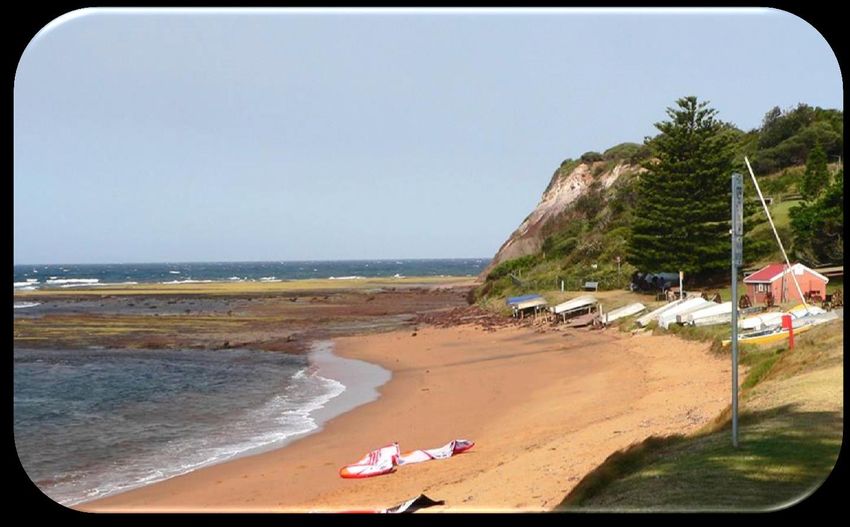
Figure 14: The Long Reef headland at Collaroy, viewed
looking to the west. Collaroy beach is to the right.
Figure 13: Location of Collaroy and Bondi relative to tide
gauges in Sydney Harbour
Figure 14 above shows the Long Reef (or Collaroy)
headland, comprised of reddish shales and sandstone
capped by the scenic but wind-swept Collaroy golf course.
Collaroy beach is to the right (north), and Dee Why beach
to the left, or south. At low tide the Long Reef provides a
scenic platform for rock fishers and beachwalkers; in the early days of Sydney town, from the early
1800s, fishermen used to launch their fishing dories from Collaroy beach, which was relatively calm in
the lee of the headland, protected from the prevailing southeasterly swell. The fishermen and others
built a few small huts in the lee of the headland, and one such hut has survived from 1875 to the
present, thus providing a benchmark for rough estimation of any sea level movements.
10The Fisherman’s Hut at Collaroy basin
Local council records report a sturdy fisherman’s hut was built in 1875 on the north side of Long Reef
headland to support their fishing activities offshore. They constructed the hut above the high water
mark for that time in 1875, and this hut remains intact today, while other cabins have come and gone.
Figure 15 shows the hut in the far distance in 1907. It stands as testimony to a very stable sea level in
this area of eastern Australia for over 140 years.
Figure 15: Long view of the Fisherman’s Hut (circled in blue) at Long Reef, Collaroy—photo taken 1907
Figure 16: A similar view to Figure 14, of the Fisherman’s Hut at Long Reef, Collaroy, circled in yellow—photo
taken 2014. There is no obvious change in beach morphology over the period 1907 to 2014, but Norfolk pines
have grown.
11Images of the Fisherman’s hut built in the 1870s are listed in Warringah Shire archives and reports (e.g.
Haskonning Australia Pty Ltd 2014), and Figures 17 and 18 show the hut in 1936 and 1950, respectively.
Figure 19 shows a recent image taken in January 2014. In all cases, the situation to the eye is that there
has been no demonstrable change to sea levels or the high tide marks in all of the period 1875 to the
present, or about 140 years. This parallels and is consistent with the almost insignificant amount of sea
level change presented for Sydney Harbour.
Figure 17: View of the Fisherman’s Hut at Long Figure 18: View of the Fisherman’s Hut at Long
Reef, Collaroy—photo taken 1936 Reef, Collaroy—photo taken 1950s
Figure 19: View of the Fisherman’s Hut at Long Reef, Collaroy—photo taken Jan. 2014 (GMD); in all images, the
high water mark comes to within 1.5 metre or so of the grassy bank, but there are NO observable effects of any
sea level rise, or indeed coastal erosion, in any of these images
125: The Mendacity of the IPCC and Climate Alarmists
Well-informed people know that the IPCC and other alarmist individuals and organisations constantly
make exaggerated claims of global catastrophe that are unsupported by true scientists, but which are
repeated constantly as a mantra of climate virtue designed to frighten the weak and the gullible,
including politicians; the threat of rising sea levels forms a significant part of this commentary, which is
described here as an act of MENDACITY (Noun) and/or MENDACIOUS (Adjective).
A Dictionary definition is as follows:
Mendacity noun: untruthfulness.
Synonyms: lying, dishonesty, deceit, deception, dissembling, insincerity,
disingenuousness, hypocrisy, fraud, double-dealing, two-timing, duplicity, perjury, perfidy,
falsity, hollowness. . . . .
That should do. Our POSTER CHILD for MENDACITY is former Maldives President Mohammed Nasheed,
who famously held an underwater cabinet meeting in the Maldives in November 2009. The meeting,
chaired by President Mohamed Nasheed, took place around a table 5 metres underwater. Bubbles
ascended from the face masks the president and the Cabinet wore, and fish swam around them. At the
meeting, the Cabinet signed a declaration calling for global cuts in carbon emissions that will be
presented before a U.N. climate summit in Copenhagen, Denmark, in December 2009. Asked what
would happen if Copenhagen fails, the president said, "we are all going to die."
Nasheed has since been ousted from office, and the new Maldives government is front and centre in
promoting high-class tourism on islands only centimetres above the high tide mark. The lying and
hypocrisy is rank, as illustrated in Figures 20 and 21 below .
Figure 20: President Nasheed of the Maldives
signing his ’deathwish’ petition to the IPCC in 2009,
and presented to COP Copenhagen December
2009
Figure 21: The RAFFLES Tourist resort (’Meradhoo’)
on the Maldive island of Gaaufu Alifu Atoll,
February 2019
137: CONCLUSIONS regarding Sea Levels
1. Long term tide gauge records in Sydney Harbour show that there has been NO
significant sea level rise in the harbour for the past 120 years, and what little
there has been is about 0.65mm pa, or about the height of a matchbox over a
century.
2. This compares with global sea level rise measurements from satellites of about
3.4mm pa; some of the sea level data may or may not allow for rising sea or
sinking land, and there remains uncertainty about satellite altimetry as applied
to sea levels.
3. The stability of sea levels in and around Sydney Harbour is also reflected in
unchanged coastal morphology along the beaches at Collaroy, using reference
benchmarks built in 1875.
4. The story of Sydney Harbour is also reflected in tide gauge measurements from
places as far afield as Honolulu. This stability has been with us for at least the
past 200 years, and possibly for at least a century ahead, given that our planet
is likely to be entering a cooling phase at the end of Solar Cycle 24.
5. Those in the IPCC and centres of alarmism constantly exaggerate the degree of
projected sea level rise, using models which hugely over-emphasise the role of
CO2. This is done to frighten gullible populations and to deflect the political
class into taking expensive and unnecessary actions against the best economic
and social interests of the country. The Maldives is such an example of ‘crying
wolf’ in order to attract greater climate funding to its government.
6. All efforts should be made to allow scientific truth to flourish in all of our school
curricula, in spite of ‘progressive’ alarmist attitudes that are thought to be
rampant in the teaching profession.
ooOOoo
14References and Citations
Archibald, D., 2019: “Stop the Climate Stupidity”; the Wentworth Report, first issued 29 Jan 2019.
https://wentworthreport.com/stop-the-climate-stupidity . NOTE: The Wentworth Report supports reality over
political correctness
Curry, J., 2018 Sea level and Climate Change : Special report, Climate Forecast Applications Network, 25 Nov
2018. (pdf, 79pp)
Haskoning Australia P:ty Ltd 2014: Collaroy-Narrabeen Beach and Fisherman’s Beach, CZMP
AppendiX A—General description of photos. Report to Warringah Council, 289pp
Watson, P.J., (2011): Is There Evidence Yet of Acceleration in Mean Sea Level Rise around Mainland Australia?.
Journal of Coastal Research: Volume 27, Issue 2: pp. 368 – 377.
Watson P.J and D.B Lord (2008). “Fort Denison Sea Level Rise Vulnerability Study”, a report prepared by the
Coastal Unit, NSW Department of Environment and Climate Change, October.
You, Zai-Jin; Lord, Doug and Watson, Phil. 2009: Estimation of relative mean sea level rise from Fort Denison tide
gauge data [online]. In: Coasts and Ports 2009: In a Dynamic Environment. [Wellington, N.Z.]: Engineers Australia,
2009: [587]-[592].
http://tidesandcurrents.noaa.gov/sltrends/sltrends_global_station.htm;jsessionid=D82367E516AA8A6B3EEBDBB
0588DBBF3?stnid=680-140 – website for NOAA sea level chart for Fort Denison.
Dr Geoff Derrick
G M Derrick Geology
Brisbane, Australia
Email: geoffd@powerup.com.au
February 2019
15You can also read