SEARCH FOR SUPERSYMMETRY IN EVENTS WITH A PHOTON, JETS, B-JETS, AND MISSING TRANSVERSE MOMENTUM IN PROTON-PROTON COLLISIONS AT 13 TEV - ARTS
←
→
Page content transcription
If your browser does not render page correctly, please read the page content below
Eur. Phys. J. C      (2019) 79:444
https://doi.org/10.1140/epjc/s10052-019-6926-x

 Regular Article - Experimental Physics

Search for supersymmetry in events with a photon, jets, b-jets, and
missing transverse momentum in proton–proton collisions at
13 TeV
CMS Collaboration∗
CERN, 1211 Geneva 23, Switzerland

Received: 20 January 2019 / Accepted: 3 May 2019
© CERN for the benefit of the CMS collaboration 2019

Abstract A search for supersymmetry is presented based               Supersymmetric models predict a bosonic superpartner
on events with at least one photon, jets, and large missing      for each SM fermion and a fermionic superpartner for each
transverse momentum produced in proton–proton collisions         SM boson; each new particle’s spin differs from that of
at a center-of-mass energy of 13 TeV. The data correspond        its SM partner by half a unit. SUSY also includes a sec-
to an integrated luminosity of 35.9 fb−1 and were recorded       ond Higgs doublet. New colored states, such as gluinos (     g)
at the LHC with the CMS detector in 2016. The analysis           and top squarks (  t), the superpartners of the gluon and the
characterizes signal-like events by categorizing the data into   top quark, respectively, are expected to have masses on the
various signal regions based on the number of jets, the num-     order of 1 TeV to avoid fine tuning in the SM Higgs boson
ber of b-tagged jets, and the missing transverse momentum.       mass-squared term. In models that conserve R-parity [17],
No significant excess of events is observed with respect to      each superpartner carries a conserved quantum number that
the expectations from standard model processes. Limits are       requires superpartners to be produced in pairs and causes the
placed on the gluino and top squark pair production cross        lightest SUSY particle (LSP) to be stable. The stable LSP
sections using several simplified models of supersymmet-         can serve as a DM candidate.
ric particle production with gauge-mediated supersymmetry            The signatures targeted in this paper are motivated by
breaking. Depending on the model and the mass of the next-       models in which gauge-mediated SUSY breaking (GMSB)
to-lightest supersymmetric particle, the production of gluinos   is responsible for separating the masses of the SUSY par-
with masses as large as 2120 GeV and the production of top       ticles from those of their SM counterparts. In GMSB mod-
squarks with masses as large as 1230 GeV are excluded at         els, the gaugino masses are expected to be proportional to
95% confidence level.                                            the size of their fundamental couplings. This includes the
                                                                 superpartner of the graviton, the gravitino ( G), whose mass
                                                                 is proportional to MSB /MPl , where MSB represents the scale
1 Introduction                                                   of the SUSY breaking interactions and MPl is the Planck
                                                                 scale where gravity is expected to become strong. GMSB
The standard model (SM) of particle physics successfully         permits a significantly lower symmetry-breaking scale than,
describes many phenomena, but lacks several necessary ele-       e.g., gravity mediation, and therefore generically predicts
ments to provide a complete description of nature, including     that the G is the LSP [18–20], with a mass often much less
a source for the relic abundance of dark matter (DM) [1,2]       than 1 GeV. Correspondingly, the next-to-LSP (NLSP) is typ-
in the universe. In addition, the SM must resort to fine tun-    ically a neutralino, a superposition of the superpartners of the
ing [3–6] to explain the hierarchy between the Planck mass       neutral bosons. The details of the quantum numbers of the
scale and the electroweak scale set by the vacuum expectation    NLSP play a large part in determining the phenomenology
value of the Higgs field, the existence of which was recently    of GMSB models, including the relative frequencies of the
confirmed by the observation of the Higgs boson (H) [7,8].       Higgs bosons, Z bosons, and photons produced in the NLSP
Supersymmetry (SUSY) [9–16] is an extension of the SM            decay.
that can provide both a viable DM candidate and additional           The scenario of a natural SUSY spectrum with GMSB
particles that inherently cancel large quantum corrections to    and R-parity conservation typically manifests as events with
the Higgs boson mass-squared term from the SM fields.            multiple jets, at least one photon, and large pTmiss , the mag-
                                                                 nitude of the missing transverse momentum. Depending on
 e-mail:   cms-publication-committee-chair@cern.ch              the topology, these jets can arise from either light-flavored

                                         0123456789().: V,-vol                                                        123
444 Page 2 of 26 Eur. Phys. J. C (2019) 79:444
Fig. 1 Example diagrams q b
depicting the simplified models p q̄ p b̄
used, which are defined in the
text. The top left diagram g̃ H g̃ Z
depicts the T5qqqqHG model, χ̃01 G̃ χ̃01 G̃
the top right diagram depicts the
T5bbbbZG model, the bottom χ̃01 G̃ χ̃01 G̃
left diagram depicts the g̃ γ g̃ γ
T5ttttZG model, and the bottom
p q p b
right depicts the T6ttZG model q̄ b̄
t
p t̄ p t
g̃ Z t̃ Z
χ̃01 G̃ χ̃01 G̃
χ̃01 G̃ χ̃01 G̃
g̃ γ ¯t̃
γ
p t p
t̄ t̄
quarks (u, d, s, c) or b quarks. We study four simplified mod- an excess of observed data events compared to the expected
els [21–25]; example diagrams depicting these models are background yields.
shown in Fig. 1. Three models involve gluino pair produc- Previous searches for R-parity conserving SUSY with
tion (prefixed with T5), and one model involves top squark photons in the final state performed by the CMS Collabora-
pair production (prefixed with T6). In the T5qqqqHG model, tion are documented in Refs. [27,28]. Similar searches have
each gluino decays to a pair of light-flavored quarks (qq) also been performed by the ATLAS Collaboration [29–31].
and a neutralino ( χ10 ). The T5bbbbZG and T5ttttZG models This work improves on the previous results by identifying
are similar to T5qqqqHG, except that the each pair of light- jets from b quarks, which can be produced by all of the sig-
flavored quarks is replaced by a pair of bottom quarks (bb) nal models shown in Fig. 1. We also include additional signal
or a pair of top quarks (tt), respectively. In the T5qqqqHG regions that exploit high jet multiplicities for sensitivity to
model, the χ 10 decays either to an SM Higgs boson and a G high-mass gluino models, and we rely more on observed data
or to a photon and a G. The χ10 → H G branching fraction is for the background estimations. These improvements enable
assumed to be 50%, and the smallest χ 10 mass considered is us to explore targeted signal models that produce b quarks in
127 GeV. In the T5bbbbZG and T5ttttZG models, the neu- the final state and are expected to improve sensitivity to the
tralinos decay to Z G and γ G with equal probability. The models explored in Refs. [27–31].
T6ttZG model considers top squark pair production, with In this paper, a description of the CMS detector and simu-
each top squark decaying into a top quark and a neutralino. lation used are presented in Sect. 2. The event reconstruction
The neutralino can then decay with equal probability to a and signal region selections are presented in Sect. 3. The
photon and a G or to a Z boson and a G. For the models methods used for predicting the SM backgrounds are pre-
involving the decay χ 10 → Z G, we probe χ 10 masses down sented in Sect. 4. Results are given in Sect. 5. The analysis
to 10 GeV. All decays of SUSY particles are assumed to be is summarized in Sect. 6.
prompt. In all models, the mass m G is fixed to be 1 GeV, to
be consistent with other published results. For the parameter
space explored here, the kinematic properties do not depend
2 Detector and simulation
strongly on the exact value of m G.
The proton–proton (pp) collision data used in this search
A detailed description of the CMS detector, along with a
correspond to an integrated luminosity of 35.9 fb−1 and were
definition of the coordinate system and pertinent kinematic
collected with the CMS detector during the 2016 run of the
variables, is given in Ref. [32]. Briefly, a cylindrical super-
CERN LHC [26]. Signal-like events with at least one photon
conducting solenoid with an inner diameter of 6 m provides
are classified into signal regions depending on the number
a 3.8 T axial magnetic field. Within the cylindrical volume
of jets Njets , the number of tagged bottom quark jets Nb-jets ,
are a silicon pixel and strip tracker, a lead tungstate crystal
and the pTmiss . The expected yields from SM backgrounds are
electromagnetic calorimeter (ECAL), and a brass and scin-
estimated using a combination of simulation and data control
tillator hadron calorimeter (HCAL). The tracking detectors
regions. We search for gluino or top squark pair production as
cover the pseudorapidity range |η| < 2.5. The ECAL and
123Eur. Phys. J. C (2019) 79:444 Page 3 of 26 444
HCAL, each composed of a barrel and two endcap sections, 3 Event reconstruction and selection
cover |η| < 3.0. Forward calorimeters extend the coverage
to 3.0 < |η| < 5.0. Muons are detected within |η| < 2.4 by The CMS particle-flow (PF) algorithm [53] aims to recon-
gas-ionization detectors embedded in the steel flux-return struct every particle in each event, using an optimal combina-
yoke outside the solenoid. The detector is nearly hermetic, tion of information from all detector systems. Particle candi-
permitting accurate measurements of pTmiss . The CMS trigger dates are identified as charged hadrons, neutral hadrons, elec-
is described in Ref. [33]. trons, photons, or muons. For electron and photon PF candi-
Monte Carlo (MC) simulation is used to design the anal- dates, further requirements are applied to the ECAL shower
ysis, to provide input for background estimation methods shape and the ratio of associated energies in the ECAL and
that use data control regions, and to predict event rates HCAL [54,55]. Similarly, for muon PF candidates, further
from simplified models. Simulated SM background pro- requirements are applied to the matching between track seg-
cesses include jets produced through the strong interac- ments in the silicon tracker and the muon detectors [56].
tion, referred to as quantum chromodynamics (QCD) multi- These further requirements improve the quality of the recon-
jets, tt+jets, W+jets, Z+jets, γ +jets, ttγ , tγ , and Vγ +jets struction. Electron and muon candidates are restricted to
(V = Z, W). The SM background events are generated |η| < 2.5 and < 2.4, respectively. The pTmiss is calculated
using the MadGraph5_amc@nlo v2.2.2 or v2.3.3 gen- as the magnitude of the negative vector pT sum of all PF
erator [34–36] at leading order (LO) in perturbative QCD, candidates.
except ttγ and tγ , which are generated at next-to-leading After all interaction vertices are reconstructed, the primary
order (NLO). The cross sections used for normalization pp interaction vertex is selected as the vertex with the largest
are computed at NLO or next-to-NLO [34,37–39]. The pT2 sum of all physics objects. The physics objects used in this
QCD multijets, diboson (Vγ ), top quark, and vector boson calculation are produced by a jet-finding algorithm [57,58]
plus jets events are generated with up to two, two, three, applied to all charged-particle tracks associated to the ver-
and four additional partons in the matrix element calcula- tex, plus the corresponding pTmiss computed from those jets.
tions, respectively. Any duplication of events between pairs To mitigate the effect of secondary pp interactions (pileup),
of related processes – QCD multijets and γ +jets; tt+jets charged-particle tracks associated with vertices other than
and ttγ ; W+jets and Wγ +jets– is removed using generator the primary vertex are not considered for jet clustering or
information. calculating object isolation sums.
The NNPDF3.0 [40] LO (NLO) parton distribution func- Jets are reconstructed by clustering PF candidates using
tions (PDFs) are used for samples simulated at LO (NLO). the anti-kT jet algorithm [57,58] with a size parameter of 0.4.
Parton showering and hadronization are described using To eliminate spurious jets, for example those induced by elec-
the pythia 8.212 generator [41] with the CUETP8M1 tronics noise, further jet quality criteria [59] are applied. The
underlying event tune [42]. Partons generated with Mad- jet energy response is corrected for the nonlinear response
Graph5_amc@nlo and pythia that would otherwise be of the detector [60]. There is also a correction to account for
counted twice are removed using the MLM [43] and the expected contributions of neutral particles from pileup,
FxFx [44] matching schemes in LO and NLO samples, which cannot be removed based on association with sec-
respectively. ondary vertices [61]. Jets are required to have pT > 30 GeV
Signal samples are simulated at LO using the Mad- and are restricted to be within |η| < 2.4. The combined
Graph5_amc@nlo v2.3.3 generator and their yields are secondary vertex algorithm (CSVv2) at the medium work-
normalized using NLO plus next-to-leading logarithmic ing point [62] is applied to each jet to determine if it should
(NLL) cross sections [45–49]. The decays of gluinos, top be identified as a bottom quark jet. The CSVv2 algorithm
squarks, and neutralinos are modeled with pythia. at the specified working point has a 55% efficiency to cor-
The detector response to particles produced in the simu- rectly identify b jets with pT ≈ 30 GeV. The corresponding
lated collisions is modeled with the Geant4 [50] detector misidentification probabilities are 1.6% for gluon and light-
simulation package for SM processes. Because of the large flavor quark jets, and 12% for charm quark jets.
number of SUSY signals considered, with various gluino, Photons with pT > 100 GeV and |η| < 2.4 are used
squark, and neutralino masses, the detector response for these in this analysis, excluding the ECAL transition region with
processes is simulated with the CMS fast simulation [51,52]. 1.44 < |η| < 1.56. To suppress jets erroneously identified
The results from the fast simulation generally agree with as photons from neutral hadron decays, photon candidates
the results from the full simulation. Where there is dis- are required
√ to be isolated. An isolation cone of radius
agreement, corrections are applied, most notably a correc- ΔR = (Δφ)2 + (Δη)2 < 0.2 is used, with no depen-
tion of up to 10% to adjust for differences in the modeling of dence on the pT of the photon candidate. Here, φ is the
pTmiss . azimuthal angle in radians. The energy measured in the iso-
lation cone is corrected for contributions from pileup [61].
123444 Page 4 of 26 Eur. Phys. J. C (2019) 79:444
The shower shape and the fractions of hadronic and elec- duce a leptonically decaying W boson, resulting in pTmiss
tromagnetic energy associated with the photon candidate are from the undetected neutrino, events are rejected if they
required to be consistent with expectations from prompt pho- have any charged light leptons (e, μ) with pT > 10 GeV or
tons. The candidates matched to a track measured by the pixel any isolated electron, muon, or charged hadron tracks with
detector (pixel seed) are rejected because they are likely to pT > 5, 5, 10 GeV, respectively. Events from the γ +jets pro-
result from electrons that produced electromagnetic showers. cess typically satisfy the above criteria when the energy of a
Similarly, to suppress jets erroneously identified as lep- jet is mismeasured, inducing artificial pTmiss . To reject these
tons and genuine leptons from hadron decays, electron and events, the two highest pT jets are both required to have
muon candidates are also subjected to isolation requirements. an angular separation from the pTmiss direction in the trans-
The isolation variable I is computed from the scalar pT sum verse plane, Δφ1,2 > 0.3. Events with reconstruction fail-
of selected charged hadron, neutral hadron, and photon PF ures, detector noise, or beam halo interactions are rejected
candidates, divided by the lepton pT . PF candidates enter using dedicated identification requirements [64].
the isolation sum if they satisfy R < R I ( pT ). The cone The selected events are divided into 25 exclusive signal
radius R I decreases with lepton pT because the collimation regions, also called signal bins, based on pTmiss , the num-
of the decay products of the parent particle of the lepton ber of jets Njets , and the number of b-tagged jets Nb-jets .
increases with the Lorentz boost of the parent [63]. The val- The signal regions can be grouped into 6 categories based
ues used are R I = 0.2 for pT < 50 GeV, R I = 10 GeV/ pT on Njets and Nb-jets , whose intervals are defined to be Njets :
for 50 ≤ pT ≤ 200 GeV, and R I = 0.05 for pT > 200 GeV, 2–4, 5–6, ≥7; and Nb-jets : 0, ≥1. Within each of the 6 cat-
where = e, μ. As with photons, the expected contributions egories, events are further distinguished based on 4 exclu-
from pileup are subtracted from the isolation variable. The sive regions, defined as: 200< pTmiss 750 GeV.
hadron, and satisfy an isolation requirement computed using Events with 100 < pTmiss < 200 GeV are used as a control
tracks. Isolated hadronic tracks are common in background region for estimating SM backgrounds. These categories in
events with a tau lepton that decays hadronically. The track Njets , Nb-jets , and pTmiss were found to provide good sensi-
isolation variable Itrack is computed for each candidate from tivity to the various signal models described above, while
the scalar pT sum of selected other charged-particle tracks, minimizing uncertainties in the background predictions.
divided by the candidate pT . Other charged-particle tracks
are selected if they lie within a cone of radius 0.3 around 4 Background estimation
the candidate direction and come from the primary vertex.
The isolation variable must satisfy Itrack < 0.2 for elec- There are four main mechanisms by which SM processes can
trons and muons, and Itrack < 0.1 for charged hadrons. produce events with the target signature of a photon, multiple
Isolated tracks are required to satisfy |η| < 2.4, and the jets, and pTmiss . These mechanisms are: (1) the production of
transverse mass of each isolated track with pTmiss , m T = a high- pT photon along with a W or Z boson that decays lep-
√
2 pTtrack pTmiss (1 − cos Δφ) where Δφ is the difference in φ tonically, and either any resulting electron or muon is “lost”
between pTtrack and pTmiss , is required to be less than 100 GeV. (lost-lepton) or any resulting τ lepton decays hadronically
Signal event candidates were recorded by requiring a pho- (τh ); (2) the production of a W boson that decays to eν and
γ
ton at the trigger level with a requirement pT > 90 GeV the electron is misidentified as a photon; (3) the production
γ γ jet γ of a high- pT photon in association with a Z boson that decays
if HT = pT + Σ pT > 600 GeV and pT > 165 GeV other-
wise. These quantities are computed at the trigger level. The to neutrinos; and (4) the production of a photon along with a
efficiency of this trigger, as measured in data, is (98 ± 2)% jet that is mismeasured, inducing high pTmiss . QCD multijet
after applying the selection criteria described below. Addi- events with a jet misidentified as a photon and a mismeasured
tional triggers, requiring the presence of charged leptons, jet do not contribute significantly to the SM background.
jet The total event yield from each source of background is
photons, or minimum HT = Σ pT , are used to select control
estimated separately for each of the 25 signal regions. The
samples employed in the evaluation of backgrounds.
methods and uncertainties associated with the background
Signal-like candidate events must fulfill one of two
predictions are detailed in the following sections.
requirements, based on the trigger criteria described above:
γ γ γ
pT > 100 GeV and HT > 800 GeV, or pT > 190 GeV and
γ
HT > 500 GeV. In addition to these requirements, the 4.1 Lost-lepton and τh backgrounds
events should have at least 2 jets and pTmiss > 100 GeV.
To reduce backgrounds from the SM processes that pro- The lost-lepton background arises from events in which the
charged lepton from a leptonically decaying W boson, pro-
123Eur. Phys. J. C (2019) 79:444 Page 5 of 26 444
CMS Simulation 35.9 fb-1 (13 TeV)
duced directly or from the decay of a top quark, cannot be
Events
Expected Predicted
identified. This can occur because the lepton is out of accep- N 02-4 N 05-6 N 0≥7 ≥1
N 2-4 ≥1
N 5-6 N ≥≥17
102
tance, fails the identification requirements, or fails the isola-
tion requirements. For example, in events with high- pT top 10
quarks, the top quark decay products will be collimated, forc-
ing the b jet to be closer to the charged lepton. In this case, 1
the lepton is more likely to fail the isolation requirements.
Exp. / Pred.
This background is estimated by studying control regions in 1.5
both data and simulation, obtained by requiring both a well- 1
0.5
identified photon and a light lepton (e, μ). For every signal
5 10 15 20 25 30
region, there are two lost lepton control regions that have Bin number
the exact same definition as the signal region except either
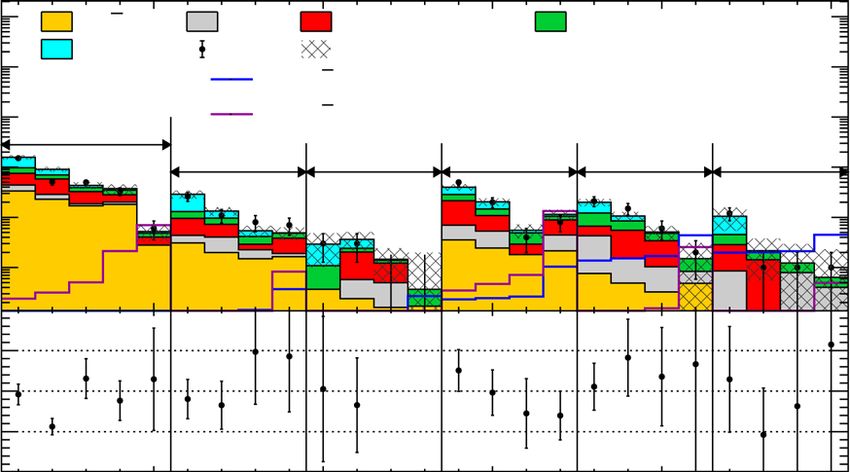
exactly one electron or exactly one muon is required. Fig. 2 The lost-lepton and τh event yields as predicted directly from
simulation in the signal regions, shown in red, and from the prediction
The τh background arises from events in which a W boson
procedure applied to simulated eγ or μγ events, shown in blue. The
decays to a τ lepton, which subsequently decays to mesons error bars correspond to the statistical uncertainties from the limited
and a neutrino. These hadronic decays of τ leptons occur number of events in simulation. The bottom panel shows the ratio of
approximately 65% of the time. Because of lepton univer- the simulation expectation (Exp.) and the simulation-based prediction
(Pred.). The hashed area shows the expected uncertainties from data-
sality, the fraction of events with τh candidates can be esti-
to-simulation correction factors, PDFs, and renormalization and fac-
mated from the yield of events containing a single muon, torization scales. The categories, denoted by dashed lines, are labeled
after correcting for the reconstruction differences and for the as Njb , where j refers to the number of jets and b refers to the num-
τh branching fraction. ber of b-tagged jets. The numbered bins within each category are the
various pTmiss bins. In each of these regions, the first bin corresponds
The lost-lepton and τh background predictions rely on an
to 100 < pTmiss < 200 GeV, which belongs to a control region. The
extrapolation between eγ or μγ event yields and single pho- remaining bins correspond to the signal regions in Table 1
ton event yields. In all control regions where a single light
lepton is required, the dominant SM processes that contribute
are Wγ and ttγ . Lost-muon and hadronic tau events are esti-
mated using μγ control regions, while lost-electron events factors is validated using simulation by treating eγ or μγ
are estimated using eγ control regions. In each control region, events like data and comparing the predicted lost-lepton and
exactly one electron or muon is required and the isolated τh event yields to the true simulated event yields in the signal
track veto for the selected lepton flavor is removed. In order regions. This comparison is shown in Fig. 2. The prediction
pred
to reduce the effect of signal contamination and to increase in each signal region is N = Σi Ni T,i , where = e, μ
the fraction of SM events in the control sample, events are and i ranges from 1 to n, where n is the number of transfer
only selected if the m T of the lepton- pTmiss system is less than factors that contribute in a given signal region.
100 GeV. In SM background events with a single lepton and The dominant uncertainty in the lost-lepton background
pTmiss , the m T of the system is constrained by the mass of the predictions arises from the limited numbers of events in the
W boson; this is not the case for signal events, because of the eγ and μγ control regions. These uncertainties are modeled
presence of gravitinos. All other kinematic variable require- in the final statistical interpretations as a gamma distribu-
ments for each signal region are applied to the corresponding tion whose shape parameter is set by the observed number
control regions. of events and whose scale parameter is the average trans-
Transfer factors are derived using simulated Wγ +jets fer factor for that bin. Other systematic uncertainties in the
and ttγ processes, which determine the average number of determination of the transfer factors include the statistical
events expected in the signal region for each eγ or μγ event uncertainty from the limited number of simulated events,
observed in the control region. The Zγ events in which the which is typically 5–10% but can be as large as 20%, as well
Z boson decays leptonically have a negligible contribution as uncertainties in the jet energy corrections, PDFs, renor-
to the transfer factors. The transfer factors applied to the μγ malization (μR ) and factorization (μF ) scales, and simula-
control regions account for both lost-μ events and τh events. tion correction factors. The uncertainties in μR and μF are
They are denoted by the symbol Tμ,τ and are typically in the obtained by varying each value independently by factors of
range 0.7 < Tμ,τ < 1.0. The transfer factors applied to eγ 0.5 and 2.0 [65,66]. Simulation correction factors are used
events account for only the lost-e events. They are denoted by to account for differences between the observed data and
the symbol Te and are typically in the range 0.3 < Te < 0.6. modeling of b-tagging efficiencies, b jet misidentification,
The transfer factors are parameterized versus Njets , Nb-jets , and lepton reconstruction efficiencies in simulation. One of
and pTmiss ; however, for pTmiss > 150 GeV, T is found to be the largest uncertainties, apart from the statistical uncertainty
independent of pTmiss . The parameterization of the transfer in the data control regions and the simulation, comes from
123444 Page 6 of 26 Eur. Phys. J. C (2019) 79:444
mismodeling of photons which are collinear with electrons, cation rate is computed as the ratio Neγ /Ne+ e− , where Neγ
which has a 12% effect on the lost-lepton prediction. (Ne+ e− ) is the number of events in the eγ (e+ e− ) control
region. It is found to be 15–20% higher in data than in sim-
4.2 Misidentified photon background ulation.
The prediction of the misidentified-photon background in
Events containing the decay W → eν are the primary source the signal region is then given by the weighted sum of the
of electrons that are erroneously identified as photons. Pho- observed events in the control region, where the weight is
ton misidentification can occur when a pixel detector seed given by the data-corrected misidentification rate for pho-
fails to be associated with the energy deposit in the ECAL. tons. The dominant uncertainty in the prediction is a 14%
Given a misidentification rate, which relates events with an uncertainty in the data-to-simulation correction factors, fol-
erroneously identified photon to events with a well-identified lowed by the uncertainty in the limited number of events in
electron, the photon background can be estimated from a the simulation at large values of pTmiss . The misidentified-
single-electron (zero-photon) control region. The misidenti- photon background prediction also includes uncertainties in
fication rate is estimated in simulation and corrections are the modeling of initial-state radiation (ISR) in the simulation,
derived from observed data to account for any mismodeling statistical uncertainties from the limited number of events in
in simulation. the data control regions, uncertainties in the pileup modeling,
The single-electron control regions are defined by the and uncertainties in the trigger efficiency measurement.
same kinematic requirements as the single-photon signal
regions, except that we require no photons and exactly one 4.3 Background from Z(νν)γ events
electron, and we use the momentum of the electron in place
of the momentum of the photon for photon-based variables. Decays of the Z boson to invisible particles constitute a major
As explained in the previous section, in addition to all of background for events with low Njets , low Nb-jets , and high
the signal region selections, events are required to satisfy pTmiss . The Z(νν)γ background is estimated using Z(+ − )γ
m T (e, pTmiss ) < 100 GeV. events. The shape of the distribution of pTmiss vs. Njets in
To extrapolate from the event yields in the single-electron Z(νν)γ events is modeled in simulation, while the normal-
control regions to the event yields for the misidentified pho- ization and the purity of the control region are measured in
ton background in the signal regions, we derive a misiden- data.
tification rate f = Nγ /Ne using a combination of simu- Events in the + − γ control region are required to have
lation and data. The misidentification rate is determined as exactly two oppositely charged, same-flavor leptons ( = e
a function of the electron pT and the multiplicity Q mult of or μ) and one photon with pT > 100 GeV. The dilepton
charged-particle tracks from the primary vertex in a region invariant mass m is required to be consistent with the
around the electron candidate. The charged-track multiplic- Z boson mass, 80 < m < 100 GeV. The charged lep-
ity is computed by counting the number of charged PF can- tons serve as a proxy for neutrinos, so the event-level kine-
didates (electrons, muons, hadrons) in the jet closest to the matic variables, such as pTmiss , are calculated after removing
electron candidate. If there is no jet within ΔR < 0.3 of the charged leptons from the event.
electron candidate, Q mult is set to zero. A typical event in The + − γ control region may contain a small fraction of
the single-electron control region has a Q mult of 3–4. The events from processes other than Z(+ − )γ , primarily ttγ .
electron pT and Q mult dependence of the misidentification We define the purity of the control region as the percentage
rate is derived using simulated W+jets and tt+jets events. The of events originating from the Z(+ − )γ process. The purity
misidentification rate is on average 1–2%, but can be as low is computed in data by measuring the number of events in
as 0.5% for events with high Q mult . the corresponding oppositely charged, different-flavor con-
To account for systematic differences between the mis- trol region, which has a higher proportion of ttγ events. The
identification rates in data and simulation, we correct the purity is found to be (97 ± 3)%. A statistically compatible
misidentification rate by measuring it in both simulated purity is also measured in the oppositely charged, same-flavor
and observed Drell–Yan (DY) events. Separate corrections control region. In this region, the m distribution is used to
are derived for low Q mult (≤1) and high Q mult (≥2). extrapolate from the number of events with m far from the
The DY control region is defined by requiring one elec- Z boson mass to the number of events with m close to it.
tron with pT > 40 GeV and another reconstructed parti- The Z(νν)γ predictions from simulation are scaled to
cle, either a photon or an oppositely charged electron, with the total Z(+ − )γ yield observed according to NZ(νν)γ =
pT > 100 GeV. A further requirement 50 < (m e+ e− or m eγ ) β Rνν/ NZ(+ − )γ , where β is the purity of the Z(+ − )γ
< 130 GeV is applied to ensure the particles are consistent control region and Rνν/ is the ratio between the expected
with the decay products of a Z boson, and therefore the pho- number of Z(νν)γ and Z(+ − )γ events. The ratio Rνν/ ,
ton is likely to be a misidentified electron. The misidentifi- which accounts for lepton reconstruction effects and the rel-
123Eur. Phys. J. C (2019) 79:444 Page 7 of 26 444
ative branching fractions for Z → νν and Z → + − , is CMS 35.9 fb-1 (13 TeV)
Double ratio (κ )
Data
determined from simulation. 0.5 Sim.
The primary uncertainty in the Z(νν)γ prediction arises
from uncertainties in the pTmiss distribution from the simula- 0.45
tion. Other uncertainties include statistical uncertainties from 0.4
the limited number of events in the simulation and uncertain-
γ 0.35
ties in the estimation of the control region purity. The pT -
dependent NLO electroweak corrections [67] are assigned
Data / Sim.
1.2
as additional uncertainties to account for any mismodeling
1
of the photon pT in simulation. This uncertainty has a mag-
0.8
nitude of 8% for the lowest pTmiss bin and rises to 40% for ≥1 ≥1
N 02-4 N 05-6 N 0≥7 N 2-4 N 5-6 N ≥≥17
pTmiss > 750 GeV. Region
Fig. 3 The double ratio κ in each Njets -Nb-jets region for zero-photon
4.4 Background from γ +jets events events. The filled black circles are the observed κ values after subtract-
ing the electroweak contamination based on simulation. The open blue
squares are the κ values computed directly from simulation. The ratio
The γ +jets background is dominated by events in which is shown in the bottom panel, where the shaded region corresponds to
a genuine photon is accompanied by an energetic jet with the systematic uncertainty in the γ +jets prediction. In the label Njb , j
mismeasured pT , resulting in high pTmiss . The QCD multijet refers to the number of jets and b refers to the number of b-tagged jets
events with a jet misidentified as a photon and a mismeasured
jet contribute to this background at a much smaller rate; these
events are measured together with events from the γ +jets pro- Nγ +jets = κ Nlow-Δφ Rh/l . Nlow-Δφ is the event yield in the
cess. Most of these events are removed by requiring that the high- pTmiss , low-Δφ control region after removing contribu-
azimuthal angles between the pTmiss and each of the two high- tions from electroweak backgrounds.
est pT jets satisfy Δφ1,2 > 0.3. Inverting this requirement Uncertainties in the γ +jets prediction are dominated by
provides a large control region of low-Δφ events that is used the statistical uncertainties either from the limited number of
to predict the γ +jets background in the signal regions. The events in the low-Δφ control regions or from the predictions
ratio of high-Δφ events to low-Δφ events, Rh/l , is derived of the electroweak contamination. The 200 GeV p miss 1000 GeV. Electroweak contamination in the eral, a large deviation in a single bin is inconsistent with the
zero-photon validation region is estimated using simulated expected distributions of events from the signal models con-
Vγ +jets (V = Z, W), ttγ , tt+jets, W+jets, and Z(νν)+jets sidered here. The observations in all other bins are consistent
events. The comparison of κ in data and simulation is shown with the SM expectations within one standard deviation.
in Fig. 3. The level of disagreement is found to be less than Limits are evaluated for the production cross sections of
20%. the signal scenarios discussed in Sect. 1 using a maximum
Event yields for the γ +jets background are computed likelihood fit for the SUSY signal strength, the yields of the
from the high- pTmiss , low-Δφ control regions according to five classes of background events shown in Fig. 4, and various
123444 Page 8 of 26 Eur. Phys. J. C (2019) 79:444
Table 1 Predicted and observed event yields for each of the 25 exclusive signal regions
Njets Nb-jets pTmiss (GeV) Lost e Lost μ + τh Misid. γ Z(νν)γ γ +jets Total Data
2–4 0 200–270 10.5 ± 2.6 31.2 ± 6.0 22.3 ± 5.4 33.6 ± 8.3 60 ± 11 157 ± 16 151
2–4 0 270–350 5.8 ± 1.8 29.6 ± 5.9 11.9 ± 2.9 22.9 ± 6.0 20.5 ± 4.3 91 ± 10 51
2–4 0 350–450 1.68 ± 0.88 13.9 ± 3.9 6.6 ± 1.6 17.0 ± 5.2 4.1 ± 1.4 43.3± 6.8 50
2–4 0 450–750 1.98 ± 0.94 8.1 ± 3.1 6.7 ± 1.5 18.1 ± 7.1 2.5 ± 1.3 37.4± 8.0 33
+0.69
2–4 0 > 750 0.00−0.00 1.2 ± 1.2 0.79 ± 0.19 2.8 ± 1.2 0.41+0.42
−0.41 5.2 ± 1.9 6
5–6 0 200–270 1.28 ± 0.61 5.1 ± 1.9 3.53 ± 0.75 3.09 ± 0.78 15.8 ± 4.8 28.8 ± 5.3 26
5–6 0 270–350 2.06 ± 0.80 3.2 ± 1.5 2.39 ± 0.56 1.98 ± 0.54 3.7 ± 1.8 13.3 ± 2.6 11
+0.65
5–6 0 350–450 0.77 ± 0.46 0.64−0.64 1.26 ± 0.30 1.49 ± 0.47 1.23 ± 0.97 5.4 ± 1.4 8
5–6 0 > 450 0.26 ± 0.26 1.9 ± 1.1 1.00 ± 0.24 1.65 ± 0.65 0.07+0.52
−0.07 4.9 ± 1.4 7
+0.61 +1.3
≥7 0 200–270 0.00−0.00 0.0−0.0 0.72 ± 0.16 0.37 ± 0.11 1.8 ± 1.2 2.9 ± 1.9 3
+0.35
≥7 0 270–350 0.34−0.34 1.5 ± 1.0 0.38 ± 0.10 0.24 ± 0.08 1.22 ± 0.94 3.6 ± 1.5 3
+0.35
≥7 0 350–450 0.34−0.34 0.73 ± 0.73 0.17 ± 0.05 0.16 ± 0.07 0.07+0.50
−0.07 1.46 ± 0.96 0
+0.61 +1.3 +0.75
≥7 0 > 450 0.00−0.00 0.0−0.0 0.20 ± 0.06 0.17 ± 0.08 0.00−0.00 0.37+1.60
−0.37 0
2–4 ≥1 200–270 3.4 ± 1.5 14.5 ± 4.2 7.1 ± 1.7 3.55 ± 0.89 11.3 ± 3.3 39.8 ± 5.9 50
2–4 ≥1 270–350 2.9 ± 1.4 5.6 ± 2.5 3.79 ± 0.92 2.45 ± 0.65 5.7 ± 1.8 20.4 ± 3.6 20
+1.0
2–4 ≥1 350–450 0.0−0.0 1.1 ± 1.1 2.00 ± 0.45 1.81 ± 0.55 0.59 ± 0.44 5.5 ± 1.7 4
2–4 ≥1 > 450 2.3 ± 1.2 4.4 ± 2.3 1.62 ± 0.38 2.14 ± 0.84 0.95 ± 0.54 11.5 ± 2.8 8
5–6 ≥1 200–270 3.5 ± 1.3 2.4 ± 1.4 5.5 ± 1.2 0.76 ± 0.20 7.7 ± 2.4 19.9 ± 3.3 21
5–6 ≥1 270–350 1.06 ± 0.64 4.0 ± 1.8 2.98 ± 0.63 0.49 ± 0.14 2.1 ± 1.0 10.6 ± 2.3 15
+0.49
5–6 ≥1 350–450 0.71 ± 0.51 2.4 ± 1.4 1.38 ± 0.29 0.32 ± 0.11 0.30−0.30 5.1 ± 1.6 6
5–6 ≥1 > 450 0.35+0.36
−0.35
+1.4
0.0−0.0 0.67 ± 0.15 0.48 ± 0.20 +0.56
0.00−0.00 1.5+1.6
−1.5 2
≥7 ≥1 200–270 0.72 ± 0.53 2.0 ± 1.2 1.68 ± 0.37 0.13 ± 0.04 5.9 ± 5.0 10.5 ± 5.1 12
+0.65 +1.1
≥7 ≥1 270–350 0.00−0.00 1.33 ± 0.96 0.73 ± 0.16 0.10 ± 0.04 0.0−0.0 2.2 ± 1.6 1
+1.2 +1.1 +1.7
≥7 ≥1 350–450 0.72 ± 0.53 0.0−0.0 0.44 ± 0.10 0.07 ± 0.03 0.0−0.0 1.2−1.2 1
≥7 ≥1 > 450 0.36+0.37
−0.36
+1.2
0.0−0.0 0.23 ± 0.07 0.04 ± 0.02 +1.1
0.0−0.0 0.6+1.7
−0.6 1
nuisance parameters. The SUSY signal strength μ is defined pTmiss modeling, with a maximum value of 10%. The pro-
to be the ratio of the observed signal cross section to the pre- cedures used to evaluate the systematic uncertainties in the
dicted cross section. A nuisance parameter refers to a variable signal predictions in the context of this search are described
not of interest in this search, such as the effect of parton dis- in Ref. [68].
tribution function uncertainties in a background prediction. For the models of gluino pair production considered here,
The nuisance parameters are constrained by observed data in the limits are derived as a function of mg and m χ0 , while
1
the fit. The uncertainties in the predicted signal yield arise for the model of top squark pair production, the limits are
from the uncertainties in renormalization and factorization a function of mt and m χ0 . The likelihood used for the sta-
1
scales, ISR modeling, jet energy scale, b-tagging efficiency tistical interpretation models the yield in each of the sig-
and misidentification rate, corrections to simulation, limited nal regions as a Poisson distribution, multiplied by con-
numbers of simulated events, and the integrated luminosity straints which account for the uncertainties in the back-
measurement [26]. The largest uncertainty comes from the ground predictions and signal yields. For the predictions in
ISR modeling; it ranges from 4 to 30% depending on the sig- which an observed event yield in a control region is scaled,
nal region and the signal parameters, taking higher values for a gamma distribution is used to model the Poisson uncer-
regions with large Njets or for signals with Δm ≈ 0. Here, tainty of the observed control region yield. All other uncer-
Δm is the difference in mass between the gluino or squark tainties are modeled as log-normal distributions. The test
and its decay products, e.g. Δm = mg − (m χ0 + 2m t ) for statistic is qμ = −2 ln Lμ /Lmax , where Lmax is the max-
1
the T5ttttZG model when on-shell top quarks are produced. imum likelihood determined by leaving all parameters as
The second-largest uncertainty comes from the correction free, including the signal strength, and Lμ is the maximum
for differences between Geant4 and the fast simulation in likelihood for a fixed value of μ. Limits are determined
123Eur. Phys. J. C (2019) 79:444 Page 9 of 26 444
CMS 35.9 fb-1 (13 TeV)
Z boson mass. While a similar effect would happen for the
Events
105 Z(νν) + γ Lost e Lost μ + τ
h
Misidentified γ
γ + jets Data Total uncertainty T5qqqqHG model, the simulation used here does not probe
4
10 g→bb∼
~ χ1, ∼
0 0
χ1 → γ /Z
~
G (m~ = 1800 GeV, m∼0 = 150 GeV)
103 g→bb∼
~ χ1, ∼
0 0
χ1 → γ /Z
~ g χ
1
G (m~ = 1800 GeV, m∼0 = 1750 GeV) the region of parameter space where the Higgs boson would
N 02-4 g χ
1
102
N 05-6 N 0≥7 ≥1
N 2-4 ≥1
N 5-6 N ≥≥17 be forced to have a mass far off-shell. Similarly, the limits
10 for top squark production improve slightly at very high m χ0 ,
1
1 when the top quarks become off-shell. In this case, the χ
10 car-
ries a larger fraction of the top squark momentum, increasing
Obs. / Pred.
1.5
the pTmiss .
1
0.5 For moderate m χ0 , gluino masses as large as 2090, 2120,
1
5 10 15 20 25
and 1970 GeV are excluded for the T5qqqqHG, T5bbbbZG,
Bin number and T5ttttZG models, respectively. Top squark masses as
large as 1230 GeV are excluded for the T6ttZG model.
Fig. 4 Observed numbers of events and predicted numbers of events For small m χ0 , gluino masses as large as 1920, 1950, and
from the various SM backgrounds in the 25 signal regions. The cate- 1
gories, denoted by vertical lines, are labeled as Njb , where j refers to the 1800 GeV are excluded for the T5qqqqHG, T5bbbbZG, and
number of jets and b refers to the number of b-tagged jets. The num- T5ttttZG models, respectively. Top squark masses as large as
bered bins within each category are the various pTmiss bins, as defined 1110 GeV are excluded for the T6ttZG model. There is close
in Table 1. The lower panel shows the ratio of the observed events to agreement between the observed and expected limits.
the predicted SM background events. The error bars in the lower panel
are the quadrature sum of the statistical uncertainty in the observed data
and the systematic uncertainty in the predicted backgrounds before the
adjustments based on a maximum likelihood fit to data assuming no
signal strength 6 Summary
A search for gluino and top squark pair production is pre-
using an approximation of the asymptotic form of the test sented, based on a proton–proton collision dataset at a center-
statistic distribution [69] in conjunction with the CLs cri- of-mass energy of 13 TeV recorded with the CMS detector
terion [70,71]. Expected upper limits are derived by vary- in 2016. The data correspond to an integrated luminosity of
ing observed yields according to the expectations from the 35.9 fb−1 . Events are required to have at least one isolated
background-only hypothesis. photon with transverse momentum pT > 100 GeV, two jets
Using the statistical procedure described above, 95% with pT > 30 GeV and pseudorapidity |η| < 2.4, and miss-
confidence level (CL) upper limits are computed on the ing transverse momentum pTmiss > 200 GeV.
signal cross section for each simplified model and each The data are categorized into 25 exclusive signal regions
mass hypothesis. Exclusion limits are defined by compar- based on the number of jets, the number of b-tagged jets, and
ing observed upper limits to the predicted NLO+NLL sig- pTmiss . Background yields from the standard model processes
nal cross section. The signal cross sections are also varied are predicted using simulation and data control regions. The
according to theoretical uncertainties to give a ±1 standard observed event yields are found to be consistent with expec-
deviation variation on the observed exclusion contour. The tations from the standard model processes within the uncer-
95% CL cross section limits and exclusion contours for the tainties.
four models considered, T5qqqqHG, T5bbbbZG, T5ttttZG, Results are interpreted in the context of simplified models.
and T6ttZG, are shown in Fig. 5. Four such models are studied, three of which involve gluino
Generally, the limits degrade at both high and low m χ0 . pair production and one of which involves top squark pair
1
For m χ0 ≈ mg (mt ), the quarks from the decay of gluinos production. All models assume a gauge-mediated supersym-
1
γ
(top squarks) have low pT . Correspondingly, the HT , Njets , metry (SUSY) breaking scenario, in which the lightest SUSY
and Nb-jets distributions tend toward lower values, reducing particle is a gravitino (G). We consider scenarios in which
the signal efficiency and causing signal events to populate the gluino decays to a neutralino χ 10 and a pair of light-flavor
regions with higher background yields. For small m χ0 , the quarks (T5qqqqHG), bottom quarks (T5bbbbZG), or top
1
quarks produced in the decay of gluinos or top squarks have quarks (T5ttttZG). In the T5qqqqHG model, the χ 10 decays
high pT but lower pTmiss on average. For all models except with equal probability either to a photon and a G or to a Higgs
T5qqqqHG, when the NLSP mass drops below the mass of boson and a G. In the T5bbbbZG and T5ttttZG models, the
the Z boson, the kinematics of the NLSP decay require the 10 decays with equal probability either to a photon and a
χ G
Z boson to be far off-shell. As the Z boson mass is forced to or to a Z boson and a G. In the top squark pair production
be lower, the LSP will carry a larger fraction of the momen- model (T6ttZG), top squarks decay to a top quark and χ 10 ,
tum of the NLSP, producing larger pTmiss . This causes a slight and the χ 1 decays with equal probability either to a photon
0
increase in the sensitivity when the NLSP mass is near the and a G or to a Z boson and a G.
123444 Page 10 of 26 Eur. Phys. J. C (2019) 79:444
CMS 35.9 fb-1 (13 TeV) CMS 35.9 fb-1 (13 TeV)
95% CL upper limit on cross section (fb)
95% CL upper limit on cross section (fb)
mχ∼0 (GeV)
m∼χ0 (GeV)
g→qq∼
χ1, ∼ g→bb∼
χ1, ∼
~ ~
3000 pp → ~
g~g, ~ 3000 pp → ~
g~g, ~
0 0 0 0
χ1 → γ /H G NLO+NLL exclusion χ1 → γ /Z G NLO+NLL exclusion
Observed ± 1 σtheory Observed ± 1 σtheory
Expected ± 1 σexperiment Expected ± 1 σexperiment
1
1
2500 2500
2000 2000
1500 1500
1 1
1000 1000
500 500
0 0
1600 1800 2000 2200 2400 1600 1800 2000 2200 2400
m~g (GeV) m~g (GeV)
CMS 35.9 fb-1 (13 TeV) CMS 35.9 fb-1 (13 TeV)
2000 ∼0, χ
∼0 → γ /Z G
~
95% CL upper limit on cross section (fb)
95% CL upper limit on cross section (fb)
mχ∼0 (GeV)
mχ∼0 (GeV)
~ ~~ ~
pp → ~
g~ g→tt∼
g, ~ χ1, ∼
0 0
3000 χ1 → γ /Z G NLO+NLL exclusion pp → t t, t → t χ
1 1
NLO+NLL exclusion
Observed ± 1 σtheory Observed ± 1 σtheory
Expected ± 1 σexperiment Expected ± 1 σexperiment
1
1
2500
1500
2000
1500 1000
1 1
1000
500
500
0 0
1600 1800 2000 2200 2400 800 900 1000 1100 1200 1300 1400
m~g (GeV) m ~t (GeV)
Fig. 5 Observed and expected 95% CL upper limits for gluino or top uncertainty due to variations of the theoretical prediction of the gluino
squark pair production cross sections for the T5qqqqHG (upper left), or top squark pair production cross section. The dashed lines corre-
T5bbbbZG (upper right), T5ttttZG (bottom left), and T6ttZG (bottom spond to the region containing 68% of the distribution of the expected
right) models. Black lines denote the observed exclusion limit and the exclusion limits under the background-only hypothesis
Using the cross sections for SUSY pair production calcu- and HGF (Germany); GSRT (Greece); NKFIA (Hungary); DAE and
lated at next-to-leading order plus next-to-leading logarith- DST (India); IPM (Iran); SFI (Ireland); INFN (Italy); MSIP and NRF
(Republic of Korea); MES (Latvia); LAS (Lithuania); MOE and UM
mic accuracy, we place 95% confidence level lower limits
(Malaysia); BUAP, CINVESTAV, CONACYT, LNS, SEP, and UASLP-
on the gluino mass as large as 2120 GeV, depending on the FAI (Mexico); MOS (Montenegro); MBIE (New Zealand); PAEC (Pak-
model and the m χ0 value, and limits on the top squark mass as istan); MSHE and NSC (Poland); FCT (Portugal); JINR (Dubna);
1
large as 1230 GeV, depending on the m χ0 value. These results MON, RosAtom, RAS, RFBR, and NRC KI (Russia); MESTD (Ser-
1 bia); SEIDI, CPAN, PCTI, and FEDER (Spain); MOSTR (Sri Lanka);
significantly improve upon those from previous searches for
Swiss Funding Agencies (Switzerland); MST (Taipei); ThEPCenter,
SUSY with photons. IPST, STAR, and NSTDA (Thailand); TUBITAK and TAEK (Turkey);
NASU and SFFR (Ukraine); STFC (United Kingdom); DOE and NSF
Acknowledgements We congratulate our colleagues in the CERN (USA). Individuals have received support from the Marie-Curie pro-
accelerator departments for the excellent performance of the LHC and gram and the European Research Council and Horizon 2020 Grant,
thank the technical and administrative staffs at CERN and at other CMS contract No. 675440 (European Union); the Leventis Foundation; the
institutes for their contributions to the success of the CMS effort. In A. P. Sloan Foundation; the Alexander von Humboldt Foundation; the
addition, we gratefully acknowledge the computing centers and per- Belgian Federal Science Policy Office; the Fonds pour la Formation à
sonnel of the Worldwide LHC Computing Grid for delivering so effec- la Recherche dans l’Industrie et dans l’Agriculture (FRIA-Belgium);
tively the computing infrastructure essential to our analyses. Finally, we the Agentschap voor Innovatie door Wetenschap en Technologie (IWT-
acknowledge the enduring support for the construction and operation of Belgium); the F.R.S.-FNRS and FWO (Belgium) under the “Excellence
the LHC and the CMS detector provided by the following funding agen- of Science - EOS” - be.h project n. 30820817; the Ministry of Educa-
cies: BMBWF and FWF (Austria); FNRS and FWO (Belgium); CNPq, tion, Youth and Sports (MEYS) of the Czech Republic; the Lendület
CAPES, FAPERJ, FAPERGS, and FAPESP (Brazil); MES (Bulgaria); (“Momentum”) Programme and the János Bolyai Research Scholar-
CERN; CAS, MoST, and NSFC (China); COLCIENCIAS (Colom- ship of the Hungarian Academy of Sciences, the New National Excel-
bia); MSES and CSF (Croatia); RPF (Cyprus); SENESCYT (Ecuador); lence Program ÚNKP, the NKFIA research Grants 123842, 123959,
MoER, ERC IUT, and ERDF (Estonia); Academy of Finland, MEC, 124845, 124850 and 125105 (Hungary); the Council of Science and
and HIP (Finland); CEA and CNRS/IN2P3 (France); BMBF, DFG, Industrial Research, India; the HOMING PLUS program of the Foun-
123Eur. Phys. J. C (2019) 79:444 Page 11 of 26 444
dation for Polish Science, cofinanced from European Union, Regional 10. YuA Golfand, E.P. Likhtman, Extension of the algebra of Poincaré
Development Fund, the Mobility Plus program of the Ministry of Sci- group generators and violation of P invariance. JETP Lett. 13, 323
ence and Higher Education, the National Science Center (Poland), con- (1971)
tracts Harmonia 2014/14/M/ST2/00428, Opus 2014/13/B/ST2/02543, 11. A. Neveu, J.H. Schwarz, Factorizable dual model of pions.
2014/15/B/ST2/03998, and 2015/19/B/ST2/02861, Sonata-bis 2012/07/ Nucl. Phys. B 31, 86 (1971). https://doi.org/10.1016/
E/ST2/01406; the National Priorities Research Program by Qatar 0550-3213(71)90448-2
National Research Fund; the Programa Estatal de Fomento de la Inves- 12. D.V. Volkov, V.P. Akulov, Possible universal neutrino interaction.
tigación Científica y Técnica de Excelencia María de Maeztu, Grant JETP Lett. 16, 438 (1972)
MDM-2015-0509 and the Programa Severo Ochoa del Principado de 13. J. Wess, B. Zumino, A Lagrangian model invariant under super-
Asturias; the Thalis and Aristeia programs cofinanced by EU-ESF and gauge transformations. Phys. Lett. B 49, 52 (1974). https://doi.org/
the Greek NSRF; the Rachadapisek Sompot Fund for Postdoctoral 10.1016/0370-2693(74)90578-4
Fellowship, Chulalongkorn University and the Chulalongkorn Aca- 14. J. Wess, B. Zumino, Supergauge transformations in four dimen-
demic into Its 2nd Century Project Advancement Project (Thailand); sions. Nucl. Phys. B 70, 39 (1974). https://doi.org/10.1016/
the Welch Foundation, contract C-1845; and the Weston Havens Foun- 0550-3213(74)90355-1
dation (USA). 15. P. Fayet, Supergauge invariant extension of the Higgs mechanism
and a model for the electron and its neutrino. Nucl. Phys. B 90, 104
Data Availability Statement This manuscript has no associated data or (1975). https://doi.org/10.1016/0550-3213(75)90636-7
the data will not be deposited [Authors’ comment: Release and preser- 16. H.P. Nilles, Supersymmetry, supergravity and particle
vation of data used by the CMS Collaboration as the basis for publica- physics. Phys. Rep. 110, 1 (1984). https://doi.org/10.1016/
tions is guided by the CMS policy as written in its document “CMS data 0370-1573(84)90008-5
preservation, re-use and open access policy” (https://cms-docb.cern.ch/ 17. G.R. Farrar, P. Fayet, Phenomenology of the production, decay,
cgi-bin/PublicDocDB/RetrieveFile?docid=6032&filename=CMSDat and detection of new hadronic states associated with supersym-
aPolicyV1.2.pdf&version=2).] metry. Phys. Lett. B 76, 575 (1978). https://doi.org/10.1016/
0370-2693(78)90858-4
Open Access This article is distributed under the terms of the Creative 18. P. Meade, N. Seiberg, D. Shih, General gauge mediation. Prog.
Commons Attribution 4.0 International License (http://creativecomm Theor. Phys. Suppl. 177, 143 (2009). https://doi.org/10.1143/
ons.org/licenses/by/4.0/), which permits unrestricted use, distribution, PTPS.177.143. arXiv:0801.3278
and reproduction in any medium, provided you give appropriate credit 19. S. Deser, B. Zumino, Broken supersymmetry and supergrav-
to the original author(s) and the source, provide a link to the Creative ity. Phys. Rev. Lett. 38, 1433 (1977). https://doi.org/10.1103/
Commons license, and indicate if changes were made. PhysRevLett.38.1433
Funded by SCOAP3 . 20. E. Cremmer et al., Super-Higgs effect in supergravity with general
scalar interactions. Phys. Lett. B 79, 231 (1978). https://doi.org/
10.1016/0370-2693(78)90230-7
21. N. Arkani-Hamed et al., MARMOSET: the path from LHC data
to the new standard model via on-shell effective theories. (2007).
References arXiv:hep-ph/0703088
22. J. Alwall, P.C. Schuster, N. Toro, Simplified models for a first
1. F. Zwicky, Die Rotverschiebung von extragalaktischen Nebeln. characterization of new physics at the LHC. Phys. Rev. D
Helv. Phys. Acta 6, 110 (1933) 79, 075020 (2009). https://doi.org/10.1103/PhysRevD.79.075020.
2. V.C. Rubin, W.K. Ford Jr., Rotation of the Andromeda nebula from arXiv:0810.3921
a spectroscopic survey of emission regions. Astrophys. J. 159, 379 23. J. Alwall, M.-P. Le, M. Lisanti, J.G. Wacker, Model-independent
(1970). https://doi.org/10.1086/150317 jets plus missing energy searches. Phys. Rev. D 79, 015005 (2009).
3. R. Barbieri, G.F. Giudice, Upper bounds on supersymmetric parti- https://doi.org/10.1103/PhysRevD.79.015005. arXiv:0809.3264
cle masses. Nucl. Phys. B 306, 63 (1988). https://doi.org/10.1016/ 24. D. Alves et al., Simplified models for LHC new physics searches.
0550-3213(88)90171-X J. Phys. G 39, 105005 (2012). https://doi.org/10.1088/0954-3899/
4. S. Dimopoulos, G.F. Giudice, Naturalness constraints in super- 39/10/105005. arXiv:1105.2838
symmetric theories with nonuniversal soft terms. Phys. Lett. B 25. CMS Collaboration, Interpretation of searches for supersymmetry
357, 573 (1995). https://doi.org/10.1016/0370-2693(95)00961-J. with simplified models. Phys. Rev. D 88, 052017 (2013). https://
arXiv:hep-ph/9507282 doi.org/10.1103/PhysRevD.88.052017. arXiv:1301.2175
5. R. Barbieri, D. Pappadopulo, S-particles at their naturalness limits. 26. CMS Collaboration, CMS luminosity measurements for the 2016
JHEP 10, 061 (2009). https://doi.org/10.1088/1126-6708/2009/ data taking period. CMS Physics Analysis Summary CMS-PAS-
10/061. arXiv:0906.4546 LUM-17-001 (2017)
6. M. Papucci, J.T. Ruderman, A. Weiler, Natural SUSY endures. 27. CMS Collaboration, Search for gauge-mediated supersymme-
JHEP 09, 035 (2012). https://doi.org/10.1007/JHEP09(2012)035. try in events with at least one √ photon and missing transverse
arXiv:1110.6926 momentum in pp collisions at s = 13 TeV. Phys. Lett. B
7. CMS Collaboration, Measurements of properties of the Higgs 780, 118 (2018). https://doi.org/10.1016/j.physletb.2018.02.045.
boson
√ decaying into the four-lepton final state in pp collisions arXiv:1711.08008
at s = 13 TeV. JHEP 11, 047 (2017). https://doi.org/10.1007/ 28. CMS Collaboration, Search for supersymmetry in events with at
JHEP11(2017)047. arXiv:1706.09936 least one photon, missing transverse momentum, and √ large trans-
8. ATLAS and CMS Collaborations, Combined √ measurement of the verse event activity in proton–proton collisions at s = 13 TeV.
Higgs boson mass in pp collisions at s = 7 and 8 TeV JHEP 12, 142 (2017). https://doi.org/10.1007/JHEP12(2017)142.
with the ATLAS and CMS experiments. Phys. Rev. Lett. 114, arXiv:1707.06193
191803 (2015). https://doi.org/10.1103/PhysRevLett.114.191803. 29. ATLAS Collaboration, Search for photonic signatures of gauge-
arXiv:1503.07589 mediated supersymmetry in 8 TeV pp collisions with the ATLAS
9. P. Ramond, Dual theory for free fermions. Phys. Rev. D 3, 2415 detector. Phys. Rev. D 92, 072001 (2015). https://doi.org/10.1103/
(1971). https://doi.org/10.1103/PhysRevD.3.2415 PhysRevD.92.072001. arXiv:1507.05493
123You can also read