Seasonal Differences in Taxonomic Diversity of Rotifer Communities in a Hungarian Lowland Oxbow Lake Exposed to Aquaculture Effluent - MDPI
←
→
Page content transcription
If your browser does not render page correctly, please read the page content below
water
Article
Seasonal Differences in Taxonomic Diversity of
Rotifer Communities in a Hungarian Lowland Oxbow
Lake Exposed to Aquaculture Effluent
Flórián Tóth 1,2,3, *, Katalin Zsuga 4 , Éva Kerepeczki 1 , László Berzi-Nagy 1 , László Körmöczi 2
and Gábor L. Lövei 3
 1   Department of Hydrobiology, National Agricultural Research and Innovation Centre–Research Institute for
     Fisheries and Aquaculture, 5540 Szarvas, Hungary; kerepeczki.eva@haki.naik.hu (É.K.);
     berzi-nagy.laszlo@haki.naik.hu (L.B.-N.)
 2   Department of Ecology, Faculty of Science and Informatics, University of Szeged, 6720 Szeged, Hungary;
     kormoczi@bio.u-szeged.hu
 3   Department of Agroecology, Aarhus University, Flakkebjerg Research Center, 4200 Slagelse, Denmark;
     gabor.lovei@agro.au.dk
 4   Agrint Ltd., 2100 Gödöllő, Hungary; zsuga.katalin@gmail.com
 *   Correspondence: toth.florian@haki.naik.hu; Tel.: +36-66-515-300

 Received: 30 March 2020; Accepted: 2 May 2020; Published: 5 May 2020

 Abstract: With the intensification of aquaculture technologies, the amount of feed input and waste
 material is increasing, creating potentially negative impacts on freshwater habitats receiving effluent
 from such systems. Changes in biodiversity of zooplankton communities is often used to assess the
 effects of such impacts. Rotifers are suitable for bioindication of water quality due to their fast reaction
 to environmental changes. We examined seasonal changes in the diversity of rotifer communities
 along a 3.5 km section of the biggest oxbow lake in the Tisza River basin, Hungary, that received
 inflow from an intensive tank-based aquaculture farm. We detected a species-rich rotifer community
 with 26 species. Using the Rényi one-parameter diversity index families, we found that biodiversity
 increased away from the point of inflow in spring, but after a summer transition period the situation
 became partially reversed during autumn. At the beginning of the study period, the nutrient-rich
 effluent strengthened the dominance of common species, which decreased but did not disappear
 in summer. In autumn, the extra nutrient input delayed the decline of the rotifer community at the
 point of effluent.

 Keywords: Rotifera; nutrient load; water quality; indication; Rényi diversity

1. Introduction
     With growing human population, protein production by aquaculture has greatly increased,
becoming the fastest growing animal husbandry sector in the world [1]. As aquaculture production is
intensifying, the amount of fish feed input and the resulting waste, including organic matter, nutrients,
and suspended solids, is also increasing [2]. These create potentially negative impacts on neighbouring
habitats, especially the freshwater habitats receiving outflow from such systems [3].
     Wetlands in general have suffered a great reduction in Europe during the 20th century [4], and many
of the remaining ones, often even in protected areas, are under encroachment from aquaculture [5].
The river regulation at our study site, the Hungarian lowland, was the biggest such enterprise in
Europe during the 19th century and has profoundly modified the lowland environment and water
regime [6]. The regulation decreased the meandering of the Tisza River to enhance flood management.
After completion, the Tisza became 457 km shorter, but the originally ignored negative ecological

Water 2020, 12, 1300; doi:10.3390/w12051300                                       www.mdpi.com/journal/water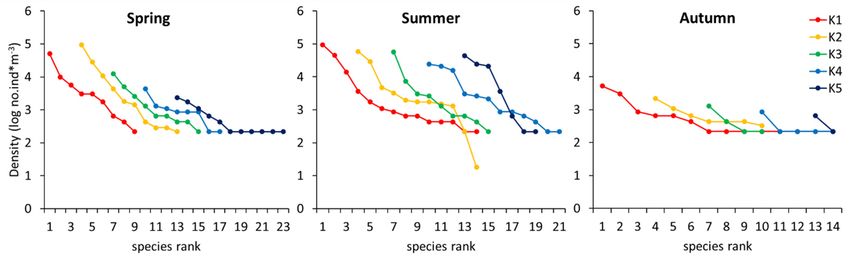
Water 2020, 12, 1300                                                                                    2 of 11

impacts soon became evident [7]. An unexpected side benefit was that many of the isolated meanders
became oxbow lakes and developed into valuable wetland habitats. The Kákafok oxbow lake near to
the settlements of Szarvas and Békésszentandrás, formed after the regulation of River Körös (a tributary
of the Tisza River), is the largest of the Tisza watershed, and also represents significant natural value.
It has a significant role in the formation of the characteristic landscape of the Körös River basin,
and provides different anthropogenic utilization opportunities [8], which influence the composition of
the aquatic communities.
      The assessment of changes in the biodiversity of impacted habitats is an indispensable part of the
analysis of anthropogenic effects. A complete inventory of all elements of biodiversity is rarely feasible,
thus the selection of a suitable indicator group is an important decision. In water quality assessment,
several planktonic organisms have been suggested as indicator groups Rotifers have been used for
water quality assessment from New Zealand [9] to Ireland [10]. Several authors have used rotifers
to indicate eutrophication [11–16] and saprobity [17,18], and to develop trophic state indices [19,20].
The microscopic size of rotifers contributes to their cosmopolitan and ubiquity distribution [21,22],
although at a much lower level than previously thought [23]. They also have several endemisms with
narrow biogeographical distribution [24,25]. Because of this, the communities of rotifers are often
included in faunistic and ecological investigations. Rotifers play an important role as the basis of the
food web of aquatic ecosystems, transferring energy from lower to higher trophic levels [26]. Rotifers
are amongst the fastest growing of planktonic indicator groups [27], and thus their communities react
quickly to physical, chemical and biological changes in water [18,28,29].
      Surveys of the zooplankton communities of the Tisza River began in the middle of the 20th
century [30]. The research into the River Körös received some attention, [31,32] but the rotifers of
oxbow lakes have been less investigated. A recent study [33] dealt with protected oxbow lakes nearby
but left out the biggest, the Szarvas-Békésszentandrás (Kákafok) oxbow lake, because it is not under
nature protection. A common feature of these studies is that they considered the individual water
bodies to be homogeneous and only one or two samples per year were taken, providing information
about the overall composition of the rotifer community. On the other hand, seasonal variations are
also important, and these assessments did not explore the advantage that rotifers respond quickly to
environmental changes.
      The main goal of this article is to assess the cumulative effects of aquaculture effluent on the seasonal
structure of rotifer communities in a spatially explicit manner and to describe the seasonal changes in
rotifer communities along a 3.5 km long section of the Kákafok oxbow lake, at increasing distances from
the point of effluent. For a synthetic analysis of diversity, we chose the Rényi one-parameter diversity
index family [34]. We hypothesized that the effluent affects community composition but the effect is
diluted as the distance from the inlet point increases. We expected that, under oligotrophic conditions,
a generally species-rich community develops with low dominance, while there are fewer species with
higher abundance under nutrient-rich conditions [35,36]. Consequently, our second hypothesis was
that lower taxonomic diversity would be recorded near the inflow, while diversity would increase
farther away from the point of inflow.

2. Materials and Methods

2.1. Study Site
      The Kákafok oxbow lake located near Szarvas and Békésszentandrás (46◦ 510 14.9” N, 20◦ 300 44.6”
E) is the biggest protected oxbow lake of the River Tisza watershed. This water body is 29 km long,
spreading over 207 ha, with an average depth of 2.2 m, holding 4.5 million m3 of water [8]. The lake
is semi-paleopotamonic with a possibility of supplementing or replacing water, pumping over from
the parent river [37]. The oxbow lake was filled up at the beginning of the year and the water level
lowered in late autumn. Between these two events, there was no significant water movement or flow,
Water 2020, 12, 1300 3 of 11
so we considered it as stagnant water, with no species influx possible during the year. The oxbow
Water 2019, 11, x FOR PEER REVIEW 3 of 11
serves for storing inland excess and irrigation water as well as for various recreational activities [8].
Along
Along aa 3.5
3.5 km
km section,
section, we
we selected
selected five
five sampling
sampling points
points (K1–K5)
(K1–K5) (Figure
(Figure 1)1) at
at different
different positions
positions
in
in relation to the combined inflow from a thermal water fish farm producing African catfish (Clarias
relation to the combined inflow from a thermal water fish farm producing African catfish (Clarias
gariepinus) and the experimental fish ponds of the Research Institute for Fisheries
gariepinus) and the experimental fish ponds of the Research Institute for Fisheries and Aquaculture, and Aquaculture,
National
National Agricultural
Agricultural Research
ResearchandandInnovation
InnovationCentre—(HAKI).
Centre—(HAKI).No Noother
othersource
sourceofof
contamination
contamination is
known at this section of the oxbow lake. This inflow, located at site K1, was nutrient-rich,
is known at this section of the oxbow lake. This inflow, located at site K1, was nutrient-rich, partly of partly of
geothermal
geothermal origin,
origin, and before reaching
and before reaching the oxbow lake
the oxbow lake was
was treated
treated byby aa wastewater-cleaning
wastewater-cleaning wetlandwetland
system.
system. During the treatment process, the thermal water from the catfish farm cooled down, so at
During the treatment process, the thermal water from the catfish farm cooled down, so at the
the
point
point of inflow no thermal pollution occurred. Further sampling points were selected based on the
of inflow no thermal pollution occurred. Further sampling points were selected based on the
characteristics
characteristics of of the
the oxbow
oxbow lake. Because there
lake. Because there waswas nono significant
significant water
water flow,
flow, we
we only
only considered
considered
distance from inflow. The K2 point was at 500 m, K3 at 2.5 km (to
distance from inflow. The K2 point was at 500 m, K3 at 2.5 km (to avoid interference avoid interference by a fish by
sampling
a fish
operation), K4 at 3.0 km and K5 at 3.5 km from the influx point. The nutrient
sampling operation), K4 at 3.0 km and K5 at 3.5 km from the influx point. The nutrient content of the content of the water
decreases away away
water decreases from from
the influx. In the
the influx. yearyear
In the of the survey
of the surveyat at
thethepoint
pointofofK1,
K1,the
thecontent
content of Total
of Total
Nitrogen
Nitrogen (TN) was 0.195–4.000 mg/l, the Total Phosphorous (TP) from 0.053 to 0.468 mg/l and the
(TN) was 0.195–4.000 mg/L, the Total Phosphorous (TP) from 0.053 to 0.468 mg/L and the
Total Suspended Solids (TSS) from 13.14 to 41.10 mg/L. These values at point
Total Suspended Solids (TSS) from 13.14 to 41.10 mg/l. These values at point K5 were the following: K5 were the following:
TN:
TN: 0.275–1.140
0.275–1.140 mg/L, TP: 0.062–0.210
mg/l, TP: 0.062–0.210 mg/L
mg/l and and TSS:
TSS: 7.1–28.6
7.1–28.6 mg/L [38]. The
mg/l [38]. The yearly
yearly amount
amount of of the
the
effluent of the catfish farm was about 330,500 m 3 [39].
effluent of the catfish farm was about 330,500 m3 [39].
Figure 1.
Figure 1. Situations
Situationsofofthe
thesampling
sampling points
points (K1–K5)
(K1–K5) of Kákafok
of the the Kákafok
oxbow oxbow
lake inlake in Hungary.
Hungary. The
The yellow
yellow squares
squares indicate indicate the experimental
the experimental fish pondsfish ponds
of the of the
Research Research
Institute Institute and
for Fisheries for Aquaculture
Fisheries and–
Aquaculture
(HAKI), – (HAKI),
the blue square the blue square
indicates indicates
the African thefarm
catfish African
and catfish farmone
the orange andthetheartificial
orange wetland
one the
artificial wetland water treatment system. The line left of point K2 indicates a bridge
water treatment system. The line left of point K2 indicates a bridge with limited through-flow, effectivelywith limited
through-flow,
blocking watereffectively blocking
mixing in that waterIntensive
direction. mixing in that
fish direction.
sampling Intensive
took fish sampling
place between points K1took place
and K3,
between
which points
is why noK1 and K3, point
sampling whichwas
is why no sampling
placed point Google
there. (Source: was placed there. (Source: Google Earth).
Earth).
2.2. Chemical Water Characteristics
In the year of the survey, 1500 mL of effluent water from the African catfish farm was collected
monthly and taken to the laboratory at the National Agricultural Research and Innovation Centre
(NAIK) Research Institute of Irrigation and Water Management where TN [40] and TP [41] were
measured by spectrophotometry, and TSS [42] by weight measurements. These water samples were
collected from the outflow of the artificial wetland water treatment system.Water 2020, 12, 1300 4 of 11
2.2. Chemical Water Characteristics
In the year of the survey, 1500 mL of effluent water from the African catfish farm was collected
monthly and taken to the laboratory at the National Agricultural Research and Innovation Centre
(NAIK) Research Institute of Irrigation and Water Management where TN [40] and TP [41] were
measured by spectrophotometry, and TSS [42] by weight measurements. These water samples were
collected from the outflow of the artificial wetland water treatment system.
2.3. Zooplankton Sampling
We sampled the rotifer community nine times (3 times/season: spring: 20 April 2016, 10 May
2016, 01 June 2016; summer: 29 June 2016, 21 July 2016, 10 August 2016; autumn: 30 August 2016,
21 September 2016, 24 October 2016) at each sampling point, when we took 50 L of water fromWater 2020, 12, 1300 5 of 11
Table 2. The amount of nutrient entering the Kákafok oxbow lake.
Season Total Nitrogen (kg) Total Phosphorus (kg) Total Suspended Solids (kg)
Spring 1600 168 1135
Summer 830 120 1275
Autumn 1770 188 2810
Total
Water 2019, 11, 4200
x FOR PEER REVIEW 475 5220 5 of 11
3.2. Composition
3.2. Composition of
of the
the Rotifer
Rotifer Assemblage
Assemblage
During the
During the sampling
sampling period,
period, 2828 rotifer
rotifer taxa
taxa were
were collected:
collected: 26 26 were
were identified
identified to to species
species level,
level,
and 2 additional ones to genus level (Table S1). The highest species richness (14
and 2 additional ones to genus level (Table S1). The highest species richness (14 species) and density species) and density
(163,272ind·m
(163,272 ind·m−3−3) were registered at the inlet point (K1) in the summer and the lowest values (2 species
) were registered at the inlet point (K1) in the summer and the lowest values (2 species
and 864
and 864 ind·m
ind·m−3−3) were found at the most distant point (K5) in autumn (Table S1). The most frequent
) were found at the most distant point (K5) in autumn (Table S1). The most frequent
and widespread
and widespreadspecies
specieswere
wereBrachionus
Brachionuscalyciflorus
calyciflorusandand B.B. leydigi;
leydigi; these
these were
were absent
absent from
from only
only 22 sites.
sites.
There were 5 singleton species, observed in only one sample. The most species-rich
There were 5 singleton species, observed in only one sample. The most species-rich genus, Brachionus genus, Brachionus
wasrepresented
was representedby by10
10species.
species.
In spring,
In spring, the
the most
mostspecies-rich
species-richsite
sitewaswasK5K5(11(11
species),
species),butbut
thisthis
site had the lowest
site had density
the lowest (7560
density
ind·m −3). The−3highest abundance (140,472 ind·m −3) was found
−3 at K2. B. nilsoni
(7560 ind·m ). The highest abundance (140,472 ind·m ) was found at K2. B. nilsoni and B. leydigi and B. leydigi were most
abundant at the point of inflow and at a distance of 0.5 km
were most abundant at the point of inflow and at a distance of 0.5 km (K2). (K2).
In summer,
In summer, the the highest
highest species
species richness
richnessand anddensity
densitywerewereobserved
observedatat thethe
inflow
inflow(K1(K1site). In
site).
summer, the abundance varied between 71,928 and 163,488 ind·m −3 and was
In summer, the abundance varied between 71,928 and 163,488 ind·m and was dominated by −3 dominated by B.angularis
and B. calyciflorus.
B.angularis The number
and B. calyciflorus. Theof number
species varied between
of species varied7 between
(K5) and 714(K5)(K1).
and 14 (K1).
In autumn, the highest number of species (12) as well as
In autumn, the highest number of species (12) as well as individuals (12,096 individuals (12,096ind·m
ind·m−3−3)) were
were
detected at K1, and the lowest (2 species and 864 ind·m −3) at the most distant site, K5.
−3
detected at K1, and the lowest (2 species and 864 ind·m ) at the most distant site, K5.
3.3. Diversity
3.3. Diversity and
and Diversity
Diversity Ordering
Ordering
3.3.1.
3.3.1. Species
Species Distributions
Distributions
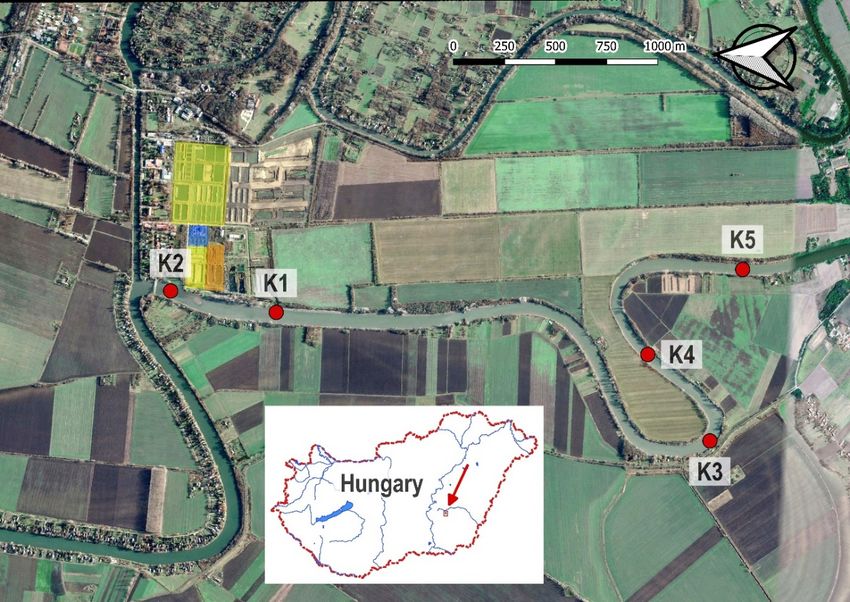
The
The spring
spring assemblages
assemblages from
from K1
K1toto K5
K5 had
had aa similar
similar number
number of of species
species (8–11),
(8–11), but
but the
the evenness
evenness
increased
increased with
with increasing
increasing distance
distance from
from the
the inflow
inflow point
point (Figure
(Figure 2).
2). In
In summer,
summer, thethe species
species richness
richness
was the highest at the inflow. Considering the most frequent and the rarest species,
was the highest at the inflow. Considering the most frequent and the rarest species, K1 had K1 had the highest
the
number of individuals
highest number but, in the
of individuals case
but, of the
in the casemoderately commoncommon
of the moderately species (species rank: 3–10),
species (species rank:K2,
3–
K4,
10),K5
K2,sites
K4, showed
K5 sites higher
showed diversity. In autumn,
higher diversity. In the assemblage
autumn, at the inlet
the assemblage atpoint (K1)point
the inlet was the
(K1)most
was
species-rich with a correspondingly
the most species-rich high number
with a correspondingly of individuals.
high At K3–K5, the
number of individuals. At number of species
K3–K5, the number and
of
individuals
species andwere lower (Figure
individuals 2). (Figure 2).
were lower
Figure 2. Rank-abundance curves of the seasonal rotifer assemblages at different distances (K1–K5)
Figure 2. Rank-abundance curves of the seasonal rotifer assemblages at different distances (K1–K5)
from the inflow point. (To decrease overlap, the starting positions of the individual curves were
from the inflow point. (To decrease overlap, the starting positions of the individual curves were
displaced by three positions).
displaced by three positions).
3.3.2. Rényi Diversity Profiles
In spring, according to the Rényi diversity ordering, the unequivocally most diverse site was K5
(Figure 3). The other four assemblages could not be unequivocally ordered. At small values of the
scale parameter (emphasis on rare species), the order was K2 > K3 >K1 > K4. Over most of the range,Water 2020, 12, 1300 6 of 11
3.3.2. Rényi Diversity Profiles
In spring, according to the Rényi diversity ordering, the unequivocally most diverse site was
K5 (Figure 3). The other four assemblages could not be unequivocally ordered. At small values of
the scale parameter (emphasis on rare species), the order was K2 > K3 >K1 > K4. Over most of the
range, diversity increased with distance from the inflow (K4 > K3). There was little difference between
the first two sites, K1 and K2. In summer, the five assemblages did not show any easily interpretable
differences:
Water 2019, 11, xK4
FORwas unequivocally
PEER REVIEW more diverse than K2, K4 or K5, but mutual relationships6 with of 11
emphasis on rare species were chaotically different from values under higher influence of moderately
common or
common or dominant
dominant species.
species. In
In autumn,
autumn, both
both K1
K1 and
and K2
K2 were
were unequivocally more diverse
unequivocally more diverse than
than the
the
communities at the other three sites, which could also be unequivocally ordered among
communities at the other three sites, which could also be unequivocally ordered among themselves themselves
(K4 >
(K4 > K3
K3 >> K5).
K5). K1K1 was
was more
more diverse than K2
diverse than K2 only
only when
whenrare
rarespecies
specieswere
wereinfluential
influential(0(0<
< αα = 2 and thereafter, site K2 was the most diverse, and K5 the lowest (Figure
≥ 2 and thereafter, site K2 was the most diverse, and K5 the lowest (Figure 3). 3).
Spring Summer Autumn
3.0
3.0
3.0
K1
K2
2.5
2.5
2.5
K3
2.0
2.0
2.0
K4
Renyi index
Renyi index
Renyi index
K5
1.5
1.5
1.5
1.0
1.0
1.0
0.5
0.5
0.5
0.0
0.0
0 1 2 3 4 0 1 2 3 4 0.0 0 1 2 3 4
Scale parameter alpha
Figure 3. Rényi diversity profiles of the seasonal rotifer assemblages at different distances (K1–K5)
Figure 3. Rényi diversity profiles of the seasonal rotifer assemblages at different distances (K1–K5)
from the inflow point in the Kákafok oxbow lake.
from the inflow point in the Kákafok oxbow lake.
Regarding the seasonal biodiversity of the sampling points, a clear ordering can only be identified
Regarding the seasonal biodiversity of the sampling points, a clear ordering can only be
for K5. In this case, the spring > summer > autumn order can be seen (Figure 4). At the point of inflow
identified for K5. In this case, the spring > summer > autumn order can be seen (Figure 4). At the
(K1), the initial, rare-species-influenced order of summer > autumn > spring changed to autumn >
point of inflow (K1), the initial, rare-species-influenced order of summer > autumn > spring changed
summer > spring at higher values of α. Diversity in autumn was clearly higher than in spring. For K2,
to autumn > summer > spring at higher values of α. Diversity in autumn was clearly higher than in
the order of summer > spring > autumn at α = 0 changed to autumn > summer > spring at α = 1 and at
spring. For K2, the order of summer > spring > autumn at α = 0 changed to autumn > summer > spring
α = 2: rotifer diversity in summer was clearly higher than in spring. At the third point (K3), the highest
at α = 1 and at α = 2: rotifer diversity in summer was clearly higher than in spring. At the third point
diversity was found in spring, but the order of summer>autumn at α = 0 scale parameter reversed at α
(K3), the highest diversity was found in spring, but the order of summer>autumn at α = 0 scale
= 1. At the fourth point (K4), rotifer diversity was clearly the lowest in autumn. The other two profiles
parameter reversed at α = 1. At the fourth point (K4), rotifer diversity was clearly the lowest in
crossed each other twice. At α = 0 rotifer diversity was greater in summer than in spring. This was
autumn. The other two profiles crossed each other twice. At α = 0 rotifer diversity was greater in
reversed at α = 1 and turned back at α = 2, meaning that while there were more species in summer,
summer than in spring. This was reversed at α = 1 and turned back at α = 2, meaning that while there
these were rare, and the assemblage was dominated more by the common species.
were more species in summer, these were rare, and the assemblage was dominated more by the
common species.Water 2020, 12, 1300 7 of 11
Water 2019, 11, x FOR PEER REVIEW 7 of 11
3.0 K1 K2 K3
3.0
3.0
spring
summer
2.5
2.5
2.5
autumn
2.0
2.0
2.0
Renyi index
Renyi index
Renyi index
1.5
1.5
1.5
1.0
1.0
1.0
0.5
0.5
0.5
0.0
0.0
0.0
0 1 2 3 4 0 1 2 3 4 0 1 2 3 4
K4 K5
3.0
3.0
2.5
2.5
2.0
2.0
Renyi index
Renyi index
1.5
1.5
1.0
1.0
0.5
0.5
0.0
0.0
0 1 2 3 4 0 1 2 3 4
Scale parameter alpha
Figure
Figure 4. Rényi diversity
4. Rényi diversity profiles
profiles of
of rotifer
rotifer assemblages
assemblages in
in different
different seasons
seasons per
per distance
distance (K1–K5)
(K1–K5) from
from
the inflow point in the Kákafok oxbow
the inflow point in the Kákafok oxbow lake.lake.
4. Discussion
4. Discussion
The survey indicated a species-rich rotifer fauna with 26 species (2 identified only to genus level).
The survey indicated a species-rich rotifer fauna with 26 species (2 identified only to genus level).
An earlier survey [33] found 13 and 8 species in the adjacent, protected Aranyos and Borza oxbow lakes,
An earlier survey [33] found 13 and 8 species in the adjacent, protected Aranyos and Borza oxbow
respectively, and 14 species in the similar oxbow lake of Dán-zug. In the Hármas-Körös, the parent
lakes, respectively, and 14 species in the similar oxbow lake of Dán-zug. In the Hármas-Körös, the
river of the Kakafok oxbow, a survey conducted 25 years ago found 65 species [50], but 10 species
parent river of the Kakafok oxbow, a survey conducted 25 years ago found 65 species [50], but 10
present in the Kákafok oxbow lake were missing from that list. An extensive, 2 years survey in the
species present in the Kákafok oxbow lake were missing from that list. An extensive, 2 years survey
oxbows near the Danube at Gemenc (between 1503 km and 1469 km), found 71 rotifer taxa [51], 16 of
in the oxbows near the Danube at Gemenc (between 1503 km and 1469 km), found 71 rotifer taxa [51],
which were in common with our survey. However, 8 found in ours (30%) were not present in the
16 of which were in common with our survey. However, 8 found in ours (30%) were not present in
Danube, indicating the taxonomic distinctness between the Danube and the Tisza Rivers.
the Danube, indicating the taxonomic distinctness between the Danube and the Tisza Rivers.
Most of the species found in the Kákafok oxbow lake were characteristic of oligo- and
Most of the species found in the Kákafok oxbow lake were characteristic of oligo- and oligo/β
oligo/β mesosaprobic waters [17] except the Brachionus species that prefers contaminated, β and
mesosaprobic waters [17] except the Brachionus species that prefers contaminated, β and β/α
β/α mesosaprobic water bodies [17]. The species we detected (Brachionus angularis, B. calyciflorus,
mesosaprobic water bodies [17]. The species we detected (Brachionus angularis, B. calyciflorus, B.
B. diversicornis, B. falcatus, B. forficula, B. leydigi, B. nilsoni, B. quadridentatus, B. urceolaris and B. variabilis)
diversicornis, B. falcatus, B. forficula, B. leydigi, B. nilsoni, B. quadridentatus, B. urceolaris and B. variabilis)
typically occurred in summer, mainly at K1–K2 points, indicating the impact of the effluent water
typically occurred in summer, mainly at K1–K2 points, indicating the impact of the effluent water
combined with favourable thermal conditions. We found more Brachionus spp. than in the two
combined with favourable thermal conditions. We found more Brachionus spp. than in the two
previous studies [33,50], which mostly belonged to the β mesosaprobic indicator group [17,18]. Species
previous studies [33,50], which mostly belonged to the β mesosaprobic indicator group [17,18].
previously detected in the mother river are Brachionus angularis, B. bennini, B. falcatus, B. budapestiensis,
Species previously detected in the mother river are Brachionus angularis, B. bennini, B. falcatus, B.
B. calyciflorus, B. urceolaris and B. quadridentatus [50], and in the other three oxbow lakes Brachionus
budapestiensis, B. calyciflorus, B. urceolaris and B. quadridentatus [50], and in the other three oxbow lakes
bidentata, B. quadridentatus and B. calyciflorus were found [33]. In our samples, the most common species
Brachionus bidentata, B. quadridentatus and B. calyciflorus were found [33]. In our samples, the most
and in most places (Brachionus calyciflorus) also belonged to this genus. Trophic conditions are related
common species and in most places (Brachionus calyciflorus) also belonged to this genus. Trophic
to saprobic ones [52,53]. These species are also indicators of trophic conditions [11–14,16]. A similar
conditions are related to saprobic ones [52,53]. These species are also indicators of trophic conditions
species is Trichocerca pusilla in the work of Berzins [11], Jarenefelt [13], Thunmark [14] and Pejler [16]
[11–14,16]. A similar species is Trichocerca pusilla in the work of Berzins [11], Jarenefelt [13], Thunmark
which also appeared only sporadically at the point of influx in summer and autumn. Sladacek [18]
[14] and Pejler [16] which also appeared only sporadically at the point of influx in summer and
suggested that we can deduce the trophic level from the quotient of Brachionus vs. Trichocerca species.
autumn. Sladacek [18] suggested that we can deduce the trophic level from the quotient of Brachionus
vs. Trichocerca species. However, we could not apply this parameter because Trichocerca spp. couldWater 2020, 12, 1300 8 of 11
However, we could not apply this parameter because Trichocerca spp. could only be detected twice,
at the point of influence in summer and autumn. However, most Brachionus species can also be
detected here.
Our initial hypotheses were only partially supported by the data. The diversity profiles provide
more sophisticated and articulated results than the usual one-dimensional diversity indices [54,55].
In spring, as we expected, the biodiversity increased with increasing distance from the point of inflow,
but after a summer transition period, the situation became partially reversed during autumn. There
was no clear seasonal difference between the inflow point and the closest one, indicating that the effect
of the effluent did not decrease at a distance of 500 m. In most cases, (spring and autumn), and for rare
species in summer, point K3 showed medium diversity, conforming to our hypothesis. By summer,
this site became the one of the lowest diversities as a result of a few species reaching high abundance
and dominating the assemblage. The third most distant point (K4) gave surprising results. While by
the end of the study period it could be clearly ranked, in spring it became the second most diverse
community when the influence of rare species diminished. Unexpectedly, even in summer, diversity at
K4 point was significantly higher than nearer and farther from the influx point. The probable reason
is the presence of several species at higher abundance, which possibly competed with each other,
and none of them managed to dominate the assemblage, creating high evenness in the assemblage.
The most distant point (K5) was the most diverse in spring and the least diverse in autumn. In summer,
its rotifer diversity was not clearly different from those at the other points. Comparing the different
sampling points, the decreasing abundance with increasing distance from the inflow was most often
observed in Brachionus species, which are indicators of more saprobic waters [17]. At the point of
aquaculture inlet (K1) and nearby (K2), Brachionus spp. showed greater dominance in the same species
set, leading to a decrease of diversity in spring. The species pool reached its maximum in summer;
however, due to the predominance of more saprobic species, it did not result in a clearly identifiable
increase in diversity. In autumn, the number of species and individuals decreased at the more distant
points, while at the point of inflow a relatively rich and abundant community emerged. The monthly
sampling may capture seasonal trends; however, given that rotifer generation time (from hatching
to maturity) is typically about 24 h, monthly sampling likely missed changes in rotifer communities
that occur on a shorter time scale. Nonetheless, our survey indicated that rotifer species richness was
higher than previously documented.
Summarizing, we detected a seasonally different effect of the aquaculture effluent in the
composition of the rotifer community of the Kákafok oxbow lake. This effect was strongest during
spring and autumn. In summer, the differences in taxonomic diversity disappeared. According to our
investigations at the beginning of the study period, around the nutrient-rich effluent the dominance of
common species increased. The differences in dominance decreased but did not disappear in summer.
In autumn, however, the extra nutrient inflow enabled the maintenance of a diverse community at
the point of effluent inlet. The question rightly arises as to how other factors (biotic interactions,
phylogenetic connections, etc.) may have influenced the results. In addition, other environmental
factors that had not yet been examined may play a role, including competition with copepods and
cladocerans and predation or food availability. Due to the presence of closely related and different
saprobiotic indicator species, functional and phylogenetic analysis may provide additional information.
Supplementary Materials: The following are available online at http://www.mdpi.com/2073-4441/12/5/1300/s1,
Table S1: The list of rotifer species of the sample sites (K1–K5) every season, and the calculated number of
individuals in the Kákafok oxbow lake, 2016.
Author Contributions: Conceptualization, É.K., and K.Z.; methodology, F.T., G.L.L. and L.K.; software, F.T.
and L.K.; validation, L.K.; formal analysis, F.T.; writing—original draft preparation, F.T.; writing—review and
editing, L.K., K.Z., É.K., L.B.-N. and G.L.L.; visualization, L.K., T.F.; supervision, K.Z., L.K. and G.L.L.; project
administration, F.T., G.L.L.; data analysis, F.T., L.B.-N., sampling, F.T., L.B.-N., zooplankton identification, K.Z.
All authors have read and agreed to the published version of the manuscript.Water 2020, 12, 1300 9 of 11
Funding: During evaluation, F.T. was a recipient of a Hungarian-Danish mobility internship supported by
Campus Mundi scholarship program of the Hungarian Tempus Public Foundation and the Hungarian Ministry
of Agriculture.
Acknowledgments: We thank Marco Ferrante for support in using R statistical software, John Beaver and two
anonymous reviewers for their useful comments.
Conflicts of Interest: The authors declare no conflict of interest.
References
1. FAO. The State of World Fisheries and Aquaculture 2018—Meeting the Sustainable Development Goals; Food and
Agriculture Organisation: Rome, Italy, 2018; Available online: http://www.fao.org/3/i9540en/I9540EN.pdf
(accessed on 3 May 2020).
2. Edwards, P. Aquaculture environment interactions: Past, present and likely future trends. Aquaculture 2015,
447, 2–14. [CrossRef]
3. Kerepeczki, É; Gál, D.; Szabó, P.; Pekár, F. Preliminary investigations on the nutrient removal efficiency of a
wetland-type ecosystem. Hydrobiologia 2003, 506–509, 665–670.
4. Čížková, H.; Květ, J.; Comín, F.A.; Laiho, R.; Pokorný, J.; Pithart, D. Actual state of European wetlands and
their possible future in the context of global climate change. Aquati. Sci. 2013, 75, 3–26. [CrossRef]
5. Carp, E. International Conference on the Conservation of Wetlands and Waterfowl. In Proceedings of the
International Conference on the Conservation of Wetlands and Waterfowl, Ramsar, Iran, 20 January–3
February 1971; IWRB: Slimbridge, UK, 1972; p. 303.
6. Pinke, Z. Modernization and decline: An eco-historical perspective on regulation of the Tisza Valley, Hungary.
J. Historical Geogr. 2014, 45, 92–105. [CrossRef]
7. Somogyi, S. Geographical and Ecological Effects of 19th Century River Regulations and Flood Control in Hungary;
Geographical Research Institute, Hungarian Academy of Sciences: Budapest, Hungary, 2000. (In Hungarian)
8. Pálfai, I. Oxbows of Hungary; Hungarian Ministry of Transport and Water: Budapest, Hungary, 2001.
(In Hungarian)
9. Duggan, I.C.; Green, J.D.; Shiel, R.J. Distribution of rotifers in North Island, New Zealand, and their potential
use as bioindicators of lake trophic state. Rotifera 2001, IX, 155–164.
10. Caroni, R.; Irvine, K. The potential of zooplankton communities for ecological assessment of lakes: Redundant
concept or political oversight? Biol. Environ. Proc. R. Irish Acad. 2010, 110B, 35–53. [CrossRef]
11. Berzins, B. Contribution to the limnology of South-eastern Latvia. Schweiz. Z. Hydrol. 1949, 11, 583–607.
(In German)
12. Lillieroth, S. On the consequences of artificial water level decrease for macrophytic and planktonic
communities in the shallow lakes of the southern Swedish oligotrophic region: A study with particular
attention to applied limnology. Acta Limnol. 1950, 3, 1–288. (In Germain)
13. Jarnefelt, H. Plankton as indicator of the trophic status of lakes. Ann. Acad. Sci. Fenn. (Ser. A) 1952, 18, 1–29.
(In German)
14. Thunmark, S. Contribution to the sociology of freshwater plankton. An ecological-methodological study.
Folia Limnol. Scand. 1945, 3, 1–66. (In German)
15. Pejler, B. Taxonomical and ecological studies on plankton Rotatoria from central Sweden. K. Svenska Vetensk
Akad. Handl. 1957, 6, 1–52.
16. Pejler, B. Regional ecological studies of Swedish freshwater zooplankton. Zool. Bidrag. Fran. Upp. 1965, 36,
407–515.
17. Gulyás, P. COMECON Biological methods. Vízügyi Hidrobiol. 1983, 12, 163–216. (In Hungarian)
18. Sládeček, V. Rotifers as indicators of water quality. Hydrobiologia 1983, 100, 169–201. [CrossRef]
19. Ejsmont-Karabin, J. The usefulness of zooplankton as lake ecosystem indicators: Rotifer trophic state index.
Pol. J. Ecol. 2012, 60, 339–350.
20. Ochocka, A.; Pasztaleniec, A. Sensitivity of plankton indices to lake trophic conditions. Environ. Monit.
Assess. 2016, 188, 622. [CrossRef]
21. Finlay, B.J. Global dispersal of free-living microbial eukaryote species. Science 2002, 296, 1061–1063. [CrossRef]
22. Fenchel, T.; Finlay, B.J. The ubiquity of small species: Patterns of local and global diversity. Bioscience 2004,
54, 777–784. [CrossRef]Water 2020, 12, 1300 10 of 11
23. Segers, H.; de Smet, W.H. Diversity and endemism in Rotifera: A review, and Keratella Bory de St Vincent.
Biodivers. Conserv. 2008, 17, 303–316. [CrossRef]
24. Dumont, H.J. Biogeography of rotifers. Dev. Hydrobiol. 1983, 14, 19–30. [CrossRef]
25. Segers, H. Global biodiversity of rotifers (Rotifera) in freshwater. Hydrobiology 2008, 595, 49–59. [CrossRef]
26. Wallace, R.L.; Snell, T.W.; Ricci, C.; Nogrady, N. Rotifera Biology, Ecology and Systematics; Backhuys Publishers:
Leiden, The Netherlands, 2006.
27. Allan, J.D. Life history patterns in zooplankton. Am. Nat. 1976, 110, 165–180. [CrossRef]
28. Gannon, J.E.; Steinberger, R.S. Zooplankton (especially crustaceans and rotifers) as indicators of water quality.
Trans. Am. Micros. Soc. 1978, 97, 16–35. [CrossRef]
29. Marbá, N.; Krause-Jensen, D.; Alcoverro, T.; Birk, S.; Pederson, A.; Neto, J.M.; Orfanidis, S.; Garmendia, J.M.;
Muxika, I.; Borja, A.; et al. Diversity of European seagrass indicators: Patterns within and across regions.
Hydrobiologia 2013, 546, 397–404.
30. Megyeri, J. Plankton studies on the River Tisza at Szeged. Hidrol. Köziemenyek 1955, 35, 280–292.
(In Hungarian)
31. Zsuga, K. The ecological conditions of the Cris/Körös catchment area on the basis of planktonic fauna.
In The Criş/Körös River Valley: A Study of the Geography, Hydrobiology and Ecology of the River System and Its
Environment; TISCIA Monograph Series; Sárkány-Kiss, A., Hamar, J., Eds.; Tisza Club & Liga Pro Europa:
Szolnok-Szeged, Hungary; Tirgu-Mures, Romania, 1997; Volume 2, pp. 135–152.
32. Zsuga, K. Long-term zooplankton investigations in the Hungarian section of the Körös catchment area.
In The Criş/Körös River Valley: A Study of the Geography, Hydrobiology and Ecology of the River System and Its
Environment; TISCIA Monograph Series; Sárkány-Kiss, A., Hamar, J., Eds.; Tisza Club & Liga Pro Europa:
Szolnok-Szeged, Hungary; Tirgu-Mures, Romania, 1997; Volume 2, pp. 153–164.
33. Gulyás, P. Rotatoria and crustacea studies in the surface waters of the Körös-Maros National Park. Crisicum
2000, 3, 111–139. (In Hungarian)
34. Rényi, A. On measures of entropy and information. In Proceedings of the 4th Berkeley Symposium on
Mathematical Statistics and Probability, Berkeley, CA, USA, 30 June–30 July 1960; Neyman, J., Ed.; University
of California Press: Berkeley, CA, USA, 1961; pp. 547–561.
35. Gliwicz, Z.M. Studies on the feeding of pelagic zooplankton in lakes with varying trophy. Ekol. Pol. 1969,
17A, 663–708.
36. Odum, E.P. The Strategy of ecosystem development. Science 1969, 164, 262–270. [CrossRef]
37. Józsa, V.; Kozłowski, J.; Zróbek-Sokolnik, A.; Kozłowski, K.; Dynowski, P. Classification of the Oxbow Lakes
of the Hármas-Körös River and Determination of Ways for Further Exploiting the Various Water Regions
in the Light of the Water Framework Directive. In Proceedings of the “Environmental Engineering” 10th
International Conference, Vilnius, Lithuania, 27–28 April 2017.
38. Tóth, F.; Berzi-Nagy, L.; Kerepeczki, É. Preliminary assessment of the most important water quality parameters
of the Bikazugi Holt-Körös. In Proceedings of the 41st Meeting of Fisheries Science, Szarvas, Hungary,
14–15 June 2017; p. 52. (In Hungarian).
39. Tóth, F.; Kerepeczki, É.; Berzi-Nagy, L. Efficiency of an established wetland water treatment system based
on renewable energy and its zooplankton production potential. In Proceedings of the 2nd Meeting of the
Training Young Scientist Program, Szeged, Hungary, 14–15 December 2017; National Agricultural and
Innovation Centre: Gödöllő, Hungary, 2018; pp. 35–44. (In Hungarian).
40. ISO. Water Quality—Determination of Nitrogen. Part 1: Method Using Oxidative Digestion with Peroxodisulfate;
International Organization for Standardization: Geneva, Switzerland, 1997.
41. ISO. Water Quality—Determination of Phosphorus—Ammonium Molybdate Spectrometric Method; International
Organization for Standardization: Geneva, Switzerland, 2004.
42. ISO. Water Quality—Determination of Suspended Solids by Filtration through Glass-Fibre Filters; International
Organization for Standardization: Geneva, Switzerland, 1997.
43. Bancsi, I. Identification keys for Rotifera I. In Vízügyi Hidrobiológia, 15; Országos Vízügyi Hivatal: Budapest,
Hungary, 1986. (In Hungarian)
44. Bancsi, I. Identification keys for Rotifera II. In Vízügyi Hidrobiológia, 17; Országos Vízügyi Hivatal: Budapest.
Hungary, 1988. (In Hungarian)
45. R-Forge, Welcome to Vegan—Community Ecology Package Project! Available online: http://vegan.r-forge.r-
project.org/ (accessed on 18 March 2020).Water 2020, 12, 1300 11 of 11
46. The R Project for Statistical Computing. Available online: http://www.r-project.org/ (accessed on 18 March
2020).
47. Whittaker, R.H. Dominance and Diversity in Land Plant Communities: Numerical relations of species
express the importance of competition in community function and evolution. Science 1965, 147, 250–260.
[CrossRef]
48. Southwood, T.R.E.; Henderson, P.A. Ecological Methods, 3rd ed.; Blackwell Science Ltd.: Oxford, UK, 2009.
49. Lövei, G.L.; Liu, W.; Guo, J.; Wan, F. The use of the Rényi scalable diversity index to assess diversity trend sin
comparative and monitoring studies of effects of transgenic crops. J. Biosaf. 2013, 22, 43–50.
50. Gulyás, P.; Bancsi, I.; Zsuga, K.V. Rotatoria and Crustacean fauna of the Hungarian watercourses. Miscellinea
Zool. Hung. Tomus 1995, 10, 21–47.
51. Schöll, K. Diversity of planktonic rotifer assemblages in the water bodies of the Gemenc floodplain
(Duna-Dráva National Park, Hungary). Biologia 2009, 64, 951–958. [CrossRef]
52. Kolkwitz, R. Plant Physiology, 3rd ed.; VEB Gesellschaft: Jena, Germany, 1935. (In Germain)
53. Sládeček, V. Relation of saprobic to trophic levels. Int. Ver. Theor. Angew. Limnol.: Verh. 1978, 20, 1885–1889.
(In Germain)
54. Lövei, G.L. Generalised entropy indices have a long history in ecology-a comment. Community Ecol. 2005, 6,
245–247. [CrossRef]
55. Tóthmérész, B. Comparison of different methods for diversity ordering. J. Veg. Sci. 1995, 6, 283–290.
[CrossRef]
© 2020 by the authors. Licensee MDPI, Basel, Switzerland. This article is an open access
article distributed under the terms and conditions of the Creative Commons Attribution
(CC BY) license (http://creativecommons.org/licenses/by/4.0/).You can also read