Seasonal Variation in Visitor Satisfaction and Its Management Implications in Banff National Park - MDPI
←
→
Page content transcription
If your browser does not render page correctly, please read the page content below
sustainability

Article
Seasonal Variation in Visitor Satisfaction and Its Management
Implications in Banff National Park
Dehui Christina Geng, John L. Innes                    , Wanli Wu, Weiwei Wang and Guangyu Wang *

                                          National Park Research Centre, Faculty of Forestry, University of British Columbia, 2424 Main Mall,
                                          Vancouver, BC V6T 1Z4, Canada; dehui@mail.ubc.ca (D.C.G.); john.innes@ubc.ca (J.L.I.);
                                          wwu23@mail.ubc.ca (W.W.); wwwang28@mail.ubc.ca (W.W.)
                                          * Correspondence: guangyu.wang@ubc.ca

                                          Abstract: Seasonal variations in tourist satisfaction is an important issue for the sustainable man-
                                          agement of national parks worldwide. Visitors should have high-quality experiences in both the
                                          high season and the off-season. This research investigated visitor satisfaction patterns and determi-
                                          nants in Banff National Park in different seasons. The study was conducted through a face-to-face
                                          questionnaire survey that collected visitor demographic, expectation and satisfaction data in July
                                          2019 (high season) and December 2019 (off-season) in Banff National Park. The data analyses were
                                          based on a sample of 741 respondents and were processed using principal component analysis,
                                          correlation analysis and logistic regression models for different seasons. There were significant
                                          differences in visitor satisfaction levels and their determinants in different seasons. The quality of
                                          the park’s natural characteristics and the park’s activities were the most important determinant of
                                          visitor satisfaction in the high season and off-season, respectively. The correlation between visitor
                                satisfaction and expectations in the high season was generally negative, whereas all correlations in

                                          the off-season were positive. The results fill a knowledge gap by examining the seasonal differences
Citation: Geng, D.C.; Innes, J.L.; Wu,    in visitor experience and their determinants in the national park, and by building a bridge between
W.; Wang, W.; Wang, G. Seasonal           visitor experience and tourism seasonality. The findings may assist both practitioners and scholars
Variation in Visitor Satisfaction and
                                          in understanding visitor expectations and satisfaction in different seasons. They may assist in the
Its Management Implications in Banff
                                          prioritization and effective management of the park to optimize the visitor experience in both seasons
National Park. Sustainability 2021, 13,
                                          and achieve tourism sustainability.
1681. https://doi.org/10.3390/
su13041681
                                          Keywords: tourism seasonality; visitor experience; sustainable tourism; questionnaire survey; na-
Academic Editor: Kyle
                                          tional park; tourism management
Maurice Woosnam
Received: 13 January 2021
Accepted: 29 January 2021
Published: 4 February 2021                1. Introduction
                                               Tourism seasonality—the regularly occurring variation in the supply and demand of
Publisher’s Note: MDPI stays neutral      tourism—is one of the greatest challenges affecting sustainable tourism [1,2]. In the context
with regard to jurisdictional claims in   of national parks, tourism seasonality represents a temporal and spatial imbalance in the
published maps and institutional affil-   number of visitors through the course of the year. It can also be represented in different
iations.                                  elements, such as expenditures by visitors, traffic and other forms of transportation and
                                          the flow of employment [2–6]. Tourism seasonality and its associated social, economic
                                          and environmental impacts are generally perceived to produce negative effects on tourism
                                          destinations. It can be a major problem faced by national parks and needs to be tackled at
Copyright: © 2021 by the authors.         the operational and marketing level [2,3,7–9].
Licensee MDPI, Basel, Switzerland.             The dimensions and influencing factors of seasonality have been analyzed in past
This article is an open access article    research. Tourism seasonality has two dimensions, natural and institutional seasonal-
distributed under the terms and           ity [10–14]. Natural (or physical) seasonality represents the temporal variation in the
conditions of the Creative Commons        natural environment. The influencing factors of natural seasonality can be the climate and
Attribution (CC BY) license (https://
                                          weather in national parks and their effects on particular seasonal qualities (such as leaf
creativecommons.org/licenses/by/
                                          colour), and visitors’ personal preferences [14,15]. Another dimension of tourism variation
4.0/).

Sustainability 2021, 13, 1681. https://doi.org/10.3390/su13041681                                       https://www.mdpi.com/journal/sustainability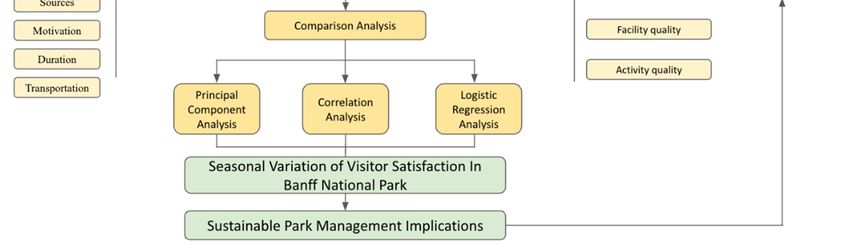
Sustainability 2021, 13, 1681                                                                                            2 of 17

                                is the institutional seasonality, which has three driving factors, including holidays, travel
                                motivations and events held at the destination [12,16]. Both natural and institutional
                                seasonality can cause significant impacts on the amount of tourism. The imbalance in
                                visitor numbers in national parks has affected the optimal use of park facilities, services
                                and resources [17,18], creating issues for sustainable management of tourism.
                                      The negative impacts of tourism seasonality and the high levels of competition
                                amongst tourism destinations (especially during the off-season) mean that national parks
                                are paying greater attention to visitor satisfaction and experience management [19,20]. Park
                                visitor satisfaction is defined as the congruence of expectation and experience, and can be
                                indirectly measured assessing the reactions of visitors to national park attributes such as
                                services, facilities and activities, as well as the set of natural characteristics that provide
                                the identity of a national park [21–23]. Visitor satisfaction is considered to be one of the
                                most important destination performance indicators and a source of competitive advantage
                                that can increase visitor numbers and loyalty, contributing to tourism sustainability and
                                political support [20,24–27].
                                      For a national park to reduce the negative impacts of seasonality and achieve sus-
                                tainable tourism, park managers need to evaluate visitor experiences at all times of the
                                year [7,28]. However, past research is limited in two ways. First, although many stud-
                                ies have been done to investigate visitor satisfaction with tourism destinations, partic-
                                ularly during the high season(s), fewer studies examine visitor satisfaction during the
                                off-season [29]. Second, there has been little research examining the impacts of the off-
                                season on visitor satisfaction in order to bridge the knowledge gap between tourism
                                seasonality and visitor satisfaction [7,30]. According to Baum and Lundtorp [31], the prob-
                                lem of understanding seasonality in tourism is related to the lack of deep and longitudinal
                                studies. This paper is based on questionnaire data collected in both the summer and
                                winter in Banff National Park. A comparison of visitor satisfaction is made between the
                                high season and off-season in order to analyze seasonal variation in national park visitor
                                satisfaction and provide recommendations for visitor experience management. In addition,
                                recommendations for marketing strategies are suggested that can be used to mitigate and
                                ameliorate the effects of tourism seasonality in national parks. This research is novel in that
                                it builds a bridge between visitor experience and tourism seasonality in national parks, as
                                well as analyzing the visitor experience and its determinants in the park both seasons. It
                                also provides valuable national park management recommendations for both academics
                                and practitioners to achieve sustainable tourism management.

                                2. Tourism Seasonality and Visitor Satisfaction in National Parks
                                2.1. Causes and Measures of Tourism Seasonality in Banff National Park
                                     Banff National Park is a case of a tourism destination that has been affected by
                                substantial tourism seasonality (Figure 1). It is Canada’s oldest national park, having been
                                established in 1885, and has experienced an increasing number of visitors since 2010 [32].
                                In 2019, more than four million people visited Banff National Park, which makes it the
                                most visited national park in Canada [33]. However, according to Figure 1, Banff National
                                Park experiences significant tourism seasonality, and the level of seasonality has intensified,
                                with an increasing proportion of visitors arriving in the high season. The greatest numbers
                                of visits occur in July and August, with significantly fewer occurring in the winter months.
                                     There are several potential causes of tourism seasonality in national parks. Natural
                                seasonality in Banff National Park includes the temporal variations in the climate, hours
                                of daylight, the variability of temperature and weather, all of which can cause seasonal
                                tourism variation [34]. For example, weather can reduce visitor numbers in winter due to
                                the access problems caused by snow blocking roads [11]. In particular, according to the
                                research done by Lundtorp et al. [8], the further the tourist destination is from the equator,
                                the higher the impact caused by seasonality. The impact at Banff may be attenuated slightly
                                by the presence of the Lake Louise ski area.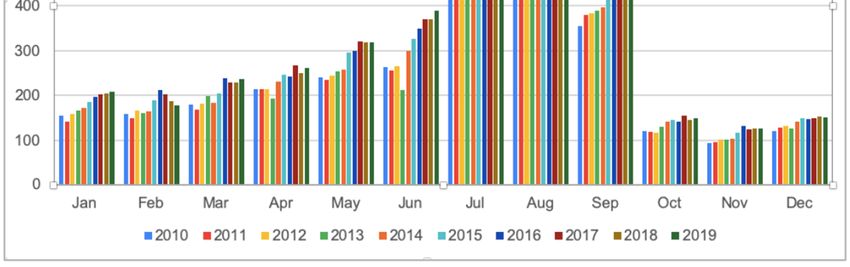
Sustainability 2021, 13, 1681 3 of 17
Sustainability 2021, 13, x FOR PEER REVIEW 3 of 17
Figure 1. The
Figure Themonthly
monthlydistribution of visitor
distribution numbers
of visitor (in thousands)
numbers in Banff
(in thousands) National
in Banff Park from
National Park
2010–2019.
from 2010–2019.
Compared to natural
There are several seasonality,
potential causes institutional seasonalityinisnational
of tourism seasonality more variable [35,36].
parks. Natural
Institutional
seasonality inseasonality refersPark
Banff National to the temporal
includes the variation caused by in
temporal variations human actionshours
the climate, and
associated
of daylight,policies and includes
the variability such factorsand
of temperature as available
weather, leisure time, travel
all of which motivations,
can cause seasonal
and
tourismthe timing
variationof [34].
special
Forevents
example, in the destination
weather can reduce[3,34,37].
visitorSpecifically,
numbers in holidays
winter due andto
religious events directly affect the availability of travel time; social
the access problems caused by snow blocking roads [11]. In particular, according to the pressure, fashion,
tradition
research and donechanging tastesetare
by Lundtorp al.significant causes
[8], the further theoftourist
travel destination
habits and motivation.
is from the Activity
equator,
opportunities,
the higher the specialimpactevents
causedand by sports seasons
seasonality. also
The can cause
impact additional
at Banff may beinstitutional
attenuated
seasonality
slightly by the [11,12,16,34].
presence of The pleasant
the Lake Louiseweather and long daytime combined with the
ski area.
tradition
Compared to natural seasonality, institutionalreasons
of summer family holidays are the primary for theispeak
seasonality more in variable
visitor numbers
[35,36].
during the summer months in Banff National Park.
Institutional seasonality refers to the temporal variation caused by human actions and
National
associated park seasonality
policies and includes can be measured
such by the numbers
factors as available leisure and
time,expenditures of visi-
travel motivations,
tors, highway traffic and other types of transportation toward and
and the timing of special events in the destination [3,34,37]. Specifically, holidays andwithin the park, as well
re-
as the employment at and occupancy of park accommodation [35,38]. Butler
ligious events directly affect the availability of travel time; social pressure, fashion, tradi- and Mao [10]
first
tion classified
and changingthe three different
tastes patterns of
are significant seasonality,
causes of travelnamely
habits(i)andone-peak, (ii) two-peak,
motivation. Activity
and (iii) non-peak. One-peak seasonality is typically defined as a
opportunities, special events and sports seasons also can cause additional institutionalsignificant spike in park
attendance during the high-season in the summer months; two-peak
seasonality [11,12,16,34]. The pleasant weather and long daytime combined with the tra- seasonality usually
has
ditiontwoofpeak tourism
summer seasons;
family holidaysnon-peak
are theseasonality is characterized
primary reasons for the peak by innovisitor
seasonal varia-
numbers
tion of visitor numbers throughout
during the summer months in Banff National Park.the year. According to Figure 1, Banff National Park is
categorized as a destination with one-peak seasonality occurring during the high-season of
National park seasonality can be measured by the numbers and expenditures of vis-
July and August.
itors, highway traffic and other types of transportation toward and within the park, as
To measure tourism seasonality, the seasonality ratio is calculated by using the month
well as the employment at and occupancy of park accommodation [35,38]. Butler and Mao
with the highest number of visitors divided by the average number of visitors per month,
[10] first classified the three different patterns of seasonality, namely (i) one-peak, (ii) two-
with a higher ratio indicating a higher degree of seasonality [38]. Based on data collected
peak, and (iii) non-peak. One-peak seasonality is typically defined as a significant spike
by the Government of Alberta [39], the tourism seasonality ratio of Banff National Park
in park attendance during the high-season in the summer months; two-peak seasonality
is calculated and represented in Table 1. IA seasonality ratio ≥ 2 can indicate extreme
usually has two peak tourism seasons; non-peak seasonality is characterized by no sea-
seasonality [40]. The tourism seasonality ratio at Banff National Park ranges from 2.13 to
sonal variation of visitor numbers throughout the year. According to Figure 1, Banff Na-
2.38, indicating significant and persistent tourism seasonality.
tional Park is categorized as a destination with one-peak seasonality occurring during the
high-season of July and August.
To measure tourism seasonality, the seasonality ratio is calculated by using the
month with the highest number of visitors divided by the average number of visitors per
month, with a higher ratio indicating a higher degree of seasonality [38]. Based on data
Sustainability 2021, 13, 1681 4 of 17
Table 1. Seasonality Ratio of Banff National Park (2010–2019) (in thousands).
January February March April May June July August September October November December Average Max Month Seasonality Ratio
2010 155.2 158.1 178.5 213.9 240.1 263.4 540.0 498.9 355.7 120.9 92.8 120.1 244.8 Jul 2.21
2011 140.6 148.7 167.1 212.9 234.2 256.4 549.9 503.0 380.6 119.1 95.7 127.6 244.7 Jul 2.25
2012 157.6 165.4 181.1 213.1 243.4 265.6 516.2 563.6 383.2 116.9 101.3 131.4 253.2 Aug 2.23
2013 165.1 159.9 198.5 193.1 253.1 211.4 512.1 603.8 389.0 129.1 101.4 125.3 253.5 Aug 2.38
2014 171.0 164.6 184.1 231.3 258.3 300.0 560.9 633.0 397.9 140.6 103.5 141.7 273.9 Aug 2.31
2015 184.9 188.6 203.8 246.7 296.4 326.0 630.5 631.3 433.0 145.8 116.7 148.1 296.0 Aug 2.13
2016 196.6 212.2 239.1 242.6 300.5 349.5 680.4 659.5 475.2 142.0 131.5 146.5 314.6 Jul 2.16
2017 201.7 201.6 228.4 267.8 320.0 370.6 688.3 674.8 491.7 154.3 123.2 148.1 322.5 Jul 2.13
2018 203.7 186.4 229.1 250.5 319.3 370.2 681.8 642.9 452.7 144.2 125.3 153.4 313.3 Jul 2.18
2019 208.1 177.9 236.8 262.2 317.8 389.1 688.5 723.8 472.3 149.7 126.0 151.4 325.3 Aug 2.23
2.2. Visitor Satisfaction and Seasonality
Visitor satisfaction is an indicator of the quality of visitor experiences in a tourism
destination. It confers an advantage by influencing the decision to recommend and re-
turn [20,26,29]. In addition, with the rise of social media, it has become easier and popular
for visitors to share their travel experiences about a tourism destination [41]. Various stud-
ies have found that national park visitor satisfaction is influenced by the park’s services and
natural characteristics as well as a given visitor’s travel motivation, number of previous
visits and expectation levels [42–46].
However, with the development of the tourism market, it is insufficient to analyze vis-
itor satisfaction without integrating seasonality. Visitors tend to have a different perception,
satisfaction and experience of a national park’s natural characteristics, services, facilities
and activities in different seasons [2,7]. According to Chen et al. [47], some additional
variables such as visitors’ personality, travel motivations and previous travel experiences
also influence visitor overall satisfaction. These driving factors should be further explored
to determine the impacts on visitor satisfaction combined with tourism seasonality in
national parks and other tourism destinations.
2.3. Impacts and Implications of Tourism Seasonality in National Parks
The impacts of tourism seasonality have been investigated and analyzed from both the
supply-side and the demand-side for various destinations. From the supply-side perspec-
tive, which includes local business owners, service and activity suppliers, employees and
communities, the impacts of tourism seasonality can be summarized into three categories:
economic impacts, facility impacts and ecological impacts [34,48]. The economic impacts
of tourism seasonality mainly refer to employment fluctuations and reduced profits for
local businesses. During the off-season, national park managers may have to lay off some
seasonal employees, which also causes a lack of career opportunities for individuals in
local and surrounding communities [49]. In addition, the off-season may also cause the
loss of skills, experience and commitment amongst some workers [11,50–52].
The facility impacts generated from tourism seasonality in national parks include the
over-utilization of facilities and pressure on the transport system and other infrastructure
provided by parks during the high season [11,52]. From an environmental protection and
conservation perspective, pollution issues and over-use of natural resources during the
high season have caused serious problems in park ecosystems and for biodiversity [48].
Park seasonality has caused negative impacts on the demand-side. Congestion, over-
crowding, higher prices, pollution and other infrastructure issues during the high season
can significantly reduce the quality of visitor experience [16,48]. For example, shortage of
park services and facilities caused by overcrowding during the high season in Banff Na-
tional Park are becoming serious due to the increasing numbers of visitors. Banff National
Park has had to shut down some popular natural scenic spots to protect wildlife habitat or
conserve ecological integrity during the high season, which also significantly reduces visi-
tor experience, especially for nature-based tourism [53,54]. Reducing the negative impacts
of tourism seasonality and ensuring year-round high-quality visitor experiences need to be
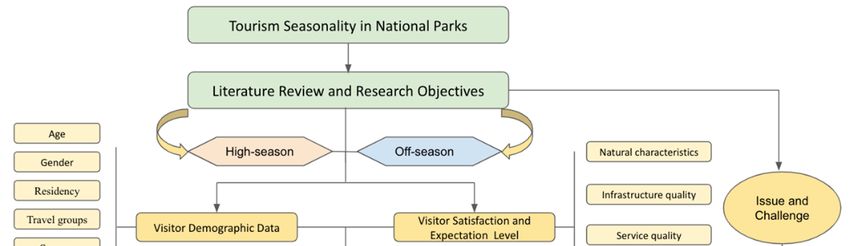
given more attention and require special management strategies. In view of these consider-
ations, this research had three objectives, including i) comparing the differences in visitor
satisfaction between high season and off-season in Banff National Park, ii) investigating the
seasonal variation in visitor overall satisfaction determinants and the relationship betweenPark has had to shut down some popular natural scenic spots to protect wildlife habitat
or conserve ecological integrity during the high season, which also significantly reduces
visitor experience, especially for nature-based tourism [53,54]. Reducing the negative im-
pacts of tourism seasonality and ensuring year-round high-quality visitor experiences
Sustainability 2021, 13, 1681 need to be given more attention and require special management strategies. In view of
5 of 17
these considerations, this research had three objectives, including i) comparing the differ-
ences in visitor satisfaction between high season and off-season in Banff National Park, ii)
investigating the seasonal variation in visitor overall satisfaction determinants and the
visitor expectation
relationship betweenand visitor
satisfaction by seasons,
expectation andand iii) assessing
satisfaction management
by seasons, implications
and iii) assessing
and providingimplications
management recommendations to reducerecommendations
and providing the negative impacts of tourism
to reduce seasonality,
the negative im-
ensuring a high level of visitor overall satisfaction in both seasons, and achieving
pacts of tourism seasonality, ensuring a high level of visitor overall satisfaction in both long
term tourism
seasons, and sustainability
achieving longfor national
term park
tourism management.
sustainability forThe structural
national parkframework
management. of
the research is shown in Figure 2.
The structural framework of the research is shown in Figure 2.
Figure 2.
Figure 2. The
The structural
structural framework
framework of
of the
the research.
research.
3.
3. Materials
Materials and
and Methods
Methods
3.1. Study Area
3.1. Study Area
As
As Canada’s first national
Canada’s first nationalpark
parkandanda aflagship
flagship
forfor Parks
Parks Canada’s
Canada’s system,
system, BanffBanff
Na-
National Park plays a significant role in providing a travel experience for visitors from
tional Park plays a significant role in providing a travel experience for visitors from all
all over Canada and the world [32]. The park was established in 1885 in a famous scenic
over Canada and the world [32]. The park was established in 1885 in a famous scenic nat-
natural and wilderness area in southwestern Alberta, Canada. Banff National Park is
ural and wilderness area in southwestern Alberta, Canada. Banff National Park is spread
spread over 6641 km2 with three ecoregions, including montane, alpine, and subalpine.
over 6641 km2 with three ecoregions, including montane, alpine, and subalpine. The
The unique geographical characteristics of the park provide spectacular natural beauty,
unique geographical characteristics of the park provide spectacular natural beauty, in-
including glaciers, forests, meadows, lakes and mountains. Banff welcomes more visitors
cluding glaciers, forests, meadows, lakes and mountains. Banff welcomes more visitors
than any other park in Canada, and is the third-most visited park in North America.
than any other park in Canada, and is the third-most visited park in North America. How-
However, the park is experiencing significant and persistent tourism seasonality, which
ever, the park is experiencing significant and persistent tourism seasonality, which has
has negatively affected not only the local employment and ecological integrity but also
negatively affected not only the local employment and ecological integrity but also deter-
determines the under- or over-utilization of park facilities, further reducing the quality
mines the under- or over-utilization of park facilities, further reducing the quality of visi-
of visitor experiences and posing a challenge for park managers attempting to achieve
tor experiences
sustainable and management
tourism posing a challenge
[55]. for park managers attempting to achieve sustain-
able Four
tourism management
popular sites with[55].
high visitor use within Banff National Park were selected for
Four popular
the survey, including sites
thewith
Town high visitorLake
of Banff, use within
Louise,Banff
BanffNational
SunshinePark were selected
Ski Resort, and Lakefor
the survey, including the Town of Banff, Lake Louise, Banff Sunshine Ski
Louise Ski Resort. The Town of Banff is a resort town located within the park, covering Resort, and Lake
Louise
3.93 Ski Resort.
square Thewith
kilometres Town of Banff is a resort
approximately town located
8000 residents livingwithin the park,
in the town and covering
tourism
3.93 square
being kilometres
the town’s with approximately
main economic driver. Lake 8000 residents
Louise livinglake
is a glacial in the townthe
within and tourism
park and
is renowned for its turquoise water. A variety of hiking trails and ski areas are accessible
around the lake. Banff Sunshine and Lake Louise ski resorts provide the longest ski season
in Canada and varied terrains for beginner, intermediate and expert skiers [56]. These four
sites represent the natural, economic, social and cultural values found in the park.
3.2. Questionnaire Development
The questionnaires used for this research consisted of two parts and were available
in English. Respondents took 10–15 min to complete the questionnaire survey. TheSustainability 2021, 13, 1681 6 of 17
questionnaires gauged indicators of visitor satisfaction concerning their expectations,
their overall impression of the park, as well as collecting some demographic information.
Satisfaction criteria include infrastructure, facilities, services and activities provided by
Banff National Park. Visitor satisfaction was measured using a five-point Likert type
ordinal scale with the following options: very satisfied, satisfied, neutral, dissatisfied, and
very dissatisfied.
3.3. Survey Procedure
A pre-test was conducted with a small sample of respondents from tourism-related
staff and students to identify any problems such as ambiguous wording and to judge how
long the questionnaire would take to administer. The final questionnaires were distributed
using face-to-face surveys in both July and December (i.e., the survey was conducted in
person by asking respondents to complete the questionnaire). One advantage of face-
to-face questionnaire surveys is the high response rate compared to other methods of
questionnaire distribution. The questions were simple, general and non-sensitive, which
reduced the probability that participant responses would be affected by questionnaire bias.
The responses were anonymous, reducing potential participants’ concerns about privacy
when answering questions.
Sampling took place at the four sites in the park daily from 8 am to 5 pm, including
weekends and national holidays in July 2019 and December 2019. Questionnaires were
distributed to a total of 778 visitors. 752 questionnaires were returned, and 741 of these had
valid answers, resulting in an effective response rate of 95%. Incomplete questionnaires
could be attributed to visitor fatigue, busy schedules and other concerns; incomplete
questionnaires were rejected from the statistical analysis.
3.4. Data Processing and Statistical Analysis
A comparative analysis was conducted to determine the seasonal variation of visitor
demographic and satisfaction data between high season and off-season in Banff National
Park, using SPSS 26.0. Principal component analysis (PCA) with varimax rotation was
conducted to reduce the dimension of the sub-criteria and to categorize the key factors
influencing visitor experience in the park. Correlation analysis between visitor expectations
and experiences with the park infrastructure, facilities and services, activities and natural
resources was also conducted to investigate potential seasonal differences. A logistic
regression analysis was used to build the visitor experience model and explore the impact
of the factors affecting visitor satisfaction in the different seasons.
4. Results
4.1. Principal Component Analysis (PCA) on Visitor Satisfaction Criteria by Seasons
Principal component analysis with varimax rotation was conducted to reduce the
dimensions of the 27 satisfaction variables. This resulted in different component groups of
visitor satisfaction variables between high season and off-season in the park (Table 2).
The principal components of visitor satisfaction variables between July and Decem-
ber are shown in Table 2. For July, the principal component analysis generated eight
components based on the respondents’ questionnaires collected, explaining 78.1% of the
total visitor satisfaction variables. The most important component in the high season
was the natural characteristics, encompassing flora, fauna, landscape view and trip maps.
For December, there were only six components for visitor satisfaction variables, with the
KMO = 0.909. Unlike the results for the summer season, park activities played a more
significant role in visitor satisfaction variables, including tubing, hostels, libraries, picnic
and camping grounds, educational programs, interpretation activities, hot springs and dog
sledding activities.Sustainability 2021, 13, 1681 7 of 17
Table 2. Summary of the principal component analysis on visitor satisfaction by seasons.
Variable (High-Season) Variable (Off-Season)
Component
n = 291, KMO = 0.533 n = 450, KMO = 0.909,
Natural characteristics and trip maps (21.893%) Natural characteristics (4.963%)
Flora Flora
Fauna Fauna
1 Landscape view Landscape view
Maps
Mean satisfaction: 4.54 Mean satisfaction: 4.20
Infrastructure services (17.096%) Access infrastructure (6.269%)
Roads (towards) Roads (towards)
Roads (inside) Roads (inside)
2 Pavement Pavement
Footpaths Trails
Parking lots
Mean satisfaction: 2.96 Mean satisfaction: 3.97
Tourism service (9.973%) Park services (8.027%)
Shopping mall Parking lots
Network and cell service Washrooms
Personnel knowledge Signs
3 Personnel communication Garbage bins
Kiosks
Souvenir stores
Maps
Mean satisfaction: 3.49 Mean satisfaction: 3.84
Environmental education (8.481%) Park activities (33.243%)
Education program Snow tubing
Interpretation system Hostels
Visitor center Library
Picnic and camping ground
4 Education program
Interpretational activity
Hot springs
Dog sledding and sleigh rides
Mean satisfaction: 4.18 Mean satisfaction: 3.47
Community services (5.256%) Life information services (5.294%)
Library Visitor center
Souvenir stores Restaurants and eateries
5
Shopping mall
Cell service and network
Mean satisfaction: 3.53 Mean satisfaction: 3.77
Accommodation services (4.41%) Skiing (3923%)
Hostel Skiing
6
Camping and picnic ground
Mean satisfaction: 3.60 Mean satisfaction: 4.26
Food services (3.967%)
Kiosks
7 Restaurants and eateries
Mean satisfaction: 3.58
Cleaning facilities (7.043%)
Washrooms
8 Signs
Garbage bins
Mean satisfaction: 3.74
For both seasons, the natural characteristics received high satisfaction scores from
visitors. In summer, visitors were least satisfied with the park infrastructure, with this re-
ceiving significantly lower satisfaction scores compared to other criteria. Visitors generally
more satisfied with visits made during off-season than in high season.
4.2. Comparison of Visitor Expectation and Satisfaction Correlation by Seasons
A correlation analysis was conducted based on the results of the principal components
calculation of visitor satisfaction and expectations. The results of the satisfaction and
expectation correlations are presented in Table 3.Sustainability 2021, 13, 1681 8 of 17
Table 3. Comparison of visitor expectation and satisfaction correlation by seasons.
Satisfaction Park Natural
Park Infrastructure Park Service Park Activity
Expectation Characteristics
High-season (n = 291)
Natural characteristic 0.021 −0.054 0.088 0.163 *
Park infrastructure −0.407 ** −0.310 ** −0.085 −0.265 **
Tourism service −0.394 ** −0.288 ** 0.142 −0.162 *
Environmental education −0.161 * 0.129 0.264 ** 0.307 **
Cleaning facility −0.287 ** −0.192 * 0.098 −0.071
Community service −0.397 ** −0.234 ** 0.133 −0.107
Accommodation service −0.175 * −0.158 * −0.178 * −0.285 **
Food service 0.049 0.054 0.261 ** 0.317 **
Off-season (n = 450)
Ski 0.089 0.239 ** 0.138 ** 0.181 **
Park activity 0.047 0.198 ** 0.118 * 0.171 **
Park service 0.025 0.169 ** 0.091 0.133 **
Access infrastructure 0.053 0.200 ** 0.125 ** 0.154 **
Life information service 0.005 0.127 ** 0.074 0.245 **
Natural characteristic 0.025 0.085 0.073 0.077
Note: * indicates p ≤ 0.05; ** indicates p ≤ 0.01, bold font indicates statistical significance.
The relationships between visitors’ expectations and satisfaction were significantly
different between seasons (Table 3). During the park’s high season, visitor satisfaction was
mostly negatively correlated with their expectations of park amenities, whereas during
the off-season, visitor satisfaction was positively correlated with expectation. In the high
season, visitor satisfaction was generally significantly correlated with expectations of the
park’s infrastructure, facilities, activities and natural characteristics, while during the
off-season, visitor satisfaction was not statistically correlated with the expectations for
park infrastructure.
4.3. Logistic Regression Determinants Comparison between High-Season and Off-Season
A logistic regression analysis was used to investigate the different determinants of
visitor satisfaction between the summer and the winter, and how the same determinants
influenced overall visitor satisfaction in the different seasons. Two models were generated,
one for the high season and one for the off-season (Table 4). The dependent variable
was overall visitor experience, and the independent variables included the components
generated by the PCA, namely visitor satisfaction with the park’s nature, facilities, services
and activities. The independent variables also included visitor gender, age, residency
status, travel group composition, how they first heard about the park, travel motivation,
length of stay and means of transportation.
Model 1, which explained 38% of the overall satisfaction, represents the determinants
during the high season. The satisfaction levels of all criteria had significant impacts
and positively influenced overall visitor satisfaction. None of the data related to visitor
demographics had a statistically significant effect on the overall visitor experience.
Model 2, developed for the off-season, explained 40% of the overall visitor satisfaction
during the off-season. Similar to the first model, overall satisfaction was significantly
affected by the level of visitor satisfaction with park nature, facilities, services and activities.
Residency status had a significant impact on overall visitor experience, with international
visitors tending to have a higher level of overall experience compared to local visitors.
However, the other demographic variables had no impact on overall visitor experience.
Both models indicate that the overall visitor experience was significantly affected by
visitor satisfaction with the four park criteria. The park’s natural characteristics play a
more important role in determining the overall experience in summer compared to winter,
whereas park activities predominate in determining visitors’ overall experience in winter.
Older and female visitors were generally more satisfied with their experience during the
summer in Banff National Park, whereas younger and male visitors tended to have a higher
quality of visit in the winter.Sustainability 2021, 13, 1681 9 of 17
Table 4. Logistic regression model of visitor satisfaction determinants by season.
Standardized
Unstandardized Coefficients t Sig. 95.0% Confidence Interval for B Collinearity Statistics
Coefficients
B Std. Error Beta Lower Bound Upper Bound Tolerance VIF
(Constant) 0.28 0.068 4.132 0.000 0.146 0.413
OSN 0.166 0.01 0.296 17.266 0.000 0.147 0.186 0.785 1.273
OSI 0.213 0.008 0.487 27.155 0.000 0.198 0.229 0.718 1.393
OSS 0.471 0.016 0.569 29.833 0.000 0.44 0.502 0.635 1.575
OSA 0.084 0.013 0.122 6.605 0.000 0.059 0.109 0.672 1.488
Model 1 Gender −0.081 0.077 −0.062 −1.049 0.295 −0.233 0.071 0.974 1.027
High-season Age 0.029 0.044 0.039 0.66 0.51 −0.058 0.116 0.962 1.04
R2 = 0.38 Residency 0.015 0.05 0.018 0.296 0.768 −0.084 0.114 0.922 1.085
Travel group 0.183 0.15 0.078 1.218 0.224 −0.113 0.478 0.844 1.185
Source 0.043 0.033 0.079 1.332 0.184 −0.021 0.108 0.984 1.017
Motivation −0.072 0.056 −0.078 −1.281 0.201 −0.182 0.039 0.923 1.084
Duration 0.038 0.043 0.055 0.884 0.377 −0.047 0.123 0.893 1.119
Transportation −0.048 0.054 −0.055 −0.894 0.372 −0.154 0.058 0.892 1.121
(Constant) 1.142 0.323 3.53 0.000 0.506 1.777
OSN 0.151 0.049 0.131 3.08 0.002 0.055 0.247 0.782 1.278
OSI 0.243 0.042 0.282 5.741 0.000 0.16 0.326 0.584 1.712
OSS 0.136 0.036 0.173 3.754 0.000 0.065 0.207 0.661 1.514
OSA 0.166 0.031 0.229 5.333 0.000 0.105 0.227 0.763 1.31
Model 2 Gender 0.031 0.045 0.027 0.696 0.487 −0.057 0.119 0.968 1.033
Off-season Age −0.002 0.03 −0.003 −0.072 0.943 −0.061 0.057 0.933 1.072
R2 = 0.40 Residency 0.076 0.031 0.124 2.472 0.014 0.016 0.137 0.557 1.795
Travel group 0.067 0.089 0.03 0.753 0.452 −0.108 0.242 0.893 1.119
Source 0.007 0.028 0.01 0.253 0.800 −0.049 0.063 0.864 1.157
Motivation 0.008 0.013 0.022 0.587 0.558 −0.018 0.034 0.959 1.043
Duration 0 0.018 0 −0.01 0.992 −0.035 0.035 0.849 1.177
Transportation −0.053 0.056 −0.047 −0.952 0.342 −0.163 0.057 0.575 1.739
Note: Dependent Variable: Overall Satisfaction. * indicates p ≤ 0.05; ** indicates p ≤ 0.01, bold font indicates statistical significance. OSN:
Overall satisfaction of park natural characteristics; OSI: Overall satisfaction of park infrastructure; OSS Overall satisfaction of park service;
OSA: Overall satisfaction of park activity.
5. Discussion
5.1. Visitor Satisfaction and Its Seasonal Variation
There was a significant seasonal difference in the principal components of visitor satis-
faction and the impact level of each component. In the park’s high season, the satisfaction
with natural characteristics was one of the components explaining the most variance. Dur-
ing the park’s off-season, visitor satisfaction with park activities played the most important
role among the six components. This may be because a major travel motivation in winter is
to participate in winter activities such as skiing and snowboarding. A greater proportion
of the visitors in summer come for sightseeing, and the park’s natural characteristics are
therefore an important factor. Outdoor recreation was one of the important travel motiva-
tions during the park’s off-season, which explains why the quality of park activities was
the most important component in the winter and was less important in the summer.
Visitor satisfaction with park infrastructure and services were important in both
seasons. The quality of park infrastructure is an important factor influencing visitors’
satisfaction, as has been demonstrated in previous studies [57–61]. Among the various
factors in the infrastructure component, parking lots and washrooms were the two most
important determinants. Crilley et al. [62] also found that clean and well-presented toilet
facilities were very important in determining visitor satisfaction. Previous studies [44,63,64]
have demonstrated that service quality is an essential factor influencing visitor satisfaction
in national parks, and is also widely noted as an important factor in determining visitor
loyalty (i.e., revisit motivation). Services are particularly relevant in national parks, unlike
other types of tourist attractions such as theme parks. Natural characteristics and themes
are inherent in national parks and other PAs, and thus, visitor services are the element that
can be modified and improved to increase visitor attachment [65].
Natural characteristics received high satisfaction from visitors while their satisfaction
with park infrastructure and services were lower in both seasons. This is consistent with
previous studies that have found the natural environmental dimensions of a national
park are usually the attribute generating the greatest amount of satisfaction [2,42,62,66].
Although satisfaction levels with natural characteristics, activities, infrastructure and
services were similar between seasons, visitors in the summer tended to have higher
satisfaction levels with natural characteristics and activities and lower satisfaction levels
with park infrastructure and services compared to the park’s off-season. There are at
least two possible reasons for these results. First, according to the socio-demographic
characteristics of visitors (Appendix A), most visitors travelling to Banff National ParkSustainability 2021, 13, 1681 10 of 17
were from nearby cities and provinces, and therefore, the natural characteristics and
activities may have been less refreshing to locals compared to international visitors. During
the high season, the activities provided by the park are more diverse and include more
environmental education and interpretation programs, which are more suitable for all
visitors. For example, Parks Canada provides more guided hiking tours and outdoor
learning activities in summer and this may have increased the satisfaction level of visitors.
Activities available in the off-season are generally designed for younger visitors and are
oriented towards winter sports. A second explanation for the result may be related to
tourism seasonality in Banff. The number of visitors in July 2019 was four times that of
December 2019 in Banff, resulting in crowding of park infrastructure (e.g., parking lots
and washrooms) and services (e.g., visitor centers) in the high season, and thus lower
satisfaction levels with those park attributes. This is supported by the frustration expressed
by visitors over the lack of available parking spots during their trip, especially in the Town
of Banff.
5.2. Visitor Expectation, Satisfaction and Travel Types by Season
Based on the results of the correlation between visitor satisfaction and expectations,
there are significant differences between the park’s high season and off-season. One signifi-
cant seasonal difference is that summer visitor satisfaction is generally negatively correlated
with expectations of the park’s infrastructure and services and positively correlated with
the park’s activities and natural characteristics. All correlation between visitor satisfaction
and expectations with park services, activities and natural characteristics are positive in
winter. There was no significant correlation between visitors’ expectations of infrastructure
and visitor satisfaction during the off-season. This may be related to the greater propor-
tion of international visitors in summer and the greater proportion of locals in winter
(Appendix A). According to previous studies, local visitors generally come with clear
expectations in terms of the quality and variability of infrastructure, services, activities
and natural characteristics that a certain destination provides [67,68]. Parks therefore tend
to have positive or no correlation between visitor expectations and satisfaction for locals.
The resulted presented here are also consistent with a previous study that found that
local tourists’ expectations of a destination are positively correlated with satisfaction with
infrastructure and facilities such as accommodation, whereas for international visitors, the
levels of expectation and satisfaction are positively correlated with a park’s aesthetic views,
food and information [67].
Another significant seasonal variation was the generally negative correlations between
visitor satisfaction and expectations in the high season, and positive correlations in the off-
season. The result indicating a negative correlation in the park’s high season contrasts with
most other research, while the relationship between visitor satisfaction and expectation
in the off-season is consistent with previous literature. Many studies have argued that
there is a direct positive correlation between visitor satisfaction and expectations [41,69–71].
There are several possible reasons for the difference between these previous studies and the
current research. First, visitor expectation here is defined as the anticipation of variables
such as park product or experience [72]. It is widely accepted by most researchers that
a positive correlation occurs when a visitor’s expectation is fulfilled or exceeded [73,74].
However, due to the large numbers of visitors in Banff National Park during the high
season, over-crowding of park infrastructure and services is a serious issue that leads to
visitor dissatisfaction.
The relationship between visitor satisfaction and correlation is controversial. Hui et al. [75]
argued that a positive correlation occurs when a tourism destination’s performance matches
visitor expectations. However, this relationship may break down when the perception level
is below expectations but also different or even higher than expected before the trip. This
also reflects visitors’ socio-demographic characteristics. The expectations held by interna-
tional visitors to Banff are usually based on advertising or recommendations. This can lead
to differences between their perception of park performance and their expectations, whichSustainability 2021, 13, 1681 11 of 17
may the reason for the negative correlation in the park’s high season when international
visitors dominate the population.
The seasonality of visitor satisfaction and expectations could be a result of the different
types of visitors in high season and off-season. The questionnaire results indicate that there
are more sightseeing-type visitors in the high season and more vacation-type visitors in the
off-season. Sightseeing visitors usually have high expectations and requirements for the
park’s attributes and are critical if these are below expectation. The correlation between
visitor satisfaction and expectation is negative in summer when the park performance fails
to meet their expectations. During the park’s off-season, most visitors come to Banff for
vacation purposes, such as spending time with family and participating in winter activities,
purposes and expectations which are easier to satisfy. Such visitors usually have low
expectations of the infrastructure quality or consider it relatively less important but value
the travel experience with their companions.
5.3. The Satisfaction Determinants of Overall and Target Group Visitors and Its Seasonality
Previous studies have demonstrated that visitor satisfaction is a multidimensional
concept that is associated with different aspects of services and products provided by
tourism destinations, and that each of the aspects has different impacts in determining
overall visitor satisfaction [29,76–79]. According to the results of both logistic regression
models that represent visitor satisfaction determinants, overall satisfaction is generally
significantly affected by the same determinants. Based on the models, all dimensions of
satisfaction level (natural characteristics, infrastructure, services and activities) positively
impact overall visitor satisfaction in both the high season and the off-season. Among the
four satisfaction dimensions, park infrastructure and services are the two most important
determinants. Based on the literature review by Matzler and Sauerwein [80], there are
three types of factors determining overall visitor satisfaction, including basic factors,
performance factors and excitement factors. Basic factors are regarded as being guaranteed
by the tourism destination, such as park infrastructure, and do not need to be specific but
determine the minimum requirements and satisfaction threshold for visitors. These factors
can generate a high level of visitor dissatisfaction if they are not fulfilled. Performance
factors can increase visitor satisfaction levels if they successfully meet visitors’ needs
and desires, and excitement factors only increase visitor satisfaction and never cause
dissatisfaction if those factors are not fulfilled. This explains the results found in this study
that park infrastructure and services, as two basic park factors, play the most important
role in determining visitor overall satisfaction in both seasons.
The differences in satisfaction determinants between seasons include the result that
residency status significantly affects overall visitor satisfaction in the park’s off-season,
whereas it does not appear to be a significant determinant during the high season. Previous
research has shown that nationality has an impact on visitor satisfaction [81,82]. For
example, international visitors usually have more international exposure and so their
past travel experiences influence their expectations and experiences, and hence have an
impact on visitor satisfaction. In addition, different cultures have different views on the
quality and novelty of park attributes [67]. According to the results presented here, during
the off-season, international visitors have the highest overall satisfaction, followed by
Canadian visitors and with local visitors having the lowest overall satisfaction. Combined
with the information gained from the interviews, locals generally were dissatisfied with
the reasonableness of costs within Banff, whereas international visitors generally held a
satisfied or neutral attitude towards the reasonableness of prices. This can be explained
knowledge asymmetry: local people usually know the local market price for park products,
and that the price of products sold in Banff National Park is typically 15% higher than the
price in Calgary. This leads to dissatisfaction amongst visitors from Alberta. International
visitors usually come to Banff National Park as a once in a lifetime experience and price is
less important to them. The results also suggest that older visitors tend to have a higher
level of satisfaction in the high season, whereas younger people are more satisfied duringSustainability 2021, 13, 1681 12 of 17
the winter, which may be to differences in the activities undertaken by these two groups.
However, similar to the results from the previous study, visitor age only had a limited
impact on determining their overall satisfaction [83]. In addition, visitor gender, age, travel
group composition, sources of knowledge about the park, travel motivation, duration,
and means of transportation were not significant determinants affecting visitor overall
satisfaction in either season.
5.4. Management Implications for Tourism Seasonality
Tourism seasonality usually has stable and well-established patterns with predictable
elements [84,85]. Park managers can consequently investigate seasonality patterns and
implement different strategies based on seasonal variations in visitor numbers, and can
reduce potential negative impacts [85]. This paper has a number of implications for park
management, and these are described below, also taking into account the results of other
related studies.
Reducing the divergence between visitor expectations and satisfaction is an important
step, especially amongst visitors in the high season. It is important for park managers to
investigate seasonal variations in visitor satisfaction levels and identify the determinants
of visitor satisfaction and the causes of visitor dissatisfaction in different seasons [20]. Chi
and Qu [30] point out that although it is extremely hard to control all the park elements
influencing overall visitor satisfaction, it is still possible to manipulate and manage some
of the important ones. Recognizing the seasonal variations in visitor satisfaction is an
important step, and may provide a simpler way to improve visitor satisfaction levels.
Ensuring the quality of park infrastructure and the variability of park services in the high-
season is would help reduce over-crowding and the subsequent visitor dissatisfaction. [7].
Creating artificially high expectations creates problems, and the use of images and
information that reflect reality ensures that expectations are set at the appropriate level.
Consequently, advertising strategies are important [67,86]. Based on our results on the
seasonal correlation between visitor expectation and satisfaction, we suggest that Banff
National Park should focus on building realistic portraits of the condition of the park’s
infrastructure, services and nature during the high season. It is important to let visitors be
aware of the crowding and over-utilization of park infrastructure such as parking lots and
washrooms in the summer to avoid creating visitor expectations that cannot be satisfied.
For the off-season, because of the positive correlation between visitor expectations and
satisfaction, park managers can use advertising strategies to raise visitor expectations. As
discussed, lower expectations may not lead to higher satisfaction, and there may only
be higher visitor satisfaction when visitors’ expectations and experiences match each
other [67].
Park managers could instigate incentives to reduce the summer peak by encouraging
more visitors at other times of the year. Seasonal pricing with discounts in the off-season
could be one potential strategy [16,87]. It is also important make greater efforts to advertise
the opportunities for international visitors in winter. For example, utilizing the natural
characteristics and advertising snow scenes in Banff could attract more international
visitors, especially from areas that rarely have snow.
6. Conclusions
It is important for park managers to ensure high-quality visitor experiences in both the
high season and the off-season ifseasonality issues are to be addressed. This research fills a
knowledge gap by determining the seasonal variation in visitor satisfaction determinants,
investigating the seasonal correlations between visitor expectations and satisfaction, and
providing management implications to not only reduce the negative impacts of tourism
seasonality, but also utilize the seasonality as an opportunity to prioritize and conduct
different seasonal strategies.
The results indicate that the quality of Banff National Park’s natural characteristics
is the most important visitor satisfaction determinant in the high season, and that parkSustainability 2021, 13, 1681 13 of 17
activities are the most significant component that determines visitor satisfaction level in
the off-season. Park managers could utilize this seasonal difference to prioritize their
management focus by seasons and increase the quality and variability of park activities.
This would be especially important during the off-season when park activities are most
important determinant but receive the lowest satisfaction level. It is important for the park
to continuously provide high-quality services and infrastructure year-round since these
two elements play an important role in determining the level of visitor satisfaction in both
the high season and the off-season. It is also important to reduce the gap between visitor
expectations and satisfaction in the high season.
One limitation of this research should be addressed. The weather in Banff National
Park during the survey in both seasons was not included in the analysis. However,
daily weather can be a potential determinant that causes visitor satisfaction to fluctuate.
For example, the blizzard that occurred in December 2019 significantly reduced visitor
satisfaction with the cell and network services provide by Banff National Park. Further
research is needed on how to account for the impact of weather on the results. Future
studies could also focus on the analysis of the impact of cultural differences on visitor
experience level and determinants.
Author Contributions: Conceptualization, D.C.G., G.W.; Methodology, D.C.G. and W.W. (Weiwei
Wang); Software, D.C.G.; Format Analysis, D.C.G., J.L.I., W.W. (Wanli Wu), W.W. (Weiwei Wang),
G.W.; Writing—Original Data Preparation, D.C.G.; Writing—Review & Editing, D.C.G., J.L.I., W.W.
(Wanli Wu), W.W. (Weiwei Wang), G.W.; Supervision, G.W. All authors have read and agreed to the
published version of the manuscript.
Funding: This research was funded by APFNet (2017SP2-UBC).
Institutional Review Board Statement: The study was conducted according to the guidelines of the
Declaration of Helsinki, and approved by the Institutional Review Board via RISe-UBC (H20-00154).
Informed Consent Statement: Informed consent was obtained from all subjects involved in the study.
Data Availability Statement: Data will be available on request.
Acknowledgments: This research was partially supported by APFNet (2017SP2-UBC) and the
Faculty of Forestry, University of British Columbia. We are also immensely grateful to Darren
Enns (Director, Planning and Development) and Randall McKay (Senior Planner) from Town of
Banff, Benjamin Curry (Geomatics Coordinator) from Parks Canada, Silvio Adamo (Fire Chief and
Director from Banff Fire Department, and Harvey Locke (Co-founder and Strategic Advisor) from
Yellowstone to Yukon Conservation Initiative, who provide their insight and expertise that greatly
assisted the research.
Conflicts of Interest: The authors declare no conflict of interest.
Appendix A
Table A1. Visitor socio-demographic characteristics by seasons in Banff National Park.
Total High-Season Off-Season
(n = 741) (n = 291) (n = 450)
Gender
Male 54.40% 49.50% 57.60%
Female 45.60% 50.50% 42.40%
Age
20 and under 17.30% 8.60% 22.90%
21−40 50.60% 40.50% 57.10%
41−60 21.80% 31.30% 15.80%
61 and over 10.30% 19.60% 4.20%You can also read