Second Quarter 2019 Earnings Call Presentation - August 1, 2019 - California ...
←
→
Page content transcription
If your browser does not render page correctly, please read the page content below

Second Quarter 2019 Earnings Call
         Presentation
          August 1, 2019
Forward-Looking Statements
This presentation contains forward-looking statements within the meaning established by the Private Securities Litigation Reform Act of
1995 ("Act"). The forward-looking statements are intended to qualify under provisions of the federal securities laws for "safe harbor"
treatment established by the Act. Forward-looking statements are based on currently available information, expectations, estimates,
assumptions and projections, and management's judgment.
Words such as would, expects, intends, plans, believes, estimates, assumes, anticipates, projects, predicts, forecasts or variations of such
words or similar expressions are intended to identify forward-looking statements. The forward-looking statements are not guarantees of
future performance. They are subject to uncertainty and changes in circumstances. Actual results may vary materially from what is
contained in a forward-looking statement.
Factors that may cause a result different than expected or anticipated include, but are not limited to: governmental and regulatory
commissions' decisions; changes in regulatory commissions' policies and procedures; the timeliness of regulatory commissions' actions
concerning rate relief; increased risk of inverse condemnation losses as a result of climate conditions; the adequacy of our efforts to
mitigate physical security and cybersecurity risks and threats; changes in tax laws, the interpretation of tax laws, and accounting policies;
changes in construction costs and availability of resources; electric power interruptions, especially as a result of new Public Safety Power
Shutoff programs for the 2019 fire season as we develop approaches to manage that risk; the ability to successfully implement
conservation measures; changes in customer water use patterns; the impact of weather and climate on water sales and operating results;
and, other risks and unforeseen events.
When considering forward-looking statements, you should keep in mind the cautionary statements included in this paragraph, as well as
the annual 10-K, quarterly 10-Q, and other reports filed from time-to-time with the Securities and Exchange Commission (SEC). The
Company assumes no obligation to provide public updates of forward-looking statements.
Today’s Participants

Marty Kropelnicki          Tom Smegal                      Paul Townsley                    Dave Healey
   President & CEO   Vice President, CFO & Treasurer       Vice President, Corporate      Vice President, Controller
                                                       Development and Chief Regulatory
                                                                    Officer
Presentation Overview
•   Our Operating Priorities
•   Financial Results, Second Quarter and YTD
•   Financial Highlights
•   EPS Bridge, Second Quarter and YTD
•   Capital Investment Update
•   2018 California General Rate Case (GRC)
•   Wildfires and Public Safety Power Shutoffs
    (PSPS)
•   Travis Air Force Base (TAFB)
•   Decoupling Balancing Account Update
•   Outlook for Remainder of 2019
•   Cap Ex 2008 Recorded to 2021 Projected
•   Rate Base 2014 Recorded to 2022 Projected
•   Summary
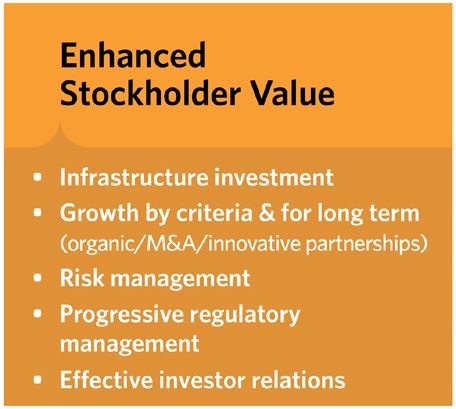
Our Operating Priorities

Financial Results: Second Quarter

  (amounts are in millions, except for EPS)      Q2 2018*                      Q2 2019   Variance

  Operating Revenue                                $174.9                      $179.0     2.3%

  Operating Expenses                               $148.1                      $152.0     2.6%

  Net Interest Expense                               $9.8                       $11.3     14.5%

  Net Income                                        $14.8                       $17.0     14.8%

  EPS                                               $0.31                       $0.35     14.6%

  Capital Investments                               $63.3                       $62.0     -2.1%

*Reflects Q2 2018 results as disclosed in the second quarter 2019 Form 10-Q.

Financial Results: Year-to-Date

  (amounts are in millions, except for EPS)     YTD 2018*                   YTD 2019   Variance

  Operating Revenue                                $309.5                    $305.1     -1.4%

  Operating Expenses                               $272.8                    $277.7     1.8%

  Net Interest Expense                              $18.5                    $21.5      16.0%

  Net Income                                        $14.0                     $9.4     -33.4%

  EPS                                               $0.29                    $0.19     -33.5%

  Capital Investments                              $133.9                    $121.9     -9.0%

*Reflects 2018 results as disclosed in the second quarter 2019 Form 10-Q.
Q2 2019 Financial Highlights
• Net Income increased by $2.2 million to a total of $17 million, largely
  attributable to:
    o   Reduction in business development expenses of $3.4 million
    o   Increase in recognition of equity funds used in construction of $1 million
    o   Rate increases of $5.1 million, offset by operating expense increases which
        included $1.3 million in depreciation expense, $1.1 million wages, and
        increased outside services and property taxes
    o   $1.5 million increase in net interest expense
• Unbilled revenue accrual was $0.2 million higher than in the 2nd
  quarter of 2018
    o   Lack of rebound from 1st quarter was due to continued cooler weather in June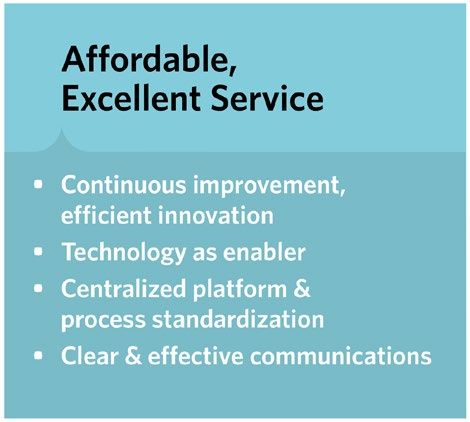
EPS Bridge Q2 2018 to Q2 2019
          $0.50

          $0.45
                                                                   $0.02
          $0.40                                                                - $0.04

                                                   $0.05
          $0.35
                                                                                         - $0.07
          $0.30
                                    $0.08
          $0.25

          $0.20        $0.31                                                                       $0.350

          $0.15

          $0.10

          $0.05

          $0.00

*Reflects Q2 2018 results as disclosed in the second quarter 2019 Form 10-Q.
EPS Bridge YTD 2018 to YTD 2019
           $0.60

           $0.50                                             $0.03

                                                $0.06
           $0.40                                                        - $0.11

           $0.30                                                                  - $0.10
                                    $0.15

           $0.20       $0.29
                                                                                            - $0.13

                                                                                                      $0.19
           $0.10

           $0.00

*Reflects 2018 results as disclosed in the second quarter 2019 Form 10-Q.
Capital Investment Update
• Year to date company and developer-funded capital investments were
$121.9 million, a decrease of 9.0% compared to 2018
o The decrease in utility plant investment is due to weather delays in the first and
second quarters and the impact of the GRC
• 2019 capital spending levels are pending regulatory approvals as part of
the 2018 GRC and we will provide more clarity on targets later in the year
o Projections of cap ex through 2021 shown later in these slides reflect the full
$828.5 million request and timing proposed in the GRC
• In June, the company refinanced $400 million of debt through a private
placement, replacing $300 million of variable-rate securities issued in
2018 and an expiring $100 million 10-year bond issued in 20092018 California General Rate Case
• Cal Water filed its 2018 GRC on July 2, 2018,
requesting $828.5 million in capital investments
over the period 2019-2021
• Three municipalities and the California Public
Advocate (Cal PA) are participating in the case
• Parties have been engaged in settlement
discussions for the last several months
o Two days of evidentiary hearings were held in July, with
more anticipated in early AugustWildfires and Public Safety Power Shutoffs
• Cal Water has been active in addressing wildfire risk in our service area in 2019
o California electric utilities have received permission to implement PSPS which will
likely impact water system reliability
o After the end of the second quarter, we have procured additional generators,
booster pumps, and other equipment to ensure water system reliability during PSPS
o We have been actively working with electric utilities to manage the impact of PSPS
on critical infrastructure
• We are focused on liability legislation, operational training, and emergency system
enhancements
o Broad coalition of water suppliers and cities support legislation limiting liability for
fires not caused by the water provider
o We have completed emergency operations training internally and with many
communities we serveTravis Air Force Base • Cal Water began operations at TAFB on July 1st as a regulated California district • We expect to make $12.5 million of initial improvements within the next two years and approximately $52 million of improvements over the 50-year life of the contract • Under the regulated model, the company will request rates to earn a regulated return on these investments through its GRC
Decoupling Balancing
Account Update
• Cal Water Q2 2019 sales were 83% of
  adopted estimates
• The net WRAM receivable balance is
  $61.3 million, up from $56.1 million at
  year-end 2018
• Change in adopted sales due to
  triggering the Sales Reconciliation
  Mechanism (SRM), which allows for a
  true-up when annual sales are above or
  below adopted sales by more than 5%
• Had the SRM not been in place, lowering
  sales estimates in base rates, the
  WRAM/MCBA balance would have been
  $5.8 million higher at the end of Q2
Net WRAM Receivable Balance
                          (in millions; end-of-year balance)

$80
                                                               $69.1
$70
                                                                               $61.3
$60                                                                    $56.1

$50   $46.1   $46.3   $47.1
                                  $42.0
                                               $39.2
$40

$30

$20

$10

$0
      2012    2013    2014        2015          2016           2017    2018    Q2 2019
Outlook for the Remainder of 2019
• We are hopeful that settlement talks in the GRC will be fruitful. Any
settlement will be made in a noticed public filing.
• We are expanding regional call center efforts to improve customer service
based on the successful launch of our Southern California regional call
center.
• Wildfire response planning is ongoing. We expect to incur equipment lease
costs of $2-3 million plus incremental capital investments for the remainder
of the year which we expect to be recovered in a future period after
regulatory review.
o We are leasing additional equipment in 2019 to be ready for peak fire
season because of long lead times to purchase equipmentCapital Investment History and Projection
(in millions)
$350
$300 $290 $285
CAGR = 10.6% $272 $265
$259
(2008-2018)
$250 $229
$200 $177
$150 $131
$113 $111 $118 $116
$108
$99
$100
YTD
$121.9M
$50
$0
2008 2009 2010 2011 2012 2013 2014 2015 2016 2017 2018 *2019 *2020 *2021
*2019-2021 include capital investments proposed to the California Public Utilities Commission (CPUC) and subject to change based on regulatory outcome
and other factors.Regulated Rate Base of CWT
(in millions)
$2,500
$2,075
$1,890
$2,000
$1,700
$1,399*
$1,500 $1,241
$978 $1,004 $1,058 $1,119
$1,000
$500
$0
2014 2015 2016 2017 2018 Est. 2019 **2020 **2021 **2022
* Includes allowable additions of up to $197 million for advice letter recognition when projects are complete and in service.
**2020-2022 reflect rate base proposed in California GRC plus estimated rate base in other subsidiaries and are subject to change based on the regulatory process.Wrapping Up • Company focus is on the California GRC and supporting settlement efforts with the Office of Public Advocates • Three-pronged approach to wildfire risk (legislation, operational readiness, and infrastructure improvement) • Third year of the current California GRC cycle, with limited rate relief • Extended period of wetter, cooler weather through June did not reverse the effect of the first quarter on unbilled revenue or the WRAM balance
Discussion
You can also read