Second Quarter 2020 conference call - July 30, 2020 - TC Energy
←
→
Page content transcription
If your browser does not render page correctly, please read the page content below

Second Quarter 2020 conference call
July 30, 2020
Forward looking information and non-GAAP measures
This presentation includes certain forward looking information, including future oriented financial information or financial outlook, which is intended to help
current and potential investors understand management’s assessment of our future plans and financial outlook, and our future prospects overall. Statements
that are forward-looking are based on certain assumptions and on what we know and expect today and generally include words like anticipate, expect,
believe, may, will, should, estimate, intend or other similar words.
Forward-looking statements do not guarantee future performance. Actual events and results could be significantly different because of assumptions, risks or
uncertainties related to our business or events that happen after the date of this presentation. Our forward-looking information in this presentation includes
statements related to future dividend and earnings growth and the future growth of our core businesses, among other things.
Our forward looking information is based on certain key assumptions and is subject to risks and uncertainties, including but not limited to: our ability to
successfully implement our strategic priorities and whether they will yield the expected benefits, our ability to implement a capital allocation strategy aligned
with maximizing shareholder value, the operating performance of our pipeline, power and storage assets, amount of capacity sold and rates achieved in our
pipeline businesses, the amount of capacity payments and revenues from our power generation assets due to plant availability, production levels within
supply basins, construction and completion of capital projects, cost and availability of labour, equipment and materials, the availability and market prices of
commodities, access to capital markets on competitive terms, interest, tax and foreign exchange rates, performance and credit risk of our counterparties,
regulatory decisions and outcomes of legal proceedings, including arbitration and insurance claims, our ability to effectively anticipate and assess changes to
government policies and regulations, including those related to the environment and COVID-19, competition in the businesses in which we operate,
unexpected or unusual weather, acts of civil disobedience, cyber security and technological developments, economic conditions in North America as well as
globally, and global health crises, such as pandemics and epidemics, including COVID-19 and the unexpected impacts related thereto. You can read more
about these factors and others in the MD&A in our most recent Quarterly Report and in other reports we have filed with Canadian securities regulators and
the SEC, including the MD&A in our most recent Annual Report.
As actual results could vary significantly from the forward-looking information, you should not put undue reliance on forward-looking information and should
not use future-oriented information or financial outlooks for anything other than their intended purpose. We do not update our forward-looking statements
due to new information or future events, unless we are required to by law.
This presentation contains reference to certain financial measures (non-GAAP measures) that do not have any standardized meaning as prescribed by U.S.
generally accepted accounting principles (GAAP) and therefore may not be comparable to similar measures presented by other entities. These non-GAAP
measures may include Comparable Earnings, Comparable Earnings per Common Share, Comparable Earnings Before Interest, Taxes, Depreciation and
Amortization (Comparable EBITDA), Funds Generated from Operations, and Comparable Funds Generated from Operations. Reconciliations to the most
directly comparable GAAP measures are included in this presentation and in our most recent Quarterly Report to Shareholders filed with Canadian securities
regulators and the SEC and available at www.tcenergy.com.

                                                                                                                                                                    2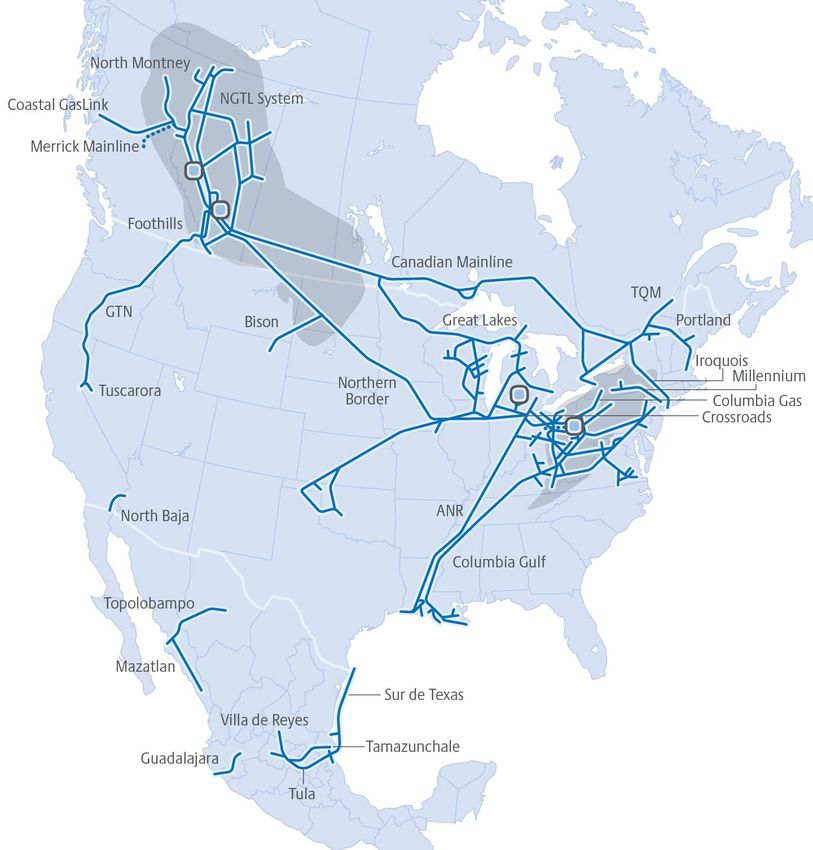
Russ Girling
President & CEO

                   3
Second Quarter 2020 accomplishments
Continued to reliably deliver essential energy services across North America during this unprecedented time
 • Despite the challenges brought about by COVID-19, our assets have been largely unimpacted
 • With few exceptions, flows and utilization levels remain in line with historical and seasonal norms, highlighting the importance
    of our critical energy infrastructure to North American consumers, institutions and commerce
Second quarter financial results
 • Comparable earnings were $0.92 per common share
 • Comparable funds generated from operations totaled $1.5 billion
Advanced $37 billion secured capital program
 • Placed approximately $3.0 billion of growth projects into service in the first half of 2020
Took significant steps to fund our capital program and strengthen our financial position in volatile markets
  • Enhanced liquidity by more than $11 billion through the issuance of long-term debt, incremental committed credit facilities
    and various portfolio management activities
Outlook for full year 2020 is essentially unchanged as a result of low-risk business model
 • Approximately 95 per cent of comparable EBITDA is generated from regulated assets and/or long-term contracts

                               Delivering the energy people need, every day
                            Safely. Responsibly. Collaboratively. With integrity.
                                                                                                                                      4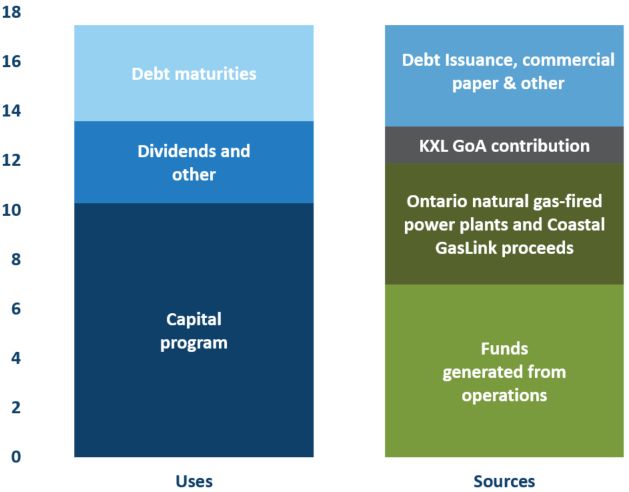
Financial highlights – Three months ended June 30 (Non-GAAP)
                Comparable                                                                                Comparable                                                                Comparable funds
        earnings per common share*                                                                          EBITDA*                                                             generated from operations*
                  (Dollars)                                                                                ($Millions)                                                                  ($Millions)

*Comparable earnings per common share, comparable EBITDA and comparable funds generated from operations are non-GAAP measures. See the forward looking information and non-GAAP measures slide at the front of this presentation for more
information.                                                                                                                                                                                                                                5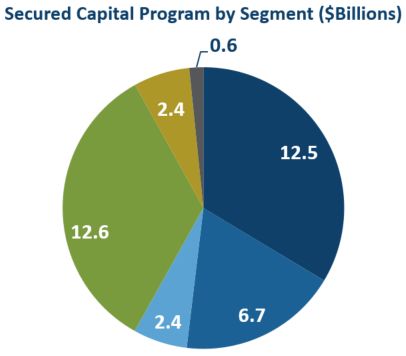
Financial highlights – Six months ended June 30 (Non-GAAP)
                Comparable                                                                                Comparable                                                                Comparable funds
        earnings per common share*                                                                          EBITDA*                                                             generated from operations*
                  (Dollars)                                                                                ($Millions)                                                                  ($Millions)

*Comparable earnings per common share, comparable EBITDA and comparable funds generated from operations are non-GAAP measures. See the forward looking information and non-GAAP measures slide at the front of this presentation for more
information.                                                                                                                                                                                                                                6
Natural Gas Pipelines recent developments
Canadian, U.S. and Mexico Natural Gas Pipelines continue to produce
strong financial results
• Underpinned by regulated and/or long-term contracted assets with
volume throughput across our network largely comparable to last year
Capital program continues to progress. Currently includes:
WCSB
• $9.9 billion of NGTL System expansions
• US$1.8 billion of U.S. Pipelines capacity additions
• US$1.7 billion of Mexico pipeline projects
Elwood Power Project/ANR Horsepower Replacement recently added to
U.S. Pipelines secured project portfolio
• Highlights importance of existing infrastructure
• US$0.4 billion project expected to be completed in 2022 Appalachian
Basin
Columbia Gas to file Section 4 Rate Case in the third quarter
Coastal GasLink Pipeline Project continues to advance
• Construction activities continue on the 2.1 Bcf/d pipeline
• Completed partial monetization for proceeds of $2.1 billion
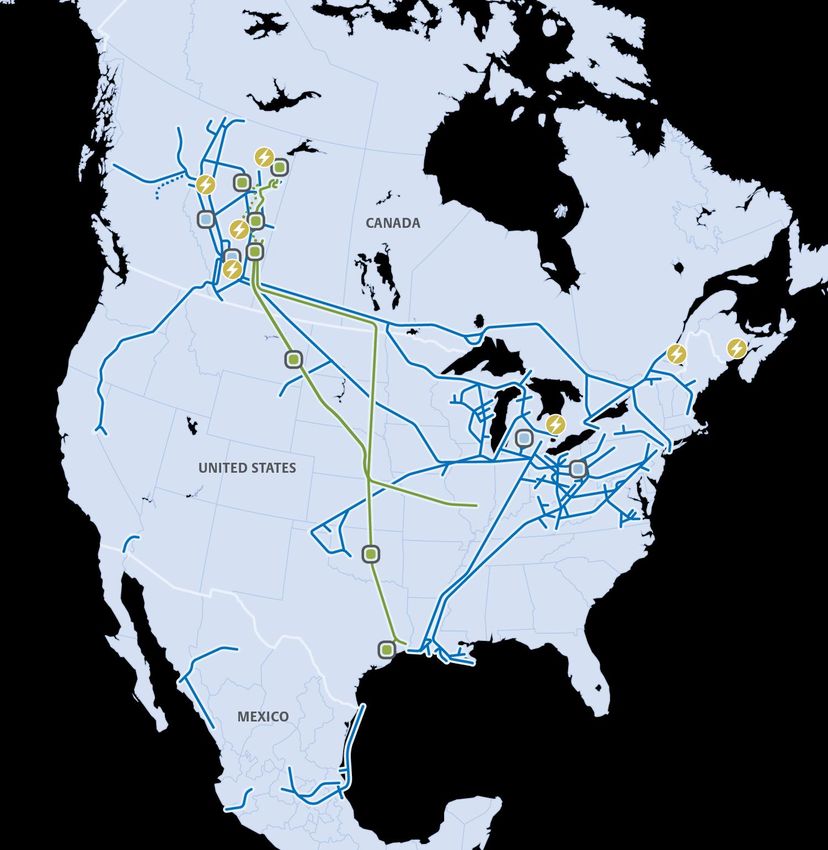
Premier system connects prolific gas supplies
to high growth markets
7Liquids Pipelines recent developments
Liquids Pipelines produced solid results despite lower uncontracted
volumes, a lower contribution from liquids marketing and the partial
monetization of Northern Courier in July 2019
• Keystone System remains largely underpinned by long-term contracts
Keystone XL Pipeline Project
• Announced decision to proceed with construction on March 31 after
reaching an agreement with the Government of Alberta
• Pipeline is underpinned by new 20-year contracts for 575,000 bpd that
are expected to generate incremental EBITDA of ~US$1.3 billion annually
• Construction commenced in April and the pipeline is expected to be
placed into service in 2023 at an additional cost of US$8.0 billion
• Continue to manage various legal and regulatory matters including a
recent ruling by the U.S. District Court in Montana that vacated
Nationwide Permit 12
Provides a contiguous path from supply to market
8Power and Storage recent developments
Bruce Power – Life Extension Program
• Work on the Unit 6 MCR and Asset Management programs
restarted on May 11 following a force majeure event in March
as a result of COVID-19
• Progress being made on critical path activities in preparation
of the removal of the fuel channels in late third quarter
• Impact of force majeure still being evaluated and will depend
on the extent and duration of the pandemic
• Operations and planned outage activities on all other units have
continued as planned
Ontario natural gas-fired power plants sale
• Completed $2.8 billion sale of Halton Hills, Napanee and our
50 per cent interest in the Portlands Energy Centre in April
Long-term
Plant contracted capacity Counterparty Contract expiry
(MW)*
Over 90% of generating capacity Bruce Power Units 1-8 3,109 IESO Up to 2064
underpinned by long-term contracts Bécancour
Alberta plants
550
127
Hydro-Québec
various
2026
2022-2027
Grandview 90 Irving Oil 2024
*Our proportionate share of power generation capacity
9Advancing $37 billion secured capital program through 2023
Estimated Invested to Expected
Project
Capital Cost* Date* In-Service Date*
NGTL System 3.3 3.2 2020
Modernization II US 1.1 US 0.9 2020
Other Liquids Pipelines 0.1 - 2020-2021
NGTL System 3.0 0.5 2021
Villa de Reyes US 0.9 US 0.8 2021
NGTL System 1.3 0.1 2022
Canadian Natural Gas Pipelines Regulated Maintenance 2.0 0.2 2020-2022
U.S. Natural Gas Pipelines Regulated Maintenance US 2.1 US 0.4 2020-2022
Liquids Pipelines Recoverable Maintenance 0.1 - 2020-2022
Non-recoverable Maintenance 0.6 0.1 2020-2022
Coastal GasLink 0.2 0.1 2023
Keystone XL** US 9.1 US 1.4 2023
Other U.S. Natural Gas Pipelines US 1.8 US 0.3 2020-2023
Canadian Mainline 0.4 0.2 2020-2023
Bruce Power Life Extension 2.4 0.9 2020-2023
NGTL System 2.3 - 2023+
Tula US 0.8 US 0.6 -
Foreign exchange impact (1.36 exchange rate) 5.7 1.6 -
Total Canadian Equivalent 37.2 11.3
~$5 billion of projects expected to be completed in 2020
* Billions of dollars. Certain projects are subject to various conditions including corporate and regulatory approvals
** US$5.3 billion will be funded through equity contributions and debt guaranteed by the Government of Alberta
10Dividend growth outlook
5-7%
Expected organic
growth per year
8-10% 2021+
CAGR
3.24*
• $37 billion secured growth program
• Further “in-corridor” expansions
7%
CAGR • $11 billion development portfolio
2.08
• Alberta liquids
• Further Bruce refurbishments
• Growth rate will depend on project mix,
cadence and execution
0.80
• Legacy of opportunistic, strategic,
inorganic growth but never budgeted for
Supported by expected growth in earnings and cash flow and continued strong coverage ratios
*Annual rate based on third quarter dividend declared of $0.81 per share 11Key takeaways
Proven strategy – low risk business model
• ~95% of comparable EBITDA from regulated assets and/or long-term contracts
Visible growth
• Advancing $37 billion of secured growth projects
• $11 billion of projects under development
• Additional organic growth expected from our five operating businesses
Dividend poised to grow
• 8 per cent increase in February, equivalent to $3.24 per common share on an
annualized basis
• Expect annual growth of 8 to 10 per cent in 2021 and 5 to 7 per cent thereafter
Financial strength and flexibility
• Enhanced liquidity by more than $11 billion during the second quarter
• Numerous levers available to fund future growth
Delivered 13% annual total shareholder return since 2000
12Don Marchand
Executive VP, Strategy &
Corporate Development and CFO
13Consolidated results of operations
(millions of dollars, except per share amounts)
Three months Six months
ended June 30 ended June 30
2020 2019 2020 2019
Net Income Attributable to Common Shares 1,281 1,125 2,429 2,129
Specific items (net of tax):
Gain on partial sale of Coastal GasLink (408) - (408) -
Income tax valuation allowance release - - (281) -
Loss on sale of Ontario natural gas-fired power plants 80 - 157 -
Gain on sale of Coolidge generating station - (54) - (54)
Alberta corporate income tax rate reduction - (32) - (32)
U.S. Northeast power marketing contracts - (6) - 6
Risk management activities (90) (109) 75 (138)
Comparable Earnings(1) 863 924 1,972 1,911
Net Income Per Common Share $1.36 $1.21 $2.59 $2.30
Specific items (net of tax):
Gain on partial sale of Coastal GasLink (0.43) - (0.43) -
Income tax valuation allowance release - - (0.30) -
Loss on sale of Ontario natural gas-fired power plants 0.09 - 0.17 -
Gain on sale of Coolidge generating station - (0.06) - (0.06)
Alberta corporate income tax rate reduction - (0.03) - (0.03)
U.S. Northeast power marketing contracts - (0.01) - 0.01
Risk management activities (0.10) (0.11) 0.07 (0.15)
Comparable Earnings Per Common Share(1) $0.92 $1.00 $2.10 $2.07
Weighted Average Basic Common Shares Outstanding (millions) 940 927 940 924
(1) Non-GAAP measure and excludes specific items. See the forward looking information and non-GAAP measures slide at the front of this presentation for more information. 14Business segment results(1)
(millions of dollars)
Three months Six months
ended June 30 ended June 30
2020 2019 2020 2019
Comparable EBITDA(2)
Canadian Natural Gas Pipelines 621 528 1,218 1,084
U.S. Natural Gas Pipelines 824 857 1,856 1,829
Mexico Natural Gas Pipelines 181 141 450 287
Liquids Pipelines 432 582 877 1,145
Power and Storage 135 219 329 370
Corporate 6 (3) 4 (8)
Total 2,199 2,324 4,734 4,707
Second quarter 2020 Comparable EBITDA decreased by $125 million compared to the same period in 2019. Principal variances included:
• Canadian Natural Gas Pipelines – Higher primarily due to increased rate base earnings and flow-through depreciation and financial charges on the NGTL
System from additional facilities placed in service
• U.S. Natural Gas Pipelines – Lower primarily due to the sale of certain Columbia midstream assets in August 2019
• Mexico Natural Gas Pipelines – Higher mainly due to increased earnings from our investment in the Sur de Texas pipeline which was placed into
service in September 2019
• Liquids Pipelines – Lower due to reduced uncontracted volumes on the Keystone Pipeline System, lower contributions from liquids marketing activities
and decreased earnings following the July 2019 sale of an 85 per cent equity interest in Northern Courier
• Power and Storage – Lower mainly due to the planned removal from service of Unit 6 on January 17, 2020 under the Bruce Power Major Component
Replacement program as well as lower Canadian Power earnings largely as a result of the sales of our Ontario natural gas-fired power plants on April 29,
2020 and the Coolidge generating station in May 2019, along with an outage at our Mackay River cogeneration facility in 2020
(1) For more information see our Second Quarter 2020 Quarterly Report to Shareholders; (2) Non-GAAP measure and excludes specific items. See the forward looking information and non-GAAP measures slide at the front of this presentation for more
information.
15Other income statement items(1)
(millions of dollars)
Three months Six months
ended June 30 ended June 30
2020 2019 2020 2019
Comparable EBITDA(2) 2,199 2,324 4,734 4,707
Depreciation and amortization (635) (621) (1,265) (1,229)
Comparable EBIT(2) 1,564 1,703 3,469 3,478
Interest expense (561) (588) (1,139) (1,174)
Allowance for funds used during construction 81 99 163 238
Interest income and other included in comparable earnings(3) 7 7 55 36
Income tax expense included in comparable earnings(3) (125) (199) (336) (427)
Net income attributable to non-controlling interests (63) (57) (159) (158)
Preferred share dividends (40) (41) (81) (82)
Comparable Earnings(2) 863 924 1,972 1,911
Principal variances between second quarter 2020 and the same period in 2019 included:
• Depreciation and amortization – Higher depreciation largely in Canadian Natural Gas Pipelines reflecting new projects placed in service which is fully
recovered on a flow-through basis
• Interest expense – Lower due to higher capitalized interest mainly related to Keystone XL and Coastal GasLink, as well as reduced interest rates on
lower levels of short-term borrowings, partially offset by the effect of long-term debt issuances net of maturities
• AFUDC – Lower predominantly due to NGTL System expansion projects placed in service and the suspension of recording AFUDC on the Tula project
due to continuing construction delays
• Income tax expense(3) – Lower mainly due to reduced pre-tax earnings and a lower Alberta income tax rate
(1) For more information see our Second Quarter 2020 Quarterly Report to Shareholders; (2) Non-GAAP measures and excludes specific items. See the forward looking information and non-GAAP measures slide at the front of this presentation for more
information; (3) Excludes specific items to arrive at comparable earnings. 16Funding program continued to advance
Resilient and predictable cash flow generated from operations
• Comparable funds generated from operations of $1.5 billion in the second quarter
Accessed capital markets on compelling terms in the second quarter
• Issued $2.0 billion of seven-year medium term notes at a rate of 3.80 per cent
• Placed US$1.25 billion of 10-year senior unsecured notes at a rate of 4.10 per cent
Further enhanced liquidity through establishment of incremental committed credit lines
• US$2.0 billion of committed credit facilities added in April bringing total to in excess of $13 billion
Progressed various portfolio management and project-financing activities
• Disposition of Ontario natural gas-fired power plants in April for proceeds of $2.8 billion
• Partial sale and project financing of Coastal GasLink in May for combined proceeds of $2.1 billion
• Government of Alberta support for Keystone XL secured in form of US$1.1 billion equity contribution and
US$4.2 billion loan guarantee
Liquidity materially bolstered amidst disrupted market conditions
Substantial portion of Coastal GasLink and Keystone XL funding in place
172020 Funding program
$Billions
~$7 billion of expected funds generated from operations
• ~95% of comparable EBITDA from regulated assets and/or
long-term contracts
$10+ billion sourced through an array of attractive funding levers
• $2.0 billion of medium term notes and US$1.25 of senior
unsecured notes placed in Canadian and U.S. markets, respectively
• $2.8 billion realized from the sale of Ontario natural gas-fired
power plants
• $2.1 billion received upon closing of the Coastal GasLink joint
venture and project financing transactions
• US$1.1 billion equity contribution from the Government of Alberta
underpins 2020 Keystone XL construction
Incremental US$2.0 billion of committed credit lines established
bringing total credit facilities to in excess of $13 billion
2020 requirements fully funded
18Delivering long-term shareholder value
Track Visible Attractive, growing Strong
record growth dividend financial position
13% average $37 billion secured Dividend raised 8% in Numerous levers
annual total through 2023 February 2020 available to fund
shareholder return 5.4% yield future growth
Advancing
since 2000 $11 billion of 8-10% expected in Simple,
2021 and 5-7% understandable
additional projects in
thereafter corporate structure
development
Proven resilience through all points of the business cycle
19Question & answer period
20Second Quarter 2020 conference call July 30, 2020
Appendix – Reconciliation of non-GAAP measures
   (millions of dollars)
                                                                                                                                   Three months                 Six months
                                                                                                                                   ended June 30               ended June 30
                                                                                                                                    2020      2019              2020      2019

                                Comparable EBITDA(1)                                                                                2,199            2,324      4,734      4,707
                                 Depreciation and amortization                                                                       (635)            (621)    (1,265)    (1,229)
                                 Interest expense                                                                                    (561)            (588)    (1,139)    (1,174)
                                 Allowance for funds used during construction                                                          81               99        163        238
                                 Interest income and other included in comparable earnings                                              7                7          55        36
                                 Income tax expense included in comparable earnings                                                  (125)            (199)      (336)      (427)
                                 Net income attributable to non-controlling interests                                                 (63)             (57)      (159)      (158)
                                 Preferred share dividends                                                                            (40)             (41)        (81)      (82)
                                Comparable Earnings(1)                                                                                863              924      1,972      1,911
                                Specific items (net of tax):
                                 Gain on partial sale of Coastal GasLink                                                              408                -       408           -
                                 Income tax valuation allowance release                                                                 -                -       281           -
                                 Loss on sale of Ontario natural gas-fired power plants                                               (80)               -      (157)          -
                                 Gain on sale of Coolidge generating station                                                             -              54         -         54
                                 Alberta corporate income tax rate reduction                                                             -              32         -         32
                                 U.S. Northeast power marketing contracts                                                                -               6         -         (6)
                                 Risk management activities                                                                            90              109       (75)       138
                                Net Income Attributable to Common Shares                                                            1,281            1,125     2,429      2,129

(1) Comparable EBITDA and comparable earnings are non-GAAP measures. See the non-GAAP measures slide at the front of this presentation for more information.                        22
Appendix – Reconciliation of non-GAAP measures continued
(millions of dollars)
Three months Six months
ended June 30 ended June 30
2020 2019 2020 2019
Net Cash Provided by Operations 1,613 1,722 3,336 3,671
(Decrease)/increase in operating working capital (64) (47) 307 (189)
Funds Generated from Operations(1) 1,549 1,675 3,643 3,482
Specific item:
U.S. Northeast power marketing contracts - (8) - 8
Comparable Funds Generated from Operations(1) 1,549 1,667 3,643 3,490
(1) Funds generated from operations and comparable funds generated from operations are non-GAAP measures. See the non-GAAP measures slide at the front of this presentation for more information. 23You can also read