Second Quarter 2021 Earnings Presentation - Oslo, July 22, 2021
←
→
Page content transcription
If your browser does not render page correctly, please read the page content below

Second Quarter 2021 Earnings Presentation
Oslo, July 22, 2021

Cautionary Statement

     ▪ This presentation contains forward looking information

     ▪ Forward looking information is based on management
       assumptions and analyses

     ▪ Actual experience may differ, and those differences may be material

     ▪ Forward looking information is subject to significant uncertainties
       and risks as they relate to events and/or circumstances in the future

     ▪ This presentation must be read in conjunction with the Q2 2021 Earnings
       Release and the disclosures therein

                                                                                 -2-
Q2 2021 Takeaways:
Leveraging the Integrated Business Model

                                           ▪ Well positioned in a recovering market

                                           ▪ Strong MultiClient sales from mature regions
                                              –   Largest MultiClient player 5 quarters in a row
                                              –   Late sales of $65.5 million
                                              –   Good client commitment for new projects

                                           ▪ Increasing demand for new acquisition
                                             surveys

                                           ▪ Positive order book development

                                           ▪ Expect higher 2021 Segment revenues vs.
                                             2020

                                           ▪ PGS celebrates 30 years – proud of the past,
                                             excited about the future
                                                                                                   -3-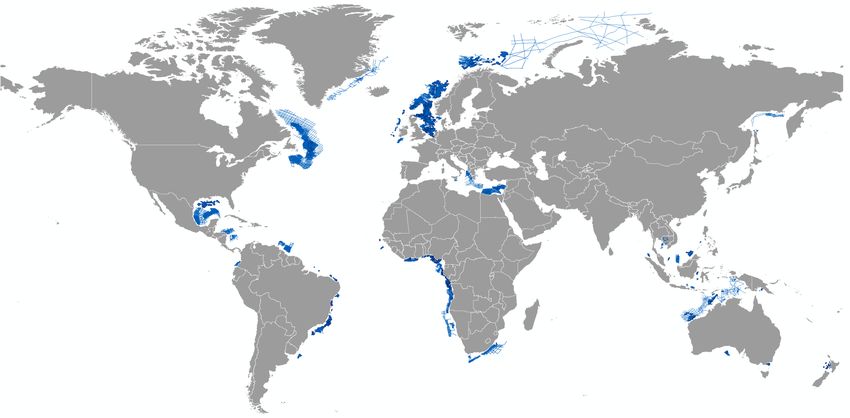
Financial Summary
Segment Revenues and Other Income Segment EBITDA*
194
300 288 200
160
234
216 150 135
130
USD million
USD million
200
168 173
152 99
142 139 100 88
132 81 84 84
116
67
100
50
0 0
100
Segment EBIT** 200 Cash Flow from Operations
176
80
70
152
60 150
119
USD million
40 38 108
USD million
95
20 100 89
81
20 18
68 66
7 1 57
0 50
-4
-20 -14
-16
-29 0
-40
*EBITDA, when used by the Company, means EBIT excluding Other charges, impairment and loss/gain on sale of long-term assets and depreciation and amortization as defined in Note 14 of the Q2 2021 earnings release published on July 22, 2021
**Excluding impairments and Other charges. -4-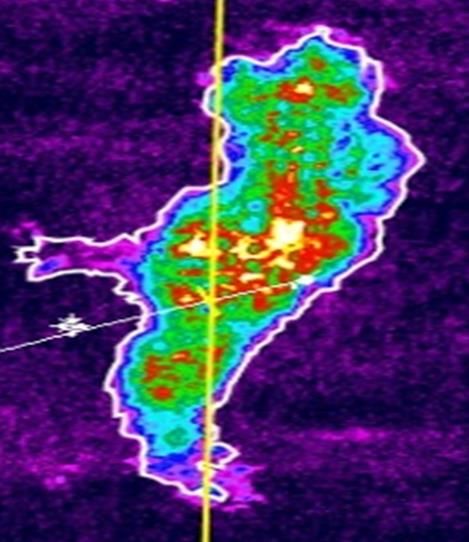
Increasing Order Book

              300

                        ▪ Order book of $255 million on June 30,
                          2021
              200          – $57 million relating to MultiClient
USD million

                        ▪ Vessel booking*
              100
                           – Q3 21: 17 vessel months
                           – Q4 21: 8 vessel months
                           – Q1 22: 3 vessel months

                0

*As of July 14, 2021.
                                                                   -5-
Financials
          Unaudited Second Quarter 2021 Results

This presentation must be read in conjunction with the Q2 2021 Earnings Release and the disclosures therein.
Consolidated Key Financial Figures
                                                                                                                 Q2                   Q2                       1H                    1H           Full year
              (In millions of US dollars, except per share data)                                                2021                 2020                     2021                  2020            2020
              Profit and loss numbers Segment Reporting
              Segment revenues and Other Income                                                                       151.8                 138.7                   284.0                307.0           595.9
              Segment EBITDA                                                                                           84.4                  99.1                   168.5                179.7           397.7
              Segment EBIT ex. Impairment and other charges, net                                                       (4.2)                 7.0                    (18.2)                (8.8)          12.2

              Profit and loss numbers As Reported
              Revenues and Other Income                                                                               185.9                  90.3                   351.7                 219.1          512.0
              EBIT                                                                                                     (7.3)               (82.2)                    (9.7)              (162.3)        (188.0)
              Net financial items                                                                                     (16.2)               (27.7)                   (49.8)               (62.8)        (118.4)
              Income (loss) before income tax expense                                                                (23.5)               (109.9)                   (59.5)              (225.1)        (306.4)
              Income tax expense                                                                                      (2.5)                 (1.5)                    (5.7)                (3.7)         (15.1)
              Net income (loss) to equity holders                                                                    (26.0)               (111.4)                   (65.2)              (228.8)        (321.5)
              Basic earnings per share ($ per share)                                                                ($0.07)               ($0.29)                  ($0.17)              ($0.60)        ($0.85)

              Other key numbers
              Net cash provided by operating activities                                                                 81.4                 67.5                    170.0               243.4           366.5
              Cash Investment in MultiClient library                                                                    25.7                 64.7                     69.0               132.4           222.3
              Capital expenditures (whether paid or not)                                                                11.3                  4.0                     17.5                16.3            36.1
              Total assets                                                                                          1,946.2              2,207.8                  1,946.2               2,207.8        2,093.8
              Cash and cash equivalents                                                                               155.4                234.9                    155.4                 234.9          156.7
              Net interest bearing debt                                                                               954.5                890.3                    954.5                 890.3          937.6
              Net interest bearing debt, including lease liabilities following IFRS 16                              1,093.6              1,059.1                  1,093.6               1,059.1        1,096.2
       ▪    Net financial items in Q2 2021 includes a $5.7 million gain on revaluation of the separate derivative financial instrument relating to the convertible bond
       ▪    Note also that the gross interest expense (in net financial items) includes a significant noncash component. In Q2 2021, gross interest expense was $25.3 million compared to cash interest of
            $20.1 million
The accompanying unaudited financial information has been prepared under IFRS. This information should be read in conjunction with the Q2 2021 Earnings Release issued July 22, 2021.                            -7-
Q2 2021 Operational Highlights
Contract revenues Segment MultiClient revenues
120.0 100% 200 200%
104 90%
100.0 94
80%
85 150 150%
76 70%
80.0
USD million
USD million
60% 54 113
60.0 52 50% 100 100%
70
44 46
40% 36
40.0 49
31 30% 61 28 66
26 34
21 50 95 50%
20%
20.0 67 65 66 61
9 50 46
10% 41
30 29
0.0 0% 0 0%
Q1 19 Q2 19 Q3 19 Q4 19 Q1 20 Q2 20 Q3 20 Q4 20 Q1 21 Q1 19 Q2 19 Q3 19 Q4 19 Q1 20 Q2 20 Q3 20 Q4 20 Q1 21 Q2 21
Contract revenues % active 3D capacity allocated to contract MultiClient pre-funding MultiClient late sales Pre-funding as % of MC cash investments
Targeted pre-funding level 80-120%
▪ Contract revenues of $51.5 million ▪ Total Segment MultiClient revenues of $94.1
– 69% of active time used for Contract acquisition million
– Pre-funding level of 111%
– Late sales of $65.5 million
-8-Pre-funding and Late Sales Revenues Combined:
Segment MultiClient Revenues by Region
200
175
▪ North America was the main
150
contributor to pre-funding
125 revenues in Q2 2021
USD million
100
▪ Europe was the main
75
contributor to late sales in Q2
50 2021
25
0
Q1 19 Q2 19 Q3 19 Q4 19 Q1 20 Q2 20 Q3 20 Q4 20 Q1 21 Q2 21
Europe Africa Middle East N. America S. America Asia Pacific
9Seismic Streamer 3D Fleet Activity in Streamer Months:
Vessel Allocation* and Utilization
Quarterly vessel allocation
100%
▪ 68% active vessel time in Q2 2021
80%
– Six active 3D vessels
– Ramform Sovereign operated as
60%
source vessel on a contract project
half of Q2
40%
▪ Planned Q3 vessel allocation
20%
– Overweight of contract work
– Vessel relocations
0%
Q1 19 Q2 19 Q3 19 Q4 19 Q1 20 Q2 20 Q3 20 Q4 20 Q1 21 Q2 21
Contract MultiClient Steaming Yard Stacked/Standby
* The vessel allocation excludes cold-stacked vessels.
-10-Cost* Focus Delivers Results
Gross cash cost* ▪ Sequential cost increase driven by
148
154 154 more operated vessel capacity
150
142
136
▪ Cost will increase in Q3 due to
higher project activity
110
USD million
102
100
92 ▪ Full year gross cash cost estimate
82 80 increased to ~$425 million
– Increased activity level
– Node acquisition and use of Sanco
50 Swift on a combined node and
streamer project
– Ramform Vanguard extended through
most of Q4
– Higher fuel prices
-
Q1 19 Q2 19 Q3 19 Q4 19 Q1 20 Q2 20 Q3 20 Q4 20 Q1 21 Q2 21
Cost of Sales Research and development costs Selling, general and administrative costs
*Gross cash cost are defined as the sum of reported net operating expenses (excluding depreciation, amortization, impairments, deferred steaming and Other charges) and the cash operating costs capitalized as investments in the MultiClient library as
well as capitalized development costs. -11-Balance Sheet Key Numbers As Reported
June 30 June 30 December 31
In millions of US dollars 2021 2020 2020
Total assets 1,946.2 2,207.8 2,093.8
MultiClient Library 512.2 647.8 616.1
Shareholders' equity 358.0 473.7 396.4
Cash and cash equivalents (unrestricted) 155.4 234.9 156.7
Restricted cash 72.5 45.7 76.6
Gross interest bearing debt 1,182.4 1,170.9 1,170.9
Gross interest bearing debt, including lease liabilities following IFRS 16 1,321.5 1,339.7 1,329.5
Net interest bearing debt 954.5 890.3 937.6
Net interest bearing debt, including lease liabilities following IFRS 16 1,093.6 1,059.1 1,096.2
▪ Cash and cash equivalents (unrestricted) of $155.4 million
▪ MultiClient library of $512.2 million based on IFRS and $504.8 million according to Segment Reporting
The accompanying unaudited financial information has been prepared under IFRS. This information should be read in conjunction with the Q2 2021 Earnings Release published July 22, 2021. -12-Consolidated Statements of Cash Flows Summary
Q2 Q2 YTD YTD Full year
In millions of US dollars 2021 2020 2021 2020 2020
Cash provided by operating activities 81.4 67.5 172.2 243.4 366.5
Investment in MultiClient library (25.7) (64.7) (69.0) (132.3) (222.1)
Capital expenditures (9.8) (13.1) (18.1) (23.5) (32.8)
Other investing activities (3.0) 22.7 (5.2) 20.3 0.3
Net cash flow before financing activities 42.9 12.4 79.9 107.9 111.9
Proceeds, net of deferred loan costs, from issuance of non-current debt/net cash payment for debt amendment* (0.8) - (19.2) 124.2 124.2
Interest paid on interest bearing debt (20.1) (17.0) (40.0) (32.6) (73.7)
Repayment of interest bearing debt - (14.0) - (240.3) (240.3)
Net change drawing on RCF - - - 170.0 170.0
Proceeds from share issue - - - 91.9 91.9
Payment of lease liabilities (recognized under IFRS 16) (10.0) (10.7) (19.5) (21.2) (43.1)
Payments of leases classified as interest (2.3) (2.7) (4.7) (5.7) (10.7)
Decrease (increase) in non-current restricted cash related to debt service 1.8 - 2.2 - (14.1)
Net increase (decr.) in cash and cash equiv. 11.5 (32.0) (1.3) 194.2 116.1
Cash and cash equiv. at beginning of period 143.9 266.9 156.7 40.6 40.6
Cash and cash equiv. at end of period 155.4 234.9 155.4 234.9 156.7
▪ Positive free cash flow in Q2
▪ Working capital/collections at end Q2 2021 still impacted by delay of block ratification formalities (~$20
million) which are solved early Q3
The accompanying unaudited financial information has been prepared under IFRS. This information should be read in conjunction with the Q2 2021 Earnings Release issued July 22, 2021. -13-Operational Update and Market Outlook
Unaudited Second Quarter 2021 Results
This presentation must be read in conjunction with the Q2 2021 Earnings Release and the disclosures therein.Fleet Activity July 2021
Ramform Hyperion
(Barents Sea)
Ramform Sovereign
(Norwegian Sea)
Ramform Vanguard
Ramform Atlas (North Sea)
Ramform Titan
(Canada)
Ramform Tethys
(Angola)Increasing Contract Bids and Leads
2500
2000
▪ Contract bids and sales leads
1500
approaching pre Covid-19 levels
USD million
– Expect healthy bidding activity in 2H
1000
▪ The first 2022 North Sea bids already in
500
the market
0
Active Tenders Marine Contract* All Sales Leads Marine Contract (Including Active Tenders)*
*Contract bids to go (in-house PGS) and estimated $ value of bids + risk weighted leads as of Mid July 2021
16Historically Low Supply
Number of
streamers
700
600
500
▪ Moderate capacity increase for 2021
summer season
400
▪ Do not expect any significant capacity
300
increases for the winter season
200
100
0
Q1 13 Q1 14 Q1 15 Q1 16 Q1 17 Q1 18 Q1 19 Q1 20 Q1 21
Source: PGS internal estimates
17PGS New Energy – CCUS Spotlight
Identification, Global carbon storage capacity
needs surging (tonnes p.a.) ▪ Existing data library
characterization and
monitoring of carbon storage >5B
sites
▪ Operational excellence
170M ▪ New solutions
Data courtesy
Equinor
40M
2020 2025 2050
Complex geophysical challenge Significant market opportunity Building on core PGS capabilitiesAnnouncements of Contract Awards and MultiClient Projects
Stock exchange releases:
▪ Contract awards with an estimated value in excess
of $10-15 million
▪ Strategically important contracts
▪ MultiClient projects with duration of two months or
more
▪ MultiClient projects in joint ventures or in
cooperation with third parties
192021 Guidance
▪ Group gross cash cost of ~$425 million
▪ MultiClient cash investments of ~$150 million
– ~45% of 2021 active 3D vessel time allocated to MultiClient
▪ Capital expenditures of ~$40 million
-20-Summary
▪ Well positioned in a recovering market
▪ Strong MultiClient sales in mature regions
▪ Increasing order book
▪ Contract bids and sales leads approaching pre
Covid-19 levels
▪ Expect higher Segment revenues in 2021 vs.
2020
21Questions? COPYRIGHT The presentation, including all text, data, photographs, drawings and images (the "Content") belongs to PGS ASA, and/or its subsidiaries (“PGS”) and may be protected by Norwegian, U.S., and international copyright, trademark, intellectual property and other laws. Accordingly, neither the whole nor any part of this document shall be reproduced in any form nor used in any manner without express prior written permission by PGS and applicable acknowledgements. In the event of authorized reproduction, no trademark, copyright or other notice shall be altered or removed. © 2021 PGS ASA. All Rights Reserved. This presentation must be read in conjunction with the Q2 2021 Earnings Release and the disclosures therein.
You can also read