Section IV Ocean Hazards and Disasters - IIT Delhi
←
→
Page content transcription
If your browser does not render page correctly, please read the page content below
Section IV Ocean Hazards and Disasters
17
Tropical Cyclone–Induced Storm Surges and Wind Waves
in the Bay of Bengal
Prasad K. Bhaskaran1, A. D. Rao2, and Tad Murty3
ABSTRACT
The Bay of Bengal and the Gulf of Mexico are the two water bodies on the globe that are most prone to storm
surges generated by tropical cyclones. In this chapter, a review has been made of the storm surge problem in the
Bay of Bengal region located in the North Indian Ocean. Using the contemporary numerical models, not only
storm surge elevations but also coastal inundations were computed for some recent cyclones in the Bay of Bengal.
These models included the interactions between storm surges, tides, and wind waves. However, it should be noted
that one of the challenging issues, which still remains unsolved to a large extent, is computing the interaction
between storm surges and river flooding, and the contribution of this interaction to coastal flooding and inun-
dation. A dramatic example of such an interaction was during the 29 October 1999 cyclone on the Odisha coast.
17.1. I NTRODUCTION setup/setdown. The worst possible scenario of extreme
water level can occur when the storm surge coincides with
Storm surge and wind waves are the manifestation of the astronomical high water. In the hinterland regions,
surface winds blowing over the ocean surface, and turn the major damage and devastation can result from
out quite detrimental in coastal areas during tropical extreme wind speed and coastal and inland floods due to
cyclone activity. Tropical cyclones form over the warm torrential rainfall.
ocean surface and are widely recognized as being among About 80 tropical cyclones form over the global ocean
the natural geohazards that can result in enormous loss basins annually, and about 5–6% of this total number
of life, property, and damage to infrastructure during form over the North Indian Ocean basin (Niyas et al.,
landfall and the postlandfall phase. During the landfall 2009). The east coast of India that borders the Bay of
of a tropical cyclone, the worst affected areas are the low‐ Bengal is considered the most vulnerable and susceptible
lying coastal regions that directly bear the brunt resulting region in the world in the context of risk associated with
from abnormal rise in water levels due to extreme winds, tropical cyclones and extreme wind waves. The frequency
storm surge, and wind‐wave activity. The total water of cyclones is much higher in the Bay of Bengal as com-
level elevation near the coast is a combined effect pared with the Arabian Sea with a return period of about
resulting from the mutual nonlinear interaction between 4–5 in a year with landfall either in West Bengal, Odisha,
storm surges, astronomical tide, and wave‐induced Andhra Pradesh, or Tamil Nadu. Analysis of historical
cyclone tracks clearly indicate that the State of Odisha
1
Department of Ocean Engineering and Naval Architecture, located on the east coast of India receives the highest fre-
Indian Institute of Technology Kharagpur, West Bengal, India quency of tropical cyclone landfall followed by Andhra
2
Centre for Atmospheric Sciences, Indian Institute of Pradesh, West Bengal, and Tamil Nadu. A recent study
Technology Delhi, New Delhi, India on the assessment of historical cyclone tracks for four
3
Department of Civil Engineering, University of Ottawa, decades in the Bay of Bengal clearly indicates a rising
Ottawa, Ontario, Canada trend in the energy metrics such as Power Dissipation
Techniques for Disaster Risk Management and Mitigation, First Edition. Edited by Prashant K. Srivastava,
Sudhir Kumar Singh, U. C. Mohanty, and Tad Murty.
© 2020 John Wiley & Sons, Inc. Published 2020 by John Wiley & Sons, Inc.
239
240 TECHNIQUES FOR DISASTER RISK MANAGEMENT AND MITIGATION Index (PDI) and the Accumulated Cyclone Energy (ACE) of wave‐induced setup/setdown from extreme wind waves for tropical cyclones that form over the Bay of Bengal in the total water level elevation. Also, at present there is region (Sahoo & Bhaskaran, 2015). The estimated PDI a growing necessity and pressing demand to improve the for tropical cyclones in the present decade is about six quality of numerical forecasts for the atmosphere and times higher as compared with the past over the Bay of ocean due to high population density and rapid growth Bengal basin, and that has direct implications on coastal of urbanization, industrialization, and infrastructure vulnerability associated with storm surges and extreme development activities, which are progressing quite rap- wind waves over this region. Another recent study on idly along the coastal belt. In the era of information tech- coastal hydrodynamics using a coupled model for cyclone nology and advancements in computational power, it is a Hudhud in the Bay of Bengal (Murty et al., 2016) clearly need of the hour that demands accurate and reliable indicates that the size of tropical cyclones that formed information on storm surges and extreme wind waves for over this region has also increased during the present appropriate action and timely warnings to the coastal decade. Therefore in a changing climate the occurrence of community. Hence, due to the complexity involved as high‐intensity tropical cyclones along with their increase well the beneficial aspects in terms of socioeconomic in size has a direct implication on the vulnerability of implications, a detailed study is warranted along coastal coastal belts. It means that vast expanses of coastal areas of the Indian coast and that requires substantial regions are exposed to higher wind speeds, storm surge strenuous research effort. Along with the recent envelopes, differential coastal flooding scenarios, and development and advancements in high performance impact from extreme wind waves. In their study, Murty computing (HPC) systems, it has now become possible to et al. 2016 indicate that the existing parametric wind field simulate very high‐resolution models for storm surges formulation needs to be revisited and modified accord- and wind waves with a reasonably high degree of accu- ingly considering the overall radial distance in wind field racy. The importance of HPC systems in atmosphere and envelope keeping in view the increased size of tropical ocean modeling studies in terms of rapid computation is cyclones over the Bay of Bengal region. A 3/5 power‐law widely recognized in operational weather centers thereby was proposed (Murty et al., 2016) that takes care of the aiding timely warnings and advisories during tropical increased tropical cyclone size over this region. Despite cyclone events. the fact that the east coast of India is highly vulnerable to In this context, some of the recent developments in the impacts from tropical cyclone landfall, there is a numerical modeling include the implementation of state‐ growing concern and urgent demand among the scientific of‐art hydrodynamic models such as the Advanced community at present to conduct a systematic and more Circulation Model (ADCIRC) and Simulating Waves focused study to address aspects of coastal vulnerability Nearshore (SWAN), and atmospheric models like in a holistic view by considering the contributions from Weather Research and Forecasting (WRF) in operational various environmental drivers leading to an overall centers to obtain realistic estimates of storm surges and assessment of risk and coastal vulnerability. Such extreme wind waves for the affected regions during the studies have long‐term implications and beneficial value impact of a tropical cyclone. At present, the role of an and therefore need to be planned in a holistic manner HPC system in computing power is quite evident and considering aspects of coastal, social, economic, and inevitable and allows dynamic coupling of atmosphere‐ environmental vulnerability having wide socioeconomic ocean models to run ensemble predictions as well run in a implications. real‐time mode providing realistic estimates of storm The study on tropical cyclone activity, storm surges, surge height, storm surge envelope, and associated wind‐ and associated extreme wind waves is a quite fascinating wave characteristics. In the Indian scenario, at present the subject having many challenges that have unequivocally coupled models (hydrodynamic model ADCIRC coupled drawn the attention of the scientific community world- with SWAN wave model) have proven efficacy in storm wide in order to provide better quality forecast in terms surge forecast. It involves a dynamic coupling between of cyclone track, intensity, and the probable landfall storm surge and wind waves through radiation stress and location to aid timely warnings for better emergency precisely accounts for the wave‐induced effect in the operations and evacuation measures and efficient coastal overall prediction of total water level elevation near the zone management. The archives on historical cyclone coast considering the combined mutual nonlinear inter- track records signify that each cyclone track is unique in action effects between storm surge, astronomical tides, nature, thereby posing a real challenge to the atmospheric and wind waves. Recent developments include a few case scientists and oceanographers worldwide to devise a reli- studies carried out using coupled as well stand‐alone able forecasting system to predict cyclone tracks, improve models for recent very severe cyclone cases that had land- accuracy in tropical cyclone landfall, and estimate fall along the east coast of India. The chapter provides an storm surge and associated coastal flooding and the role overview as well as discussions on the past studies carried
Tropical Cyclone–Induced Storm Surges and Wind Waves in the Bay of Bengal 241
out on storm surges and extreme wind waves over the Bay intensity. Over the Bay of Bengal region, the monthly fre-
of Bengal region and elucidates the recent developments quency of tropical cyclone activity portrays a bimodal dis-
carried out in this field. Though significant progress in tribution, with the primary peak during November and a
storm surge, wind‐wave modeling, and developments in secondary peak during the month of May. It is seen that
physical parameterization has been achieved in other about 16% of tropical cyclones intensify into severe
ocean basins during the past few decades, there are gap cyclones, and about 7% further intensify into very severe
areas that need introspection as well as require novel and cyclonic storms. The India Meteorological Department
innovative ideas in order to provide a reliable information (IMD), the nodal weather agency under the Ministry of
and dissemination system that can save life and property Earth Sciences, Government of India, has developed an
during a tropical cyclone event. E‐Atlas (Cyclone Warning Research Center, CWRC, India,
2011) that provides a concise picture of tropical cyclone
17.2. METHODOLOGY activity over the North Indian Ocean basin. The E‐Atlas is
a comprehensive collection of data, framed in a Graphical
The study first makes an analysis of the tropical cyclone User Interface (GUI) based interface on all the weather dis-
activity over the North Indian Ocean basin covering var- turbances that led to depressions, cyclones, and severe and
ious aspects on the annual frequency of cyclones, depres- very severe cyclones formation and dissipation over the
sions, and severe and very severe cyclonic systems in the North Indian Ocean region. The data period spans from
North Indian Ocean based on 121 years of data from the 1891 until the present, covering a total period of 127 years.
India Meteorological Department (IMD). The study also The historical track details are maintained by IMD and the
performs a trend analysis on tropical cyclone activity. Joint Typhoon Warning Center (JTWC) (https://www.usno.
Relevant studies on tropical cyclone‐induced storm navy.mil/NOOC/nmfc-ph/RSS/jtwc/best_tracks/). The data
surges over the Bay of Bengal basin are also discussed in source from JTWC is available for a period starting from
detail. Thereafter, the progress and advancements made 1945 onward, whereas the IMD has a data repository avail-
in storm surge modeling over the global ocean basins and able for a longer duration. There are also other sources of
in particular topical studies relevant to the Bay of Bengal data, such as the International Best Track Archive for
basin are reported. The role of wind waves in operational Climate Stewardship (IBTrACS) from the World
sea‐state forecast and in particular their role during Meteorological Organization (WMO), which is maintained
extreme weather events is highlighted. The progress in by NOAA National Centers for Environmental Information
wind‐wave modeling studies both in context to global (https://www.ncdc.noaa.gov/ibtracs/). Data are provided on
perspective as well in regional scale for the North Indian tropical cyclone best tracks with an objective to understand
Ocean is discussed at length. Thereafter, the role of cou- their distribution, intensity, and frequency over the global
pled models in an operational scenario is reported with ocean basins (Knapp et al. 2010). There are several Regional
special emphasis on wave–current interaction. The Specialized Meteorological Centers (RSMCs) worldwide
importance of coupled models for operational forecast and other international centers that have contributed to the
and their efficacy in simulating realistic total water level development of the IBTrACS global best track tropical
elevations during tropical cyclone activity is highlighted. cyclone data. The various agencies includes RSMC Miami,
The role of continental shelf slope and width on the non- RSMC Honolulu, RSMC Tokyo, RSMC New Delhi,
linear interaction between storm surges, tides, and wind RSMC La Reunion, RSMC Nadi, RSMC Perth, RSMC
waves is discussed. Further, the results obtained from Darwin, RSMC Brisbane, RSMC Wellington, China
model simulations for four severe tropical cyclones Meteorological Administration’s Shanghai Typhoon
(Thane, Aila, Phailin, and Hudhud) cases are discussed in Institute (CMA/STI), Joint Typhoon Warning Center,
detail. NCDC DSI‐9635, NCDC DSI‐9636, UCAR ds824.1, and
the Hong Kong Observatory (HKO). The RSMC New
17.3. TROPICAL CYCLONE ACTIVITY OVER Delhi under IMD also contributes data on tropical cyclones
THE NORTH INDIAN OCEAN for the Indian Ocean region to IBTrACS. There are some
pioneering recent studies that resulted by using the IBTrACS
Tropical cyclones generally form over the warm oceans v03r05 data (Knapp et al., 2010), such as the poleward shift
and there are some favorable conditions that determine in the maximum intensity of tropical cyclones (Kossin
their formation and sustenance. The necessary conditions et al., 2014).
are sea surface temperature (SST) greater than 26°C, low In context of the Bay of Bengal region, a very recent
magnitude of vertical wind shear, large low‐level vorticity, detailed study by Sahoo and Bhaskaran (2017) resulted in
and higher midtroposphere relative humidity. It is well the development of a comprehensive data set on tropical
documented that the months May–June and October–
cyclone–induced storm surge and coastal inundation
November are the seasons that produce cyclones of high for the east coast of India. The annual distribution in the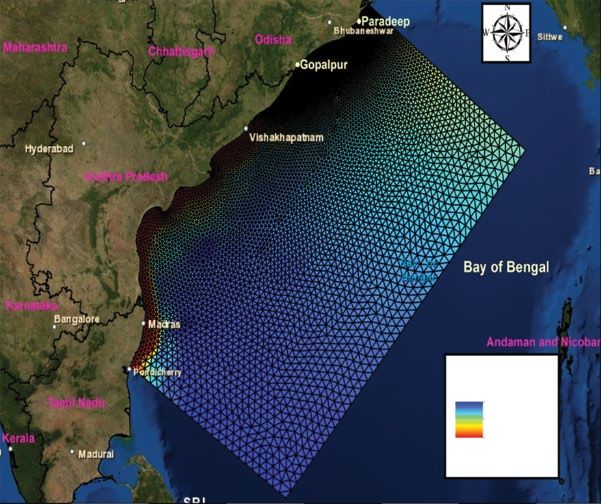
242 TECHNIQUES FOR DISASTER RISK MANAGEMENT AND MITIGATION frequency of depressions and cyclones in the North tropical cyclone activity, and Figure 17.1d shows the total Indian Ocean region (Sahoo & Bhaskaran, 2017) for a number of severe cyclonic storms in the Bay of Bengal. period of 125 years (1891–2015) that best fitted with a The statistics of tropical cyclone activity show that third order polynomial representing their trend is shown increased frequency of high intensity cyclones over the in Figure 17.1. Their study (Sahoo & Bhaskaran, 2017) North Indian Ocean basin is a major concern for India analyzed the past 125 years of tropical cyclone data avail- and Bangladesh coastal regions. Singh et al. (2000, 2001) able from IMD and mentions that a total of 1,405 cyclonic and Singh (2007) have also reported on the increasing systems developed over the North Indian Ocean region trends in frequency of intense tropical cyclone activity (Figure 17.1a), which includes a total of 775 depressions, over this region. The study by Srivastava et al. (2000) 332 cyclonic storms, and 298 severe cyclonic storms focused on the low‐energetic cyclones and concluded that (CWRC, 2011). decreasing activity is noticed over the Bay of Bengal The classification is based on the maximum sustained region in the last four decades. Other interesting studies wind speed as per the IMD norms available at http://imd. by Wang et al. (2006) and Trigo (2006) advocate that an gov.in/section/nhac/termglossary.pdf and the Dvorak increased frequency of tropical cyclones can be expected technique that used enhanced infrared and/or visible in the head Bay of Bengal region as a consequence of satellite imagery to quantify the intensity of the cyclonic northward shift in midlatitude storm tracks. A recent system. The IMD classification or the “T” classification study by Kossin et al. (2014) signifies that the recent is used to estimate quantitatively the intensity of tropical year’s location of cyclogenesis has shifted due to global cyclones based on the maximum sustained wind speed. warming with a tendency of poleward shift. Their study For example, T1.0 is used to classify a Low Pressure (Kossin et al., 2014) indicates that the poleward shift System (wind speed < 31 km h−1); T1.5 for a Depression occurred at a rate of 53 and 62 km per decade in the (wind speed between 31 and 49 km h−1); T2.0 for Deep Northern and Southern Hemispheres, respectively, how- Depression (wind speed between 50 and 61 km h−1); T2.5 ever, there is an unclear trend in the shift of cyclogenesis for Cyclonic Storm (wind speed between 62 and for the North Indian Ocean basin. In the Indian context, 88 km h−1); T3.5 for Severe Cyclonic Storm (wind speed there have been significant improvements in the opera- between 89 and 117 km h−1); T4.0 for Very Severe Cyclonic tional forecasting of tropical cyclone track, intensity, Storm (wind speed between 119 and 221 km h−1), and landfall location, storm surge and coastal flooding, and T6.5 for a Super Cyclonic Storm (wind speed > extreme wind‐waves in recent years. The joint efforts 222 km h−1). As seen from Figure 17.1 for the 125 years of from the operational weather centers like IMD and data, the postmonsoon season of October and November ESSO‐INCOIS (Indian National Centre for Ocean recorded a maximum of 238 and 204 events followed by Information Services) under the Ministry of Earth the premonsoon season of June to August with a total Sciences, Government of India were quite instrumental count of 163, 156, and 181 events, respectively. It is inter- in providing timely warnings and periodic bulletins esting that the data reveal that during the period 1921– through various modes of dissemination that resulted in 1980, the frequencies were much higher (about 18 a massive coastal evacuation effort during cyclone Phailin cyclones/year) as compared with the period from 1981 (2013). About 550,000 people from the coastal belts of until the present (Sahoo & Bhaskaran, 2017). However, Odisha and Andhra Pradesh States were evacuated to the trend in the present decade exhibits a higher fre- safer locations. quency of very severe cyclonic storms (VSCS) as com- pared with the past (Figure 17.1b). Based on analysis of 17.4. STUDIES ON TROPICAL CYCLONE–INDUCED the 125 years of data, the annual probability of intensifi- STORM SURGES FOR THE BAY OF BENGAL cation in terms of percentage from depression to cyclonic storm was 44.8%, and from depression to severe cyclonic One can find numerous studies in the literature that dis- storm was 21.2%, and from cyclonic storm to severe cuss the impact of tropical cyclone–induced disastrous cyclonic storm was 47.3%. The months of March‐April‐ storm surges in the Bay of Bengal. Some of the pioneer- May exhibited the highest probability of intensification ing and notable studies include Murty and Flather (1994), (71.4%, 78%, and 69.9%, respectively) for depressions Das (1994), Dube et al. (1997), Madsen and Jakobsen that eventually converted to cyclonic storms, and during (2004), Rao et al. (2007), and many others. Several factors the postmonsoon season October‐November‐December, that directly contribute to disastrous storm surge in the the respective values were 50%, 67.6%, and 59.8% (Sahoo Bay of Bengal region are discussed in these studies. Most & Bhaskaran, 2017). The annual frequency of depres- important, the convergence of the bay (funnel‐shaped), sions, cyclones, and severe cycloni, and storms for the presence of wide continental shelf encompassing the del- Bay of Bengal region is shown in Figure 17.1c. From taic environment in the head Bay of Bengal, densely pop- 1970 to the present, a decreasing trend is observed in the ulated low‐lying coastal belt, high tidal range, presence of
(a)                        Yearly frequency of cyclones and depressions                              (b)                      Yearly frequency of very severe cyclonic storms
  20                                                                                                       8
  18                                                                                                                                                         y = –1E – 05x3 + 0.0575x2 – 111.87x + 72557
                                                                                                           7          Frequency of very severe cyclonic storms
  16                                                                                                                  Poly. (frequency of very severe cyclonic storms)
                                                                                                           6
  14
                                                                                                           5
  12
  10                                                                                                       4
      8                                                                                                    3
      6                                                                                                    2
      4
                                                                                                           1
      2
                Frequency of cyclones and depressions   y = 6E – 07x3 – 0.005x2 + 13.098x – 10709          0
      0
       1891         1911         1931         1951        1971            1991           2011                  1891        1911        1931         1951         1971        1991         2011

(c)                                                                                                  (d)
            Yearly frequency of depressions, cyclones, and severe cyclonic storms in the                              Yearly frequency of severe cyclonic storms in the Bay of Bengal
                                          Bay of Bengal                                                    8
  18
  16                                                                                                       7
                                                                                                                       Annual                                y = –8E – 06x3 – 0.0466x2 – 90.557x + 58621
  14                                                                                                       6
  12                                                                                                       5
  10
                                                                                                           4
      8
                                                                                                           3
      6
                                                                                                           2
      4
      2                                                                                                    1
               Annual                                   y = 4E – 06x3 – 0.0222x2 + 46.678x – 32485
      0                                                                                                    0
          1891 1901 1911 1921 1931 1941 1951 1961 1971 1981 1991 2001 2011 2021                                1891         1911       1931          1951         1971         1991          2011

            Figure 17.1 Annual frequency of (a) cyclones and depressions, and (b) very severe cyclones in the north Indian Ocean; (c) depressions,
            cyclones, and severe cyclones, and (d) very severe cyclones in the Bay of Bengal (from Sahoo & Bhaskaran, 2017).
244 TECHNIQUES FOR DISASTER RISK MANAGEMENT AND MITIGATION

numerous riverine systems, tidal creeks, mudflats, coastal    (Camp Dresser & McKee, 1985). Subsequent develop-
geometry, complex geomorphic environment, and so on,          ments and improvements in model parameterizations
results in the occurrence of disastrous storm surge in the    resulted in the development of the SLOSH (Sea, Lake
Bay of Bengal as compared with other regions elsewhere        and Overland Surges from Hurricanes) model in 1992 by
in the world. The coastal inundation that results from        the National Weather Service (Jelesnianski et al., 1992).
storm surge during tropical cyclone landfall mainly           It was a two‐dimensional, dynamic storm‐surge model
depends on the storm surge height, vegetation character-      that used a curvilinear polar coordinate grid structure for
istics prevalent over the affected regions, and onshore       spatial discretization; it was extended to elliptical and
topography of the hinterland. The disastrous effects of       hyperbolic grids thereafter. The National Hurricane
this natural geohazard can be minimized to a large extent     Center, USA, uses the SLOSH model for real‐time fore-
through reliable numerical model predictions that pro-        casts of storm surges. The US Army Corps of Engineers
vide alerts and timely warnings to the coastal commu-         (USACE) also developed a one‐dimensional numerical
nities. Modeling the prevalent hydrodynamics along the        model called DYNLET (Amein & Kraus, 1991). Further
coastal environment during tropical cyclone activity is a     research efforts have led to the development of three‐
quite challenging task due to the complex nonlinear           dimensional and depth‐averaged numerical models.
interaction mechanism between various environmental           Parallel to the developments in the SLOSH model
drivers such as tides, wind waves, currents, and storm        another model called ADCIRC (Advanced Circulation
surge.                                                        Model) was also developed. The ADCIRC model was
                                                              a joint collaborative effort between the USACE
17.4.1. Progress of Storm‐Surge Modeling                      Engineering Research and Development Center,
in a Global Perspective                                       University of Notre Dame, and the University of North
                                                              Carolina, USA. The present version of ADCIRC has the
  Studies on storm‐surge modeling started during the          flexibility to run in two‐dimensional depth integrated
late 1950s. During the past six decades of extensive          (2DDI) and three‐dimensional (3D) modes. It is proven
research and efforts, there have been tremendous devel-       as one of the most robust and reliable models worldwide
opments made. However, numerical modelers have been           for storm surge and inundation studies, and is also used
looking forward to robust, advanced techniques, and           by the operational centers for real‐time forecasts. More
innovative ideas to understand and predict the potential      details on the governing equations and technical details
variability in tropical cyclone–induced storm surges. A       are available in Luettich et al. (1992) and Luettich and
comprehensive overview on the various models adopted          Westerink (2004). The recent developments include the
by operational centers globally is available in the studies   coupling of ADCIRC hydrodynamic model with SWAN
by Murty (1984) and Sundermann and Lenz (1983).               (Simulating Waves Nearshore) wave model available in
Flather (1976) and Flather and Proctor (1983) for the         Dietrich (2010). There are many case studies performed
North Sea, Jelesnianski and Chen (1982) for the Gulf of       and available in the studies by Hubbert et al. (1991),
Mexico and Atlantic coast, and Bode and Hardy (1997)          Powell and Houston (1996), Powell et al. (1998), Houston
for the European coast are some of the notable studies on     et al. (1999), Fleming et al. (2008), Blain et al. (2008),
storm surges.                                                 Westerink et al.(2008), Dietsche et al. (2007), Peng et al.
  Prior studies on development of storm‐surge modeling        (2004), Xie et al. (2004), and Cho et al. (2009).
started with statistical analysis based on archived storm
records. Some of the pioneering efforts in this context       17.4.2. Progress of Storm‐Surge Modeling
that used empirical formulations include the studies by       in the Bay of Bengal Basin
Conner et al. (1957), Donn (1958), Bretschneider (1959),
Welander (1961), Miyazaki et al. (1962), Harris (1963),         The storm‐surge problem for the Indian coast started
and Jelesnianski (1965). Continued efforts and improve-       with the development of empirical relations and the
ments in the empirical-based models resulted in the           studies by Rao and Mazumdar (1966) led to generation
development of the SPLASH model (Jelesnianski, 1972),         of nomograms that represented the storm‐surge amplitude
which estimates storm surge for a given bathymetry and        as a function of storm intensity and speed. Another study
approach angle of a tropical cyclone. Nomograms that          by Janardhan (1967) used empirical formulations consid-
were developed using this model gained popularity and         ering the static wind setup and assuming a balance bet-
were used for real‐time storm‐surge prediction.               ween wind stress and sea‐surface slope to estimate
Thereafter, in 1976 the Federal Insurance Agency devel-       storm‐surge height at Sagar Islands located in the head
oped the FEMA TTSURGE (Federal Emergency                      Bay of Bengal. There were several other studies that relied
Management Agency Tetra Tech SURGE), which was                on empirical models such as by Chaudhury and Ali
recommended by the National Academy of Sciences               (1974), Rao and Majumdar (1966), Qayyum (1983), and
Tropical Cyclone–Induced Storm Surges and Wind Waves in the Bay of Bengal 245
Das et al. (1978). It was only during the early 1970s that tion. Also the inundation computation in ADCRIC uses
numerical studies on storm surge were attempted. A a sophisticated drying and wetting algorithm. Studies by
pioneering study by Das (1972) led to the development of Bhaskaran et al. (2013), Murty et al. (2014, 2016),
the first numerical model for storm‐surge prediction in Gayathri et al. (2015), and Poulose et al. (2017) pioneered
the Bay of Bengal. Later, Das (1980) introduced non- storm‐surge and coastal inundation modeling for the
linear advective terms in the model equations and pro- Indian coast using the coupled ADCIRC + SWAN
posed that inclusion of tide‐surge interaction into the model, which can handle both hydrodynamics and waves.
model physics advanced the arrival time of peak surge by The most recent studies on storm surge and coastal inun-
about 2 hr. It was probably the study by Murty and Henry dation using coupled ADCIRC + SWAN for various
(1983) that developed for the first time a series of severe cyclonic storm surges along Indian coasts are by
numerical models for tide and surge that used an irregular Bhaskaran et al. (2013) for cyclone Thane, Murty et al.
rectangular grid instead of a regular rectangular grid. (2014) for cyclone Phailin, Gayathri et al. (2015) for
Significant progress has been made in this subject and the cyclone Aila and Murty et al. (2016) for cyclone Hudhud.
study by Johns and Ali (1980) and Johns et al. (1981) The studies could provide the total water level elevation
included the Ganges–Brahmaputra–Meghna River system at the coast during a cyclonic landfall episode. At present
using the depth integrated nonlinear equations of motion the coupled model is used by INCOIS (Indian National
and continuity. The SPLASH model of Jelesnianski Centre for Ocean Information Services) for operational
(1972) was later adopted by Ghosh (1977) for the east forecast of storm surge and inundation in the North
coast of India. In another study, Johns et al. (1981) used Indian Ocean basin.
the full nonlinear depth‐averaged model of Jelesnianski
(1976) to investigate storm‐surge activity for the 1977 17.5. CHARACTERISTICS OF OCEAN
cyclone Andhra. Literature review suggests that the most WIND WAVES AND THEIR ROLE DURING
complex cyclone model used to model the Bay of Bengal EXTREME WEATHER EVENTS
storm surge (Jarrell et al. 1982) in the 1980s was based on
the US National Weather Service for the standard project The air–sea interface is a boundary between the
Hurricane (Murty et al. 1986). In this study, 258 atmosphere and ocean that is quite dynamic in nature,
simulations were analyzed generated from a total of
and the exchange of momentum, heat, gas, and particles
eight numerical storm‐surge models, five for the occurs across this boundary. The wind stress that acts
Sri Lanka/India/Bangladesh region, two for the Burma/ over the near‐surface atmospheric boundary layer
Thailand region, and one for the Andaman Islands imparts momentum, thereby generating wind waves or
region. Extensive studies on storm surge were carried out surface gravity waves having wave periods ranging bet-
using a finite difference model for the Bay of Bengal ween 2 to 30 seconds. Study on the characteristics of
region by Dube and Gaur (1995) also popularly known as wind waves such as their generation, propagation, and
IIT‐D storm‐surge model. An elaborate overview of finite dissipation mechanisms have been a subject of immense
difference models is available in Dube et al. (1997). Several interest for several decades having significant practical
case studies were performed using the IIT‐D model for applications and economic importance. In the recent
the Indian coast. In addition, there are several studies past, there has been significant research on the study of
reported on storm‐surge models by Rao et al. (1997), wind waves and their prediction due to increasing marine
Chittibabu (1999), Chittibabu et al. (2000, 2002), Dube and offshore activities. A precise knowledge of the sea
et al. (2000ba, 2000b, 2004), and Jain et al. (2006a, 2006b) state and its prediction is very vital for various marine‐
for the Gujarat, Andhra Pradesh, Odisha, and Tamil related operations, efficient ship routing, strategic naval
Nadu coasts. operations, port and harbor development activities,
Recent developments include the implementation of coastal zone management, and so on.
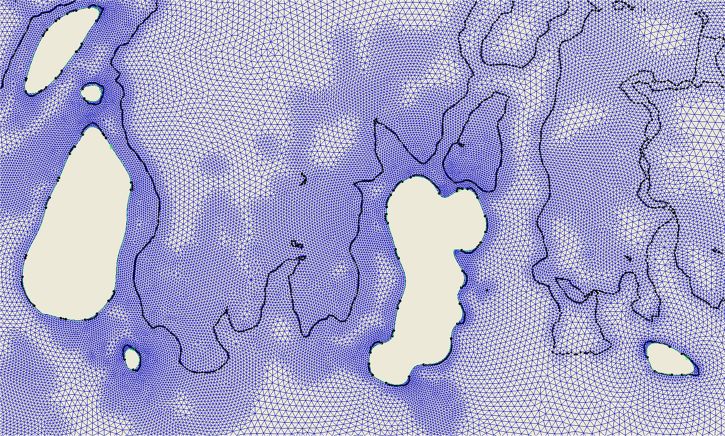
the ADCIRC model by Rao et al. (2010) for the Nevertheless, the scientific and engineering community
Kalpakkam coast located in Tamil Nadu State to eval- has a profound interest in understanding the associated
uate extreme storm‐surge scenarios. The ADCIRC model kinematics and dynamics of ocean wind waves for routine
uses a flexible finite element mesh that is capable to forecast and case‐based studies. The engineering
resolve the complex coastline geometry as well as sophis- community working in the related disciplines of ocean
ticated model physics to compute storm surge and inun- engineering, naval architecture, and civil and hydraulic
dation, and hence more advantageous as compared with engineering requires precise wave‐related information to
the IIT‐D storm‐surge model. Though the IIT‐D model design, operate, and manage structures or natural sys-
fared reasonably well in many case studies, it could be tems in the marine environment. Ocean waves also play a
used only for storm‐surge computation, unlike ADCIRC significant role in controlling coastal processes in the
which has capability for both storm surge and inunda- coastal and nearshore environments. As per the existing
246 TECHNIQUES FOR DISASTER RISK MANAGEMENT AND MITIGATION

knowledge, wind blowing over the ocean surface gener-         of wave generation by wind and quadruplet wave–wave
ates wavelets and the spectral components eventually          interaction and dissipation due to white‐capping mecha-
develop over time extracting energy from the wind stress.     nisms. These deep‐water waves transform on reaching
Through nonlinear wave–wave interaction processes, the        shallow waters due to dominant physical processes like
energy within a wave system gets redistributed thereby        refraction, bottom friction, depth‐induced breaking, triad
determining the overall wave energy at a particular loca-     wave–wave interaction, wave–current interaction,
tion and time, and that can be conveniently expressed in      diffraction, and reflection (Holthuijsen, 2007). Hence,
the form of a wave spectrum. This is the present state of     choosing an appropriate wave model for the desired task is
knowledge acquired despite several decades of ongoing         very important considering the dominant physical
research in the field of ocean wave modeling.                 processes relevant to the study area.
   The random nature of ocean waves and their complex
interaction mechanism in terms of their kinematics and        17.5.1. Progress of Wind‐Wave Modeling
dynamics of wave evolution was a major challenge in the       in a Global Perspective
past. The fundamental and classical studies on water
waves with valid assumptions and developments in                 Broadly speaking, there have been significant improve-
mathematical formulations date back to the nineteenth         ments in the operational aspects of regional and global
century. Table 17.1 provides an overview on the major         ocean wave forecasting systems routinely used for medium
advances and developments in the field of ocean wind          range forecasts of ocean state variables (Tonani et al.,
waves during the past few decades.                            2015). The GODAE (Global Ocean Data Assimilation
   The pioneering studies by Gelci et al. (1957) introduced   Experiment) project played a key role in the collabora-
the concept of energy balance equations to understand         tion between national groups in the development of
the phenomenon of wave evolution. Since then different        global ocean forecasting systems (Smith, 2006). More
categories such as first, second, and third generation wave   information is available at the website https://www.godae-
models have evolved. At present, the third generation         oceanview.org/ on the activities related to ocean analysis
wave models are used for routine wave forecasting, and        and forecasting. The GODAE team has partnerships
several advancements are noticed in the parameterization      from various countries like the UK, France, Norway,
of physical processes in a wave forecasting system. At        Italy, USA, Australia, Canada, Japan, Brazil, India, and
present, there has been a tremendous boost in computing       China (more details on future scope of activities by
power, information technology, data acquisition systems,      the individual countries are available in Tonani et al.,
satellite remote sensing, and an increasing number of in      2015). The Marine Modeling and Analysis branch of
situ observational platforms.                                 the Environmental Modeling Center at the National
   Broadly speaking, the wave models can be classified        Centers for Environmental Prediction (NCEP), USA,
into phase‐averaging or phase‐resolving, wherein the          provides information on wave forecast using the
phase‐averaged models are expressed in terms of energy        NOAA WAVEWATCH III (NWW3) run four times a day
balance with appropriate sources and sinks used to repre-     providing the hindcast and forecast information.
sent the relevant physical processes. Phase-resolving         The model products are available in global and regional
models are based on the governing equations of fluid          nested grids. The NWW3 model products for waves
mechanics formulated to obtain the free surface condition.    include significant wave height, wind‐sea wave height,
However, the phase-averaging models have no prior             primary and secondary swell wave height, wind speed
restriction on the area to be modeled, whereas the phase-     and direction, peak wave period, wind‐sea period, and
resolving models have an inherent limitation on the spatial   primary and secondary swell period. The basin‐scale
dimension of the computational area. The various              products cover the Atlantic, Pacific, and Indian Ocean
physical processes that are accounted for in phase‐aver-      regions. The regional scale simulations cover the northeast
aged models include (1) wave generation by wind               and northwest Atlantic, east coast of the USA, northeast
accounted due to momentum transfer from atmosphere to         Pacific, waters of Alaska, and Australia–Indonesia areas.
ocean, (2) refraction due to water depth, (3) shoaling due    The localized version of NWW3 includes location‐
to shallow water depths, (4) diffraction due to obstacles,    specific areas of the waters surrounding the USA.
(5) reflection due to impact with solid obstacles, (6) bot-   Readers can refer to the website https://polar.ncep.noaa.
tom friction due to heterogeneity of bottom materials, (7)    gov/waves/for more details. In addition, there are com-
wave breaking effects when steepness exceeds a critical       panies such as the Ocean Weather Inc. (at http://www.
level, (8) nonlinear wave–waveinteraction due to quadru-      oceanweather.com/data/), which provides services to the
plets and triads resulting in wave energy redistribution,     coastal and ocean engineering community in the areas of
and (9) wave–current interaction effects. In deep waters,     marine meteorology, ocean waves and currents, ocean
the physical processes can result from the combined effects   engineering, and statistics of environmental data.
Table 17.1 Research Advances in the Field of Ocean Surface Waves During the Past Few Decades.
S.No.        Advances             1940s                 1950s                1960s             1970s              1980s             1990s                2000s
1       Statistical theory   Theory of random Wave statistics &        Mathematical       Similarity form    High frequency    Wave number –      Wave number –
                              noise            spectral                 developments in     and work on       wave spectrum      frequency         frequency spectra
                                               developments             wave spectra –      directional                         spectra
                                                                        nonlinear effects   spectra
2       Nonlinear theory     Nonlinear theory    Nonlinear theory      Wave instability   Computation of     Wave breaking     Wave breaking      Wave breaking and
                              of regular          of random waves       and wave            dispersion        computational     and energy         energy dissipation
                              waves                                     interaction         relation          works             dissipation
                                                                        studies
3       Experiments          Basic studies and   Observations from     Advances in field Studies on          Wave dynamics – Microwave            Ocean observing
          (laboratory         visual based        instruments           based               equilibrium –      use of satellite remote sensing     systems and
          and field           observations                              campaigns and        planned ocean    observations                         satellite based
          measurements)                                                 planned             experiments                                            platforms
                                                                        experiments
4       Air–sea interaction                      Sun glitter project                      JONSWAP field      HEXOS             SWADE, RASEX       Coupled
         studies and wave                                                                   experiment                                             atmosphere–ocean
         projects                                                                                                                                  models
5       Wave forecasting    Sverdrup and         SMB and PNJ wave      First generation   Second generation Third generation   Third generation   Third generation
         techniques           Munk                forecasting            wave models        wave models      wave models        wave models        wave
                                                  methods                                                    (WAM)              with data          models – ensemble
                                                                                                                                assimilation       modeling
                                                                                                                                (WAM, WW3)

Source: Mitsuyasu (2002).
248 TECHNIQUES FOR DISASTER RISK MANAGEMENT AND MITIGATION
17.5.2. Progress of Wind‐Wave Modeling in Context and SWAN (0.002° × 0.002°). For general ocean
of Indian Seas circulation, the ROMS model configured at a resolution
of 0.125° × 0.125° is used. The General NOAA Oil Spill
The ocean state forecast information for the Indian Modeling Environment (GNOME) Oil Spill model simu-
subcontinent is quite vital, having diverse application and lates the oil spill trajectories. The forecasted winds
societal benefits amongst the user community. The fore- obtained from atmospheric models from different meteo-
casts have inherent economic advantages varying from rological agencies such as NCMRWF and ECMWF force
traditional fishing to offshore‐related activities. Besides, the ocean models. To improve the nearshore and coastal
with the numerous major and minor ports located along forecasts, models configured using nested grids are used
the Indian coastline, the environmental information on and run in high-performance computers (HPC). The ser-
sea state related to wind waves, swell activity, currents, vices provided by INCOIS include location specific fore-
and tides is critical for efficient port operations. The casts; forecast for coastal, deep sea, and island areas; port
movement of vessel traffic and operational activities and harbor forecast; and web map services. In addition,
inside a port requires prior knowledge of environmental emergency services by ESSO–INCOIS also cover oil spill
factors that aids port operations. Offshore activities such advisories, search and rescue operations, and high wave
as mooring operations and loading and off‐loading of alerts for coastal regions. The forecast services for port
liquid and gas products to facilities located in the hinter- and harbor includes 75 locations along the Indian coast
land also requires accurate, timely sea‐state information. and island locations. These location‐specific forecasts are
Recreational activities at selected coastal locations also subdivided into two zones, one up to 20 km and the other
need appropriate information of sea state for smooth ranging from 20 to 50 km. In addition, ocean wave fore-
operations. Many applications in the ocean environment casts are provided to neighboring countries like the
require precise information of sea state; some of them are Maldives. The advisories for oil spill cover a forecast
optimum shipping routes, erection of marine systems, period of three days updated at an interval of every 3–6
search and rescue operations in the sea, defense‐related hours based on requirement. Similarly, the services for
activities, oil spills, and so on. During extreme weather high wave alert to coastal regions cover a forecast of 1–2
events, sea‐state information is imperative for offshore oil days updated every three hours. The value added service
platforms and planning and evacuation measures for the covers information on the inland vessel limits in forecast
coastal population. mode for one day updated every three hours. Validation of
The Earth System Science Organization (ESSO)–Indian these location‐specific forecasts in near real‐time is based
National Centre for Ocean Information Services (INCOIS) on the availability of satellite passes over the Indian Ocean
established the Integrated Indian Ocean Forecasting region. ESSO–INCOIS disseminates the information in
System (INDOFOS) for medium‐range prediction of the the vernacular by various modes such as e‐mail, mobile
surface and subsurface characteristics of the Indian phone, TV, radio, and electronic display boards to the
Ocean. The predictions have a lead time of 5–7 days at stakeholders. For areas that have no electricity supply, the
present. The activities under the INDOFOS cover a broad dissemination mode is through manual display boards.
gamut such as surface wave forecast c overing aspects of Readers can refer to the w ebsite http://www.incois.gov.in/
wave height, period, and direction for both wind waves portal/osf/osf.jsp for more details.
and swells; sea‐surface currents; sea‐surface temperature; The Meteorological and Oceanographic Satellite
mixed layer depth; depth of the 20° isotherm; astronomical Data Archival Centre (MOSDAC) under the Space
tides; wind speed and direction; and oil spill trajectory Applications Centre (SAC), Indian Space Research
modeling. The forecast provided by ESSO–INCOIS is Organization (ISRO) provides the forecast map of wind‐
widely used by the user community such as fishermen, waves using the WAM model every six hours extended to
Indian Navy, Indian Coast Guard, shipping corporations, 120 hr. The WAM‐computed parameters such as wave
offshore oil and gas exploration companies, and the height, period, and direction, swell height, and wind
scientific community at large. The research activities under speed form an integral part of the forecast system cov-
INDOFOS have expanded and, at present, location‐ ering the geographical domain extending from the zero
specific forecasts are available for selected areas covering meridian to 160°E longitude, and from 70°N to 70°S in
the Arabian Sea, Bay of Bengal, North Indian Ocean, the zonal direction. The classification of sea states from
South Indian Ocean, Red Sea, Persian Gulf, and South the WAM computed wave heights covers five broad cate-
China Sea. Besides, detailed forecasts are also available for gories: (1) slight, (2) moderate, (3) rough, (4) very rough,
potential fishing zones, union territories, and island and (5) high. In addition to WAM forecasts, MOSDAC
regions of India. The operational wave models and their also provides wave forecasts from the SWAN (Simulating
resolutions used at ESSO–INCOIS include the MIKE‐21 Waves Nearshore) model at a six-hour interval extended
SW (1° to 0.07°), NOAA WAVEWATCH III (1° to 0.05°), to 120 hr. The domain of SWAN runs covers 60°E–90°ETropical Cyclone–Induced Storm Surges and Wind Waves in the Bay of Bengal 249
and 21°N–11°S. In addition to these wave forecasts, other increase in wave heights. In a following current, the
products such as mixed layer depth (MLD), sea level opposite occurs, where the wavelength increases, the
anomaly (SLA), sea surface current, temperature, and group velocity increases, and the wave heights are
salinity using Princeton Ocean Model (POM) also form reduced. Wave period will be longer in following currents
activities of MOSDAC. and shorter in opposing currents. Thus, the Doppler shift
plays an important role in affecting the wave characteris-
17.6. COUPLED WAVE‐HYDRODYNAMIC MODELS tics. The modulation of absolute frequency by unsteady
currents and modulation of intrinsic frequency by propa-
Prior studies have used wave and hydrodynamic models gation over spatial gradients of current can also occur.
as separate entities to simulate the flow and wave condi- Various empirical theories for wave–current interaction
tions over a region; most of them are case‐based studies. in the b ottom boundary layer suggest that the friction
Coupling of wave currents as a single modeling system coefficient experienced by waves in a current regime will
has been long recognized and their interaction controls be larger than in no current. This also applies to the effec-
the momentum and energy exchange between the tive current friction factor in the presence of waves.
atmosphere and the ocean that needs to be better resolved. Another effect is the vertical wind shear on wave breaking
The coupling of these models can be achieved at various (Wolf et al., 1988).
levels of complexity. One can find a complete review on The topic of wave–current interaction is found in the
wave–current interaction mechanisms in the study by studies by Ardhuin et al. (2009), Mellor (2003, 2011),
Jonsson (1990) and more recently in Cavaleri et al. (2007). Mellor et al. (2008), Kumar et al. (2012), and Zodiatis
The effects from waves that are considered in the coupled et al. (2015). Bolanos et al. (2011, 2014) advocated the
modeling system are due to the radiation stress and importance of the wave–current interaction in a tidal
Stokes drift. Another study by Babanin (2011) also shows dominated estuary and showed that inclusion of wave
that interaction of turbulence and bottom stress is also effects through radiation stress improved the velocity
important. structure. The wave‐induced surface and bottom stress,
and radiation stress are the mechanisms through which
17.6.1. Role of Wave–Current Interaction waves interact with currents. Surface waves may also affect
currents in other ways, such as through the wave‐induced
In a broad sense the wave–current interaction can be Stokes’ drift and the Coriolis wave stress (Huang, 1979;
defined as the interaction mechanism between surface Jenkins, 1987). Wave‐induced wind stress increases the
waves and the mean flow. The effect from currents that magnitude of currents both at the surface and near the
includes tidal and wind-driven currents, river currents, seabed. On the other hand, wave‐induced bottom stress
and so on, contributes to the mean flow. The process of weakens the currents both at the sea surface and near the
wave–current interaction leads to transfer of energy seabed. Near the sea bottom, there exist enhanced levels of
thereby affecting both waves as well the mean flow. In turbulence due to wind–wave interaction (Grant &
shallow water depths, the propagation of wind waves is Madsen, 1979; Mathisen & Madsen, 1996, 1999). In
highly dependent on the bathymetric profile and coastal particular, the short‐period oscillatory nature of wave
hydrodynamics. When waves encounter currents in tidal orbital velocity leads to a thin boundary layer above the
inlets, at river mouths, or nearshore zones, the wave bottom. In this boundary layer, the fluid velocity changes
dynamics will be affected based on the speed and direction from its free stream value to zero at the bottom, where
of the interacting current. The waves affect the currents no‐slip condition applies. The high shear velocity within
mainly through the exchange of momentum flux from the wave bottom boundary layer produces high levels of
waves to currents. In turn, the currents can also affect the turbulence intensity and large bottom shear stress. In shal-
waves in different ways. It can affect the effective wind, low coastal waters, the near‐bottom flow consists of waves
and the fetch that in turn affects the wave generation. The and slowly varying currents. The strong turbulence inten-
effect of depth refraction and current refraction can sity within the thin wave bottom boundary layer therefore
cause changes in the wave parameters. Strong currents can have an impact on the currents, especially in causing
can have a significant influence on wave propagation the currents to experience an increased bottom resistance
characteristics. In the presence of an opposing current, in the presence of waves. Using the wave–current interac-
the wavelength will tend to shorten, thereby causing the tion model proposed by Grant and Madsen (1979),
group velocity to decrease. To maintain conservation of Ningsih et al. (2000) and Xie et al. (2001) have shown that
energy flux, the wave energy increases, resulting in a the surface waves could significantly affect the currents by
localized increase of wave height. In addition, opposing modifying the bottom drag coefficient. The waves affect
currents will refract the waves such that they are focused the wind stress by increasing the surface roughness
upon the area of strongest flow, which will cause a further length. The significance of wave–current interaction250 TECHNIQUES FOR DISASTER RISK MANAGEMENT AND MITIGATION
depends mainly on the water depth. The current experi- In the nearshore areas, the effect of radiation stress
ences an increased bottom resistance in the presence of also contributes to wave setup. As the waves approach
waves in shallow waters with high wind‐wave activity. The breaking point, there will be a small progressive setdown
wind waves modify the coastal circulation through of the mean water level below the still water level. This
enhancement of bottom stress. setdown is caused by an increase in the radiation stress
owing to decreased water depth as the waves propagate
17.6.2. Role of Coupled Models in Operational Forecast toward the shore. The setdown is maximum just seaward
of the breaking point. In the surf zone, there is a decrease
The ocean state is quite complex due to the mutual in radiation stress as wave energy is dissipated. This effect
nonlinear interaction between the winds, currents, and is stronger than the radiation stress increase owing to
waves. During extreme events like tropical cyclones, these continued decrease in the water depth. The result is a pro-
interactions are significant as the energy associated is gressive increase or setup of mean water level above the
quite high. The nonlinear wave–current interaction mech- still water level in the direction of the shore. The surf
anisms during an extreme event results in radiation stress. zone setup typically is significantly larger than the set-
Radiation stress, a term coined by Longuet‐Higgins and down that occurs seaward of the breaking point. The
Stewart (1964), causes the lowering (setdown) and raising wave setup is of particular concern during storm events,
(setup) of the mean water level that is induced by when higher wind waves resulting from the storm can
waves as they propagate into the nearshore regions. This increase the mean sea level. Hence, the radiation stress
is of immense importance in operational prediction plays a major role in coastal regions.
of the storm‐surge heights. Radiation stress can be Under certain conditions, it will become very impor-
defined as the depth‐integrated and phase‐averaged tant to take the interaction effects into consideration for
excess momentum flux caused by the presence of surface an accurate prediction of nearshore waves and currents,
gravity waves exerted on the mean flow. The radiation and understand aspects related to resultant sediment
stress describes the additional forcing due to the pre transport and beach change. The storm events increase
sence of waves that change the mean depth‐integrated the water level and enhance the risk on the coastal struc-
horizontal momentum in the fluid layer. As a result, the tures. The mutual interaction between currents and waves
varying radiation stress thereby induces changes in the through radiation stress thereby play an important role in
mean surface elevation and the mean flow. In a practical the coastal environment. Hence, a proper understanding
sense, the nearshore waves induce currents through radi- and quantification of the nonlinear interaction mecha-
ation stress, and resultant currents conversely affect the nism is crucial. To achieve reliable estimates of this
wave field, thus wave–current interaction always takes mutual interaction mechanism, it is mandatory to have
place to a greater or lesser extent. The radiation stress very high resolution spatial grids coupled to both wave
changes as a wave propagates through water of changing and hydrodynamic models.
depth. Considering the wave–current interaction during
cyclones, the radiation stress is modified by both chang- 17.6.3. Effect of Continental Shelf on the Nonlinear
ing water depth and external force. During a cyclonic Interaction Mechanism
event, there is a significant radiation stress being gener-
ated. It is clear that waves always interact with currents The basin characteristics, which include the coastline
by means of radiation stress. The current field is formu- geometry, relief features of the bottom such as width and
lated with depth‐averaged shallow water equations. The slope of the continental shelf, also play an important role
shallow water equations include the stress term, which in the overall development of storm surges. In the context
incorporates the radiation stress. The wave‐induced stress of the Indian coastline, the west coast of India has a
thereby influences the mean water surface elevation and larger continental shelf area compared to the east coast.
the depth‐averaged currents. This in turn can affect the In general, the shelf width is about 60 km in Kerala State
wave characteristic that modifies the radiation stress (off Kochi), and that gradually increases to about 330 km
generated by the waves. The energy of a surface wave is south of Gujarat (off Daman). The shelf break occurs
dependent on the mean water surface elevation. Therefore, along the entire coastline at water depths of about 130 m.
the radiation stress from waves affects the current, and Poulose et al. (2017) performed an idealized experiment
hence the mean water surface elevation and the depth‐ representing the west coast of India to understand the
averaged velocity. These variations can affect the wave role of the continental shelf on the nonlinear interaction
parameter, which again result in a modified radiation mechanism between storm surges, tides, and wind waves.
stress. Hence, the nonlinear interaction mechanism, In this context, the tidal range also increases from south
focused on effect of radiation stress on currents and its to north, and a maximum of about 11 m is attained over
countereffect on waves, can be explained. regions in the Gulf of Khambhat. Owing to high tidalYou can also read