Sediment supply from lateral moraines to a debris-covered glacier in the Himalaya
←
→
Page content transcription
If your browser does not render page correctly, please read the page content below
Earth Surf. Dynam., 7, 411–427, 2019
https://doi.org/10.5194/esurf-7-411-2019
© Author(s) 2019. This work is distributed under
the Creative Commons Attribution 4.0 License.

                      Sediment supply from lateral moraines to a
                        debris-covered glacier in the Himalaya
                Teun van Woerkom1 , Jakob F. Steiner1 , Philip D. A. Kraaijenbrink1 , Evan S. Miles2 , and
                                               Walter W. Immerzeel1
              1 Utrecht   University, Department of Physical Geography, P.O. Box 80115, Utrecht, the Netherlands
                                       2 School of Geography, University of Leeds, Leeds, UK

                                Correspondence: Teun van Woerkom (t.a.a.vanwoerkom@uu.nl)

                                   Received: 2 August 2018 – Discussion started: 11 September 201
                             Revised: 30 January 2019 – Accepted: 25 April 2019 – Published: 14 May 2019

       Abstract. Debris-covered glaciers in the Himalaya play an important role in the high-altitude water cycle.
       The thickness of the debris layer is a key control of the melt rate of those glaciers, yet little is known about
       the relative importance of the three potential sources of debris supply: the rockwalls, the glacier bed and the
       lateral moraines. In this study, we hypothesize that mass movement from the lateral moraines is a significant
       debris supply to debris-covered glaciers, in particular when the glacier is disconnected from the rockwall due to
       downwasting. To test this hypothesis, eight high-resolution and accurate digital elevation models from the lateral
       moraines of the debris-covered Lirung Glacier in Nepal are used. These are created using structure from motion
       (SfM), based on images captured using an unmanned aerial vehicle between May 2013 and April 2018. The
       analysis shows that mass transport results in an elevation change on the lateral moraines with an average rate
       of − 0.31 ± 0.26 m year−1 during this period, partly related to sub-moraine ice melt. There is a higher elevation
       change rate observed in the monsoon (−0.39 ± 0.74 m year−1 ) than in the dry season (−0.23 ± 0.68 m year−1 ).
       The lower debris aprons of the lateral moraines decrease in elevation at a faster rate during both seasons, probably
       due to the melt of ice below. The surface lowering rates of the upper gullied moraine, with no ice core below,
       translate into an annual increase in debris thickness of 0.08 m year−1 along a narrow margin of the glacier surface,
       with an observed absolute thickness of approximately 1 m, reducing melt rates of underlying glacier ice. Further
       research should focus on how large this negative feedback is in controlling melt and how debris is redistributed
       on the glacier surface.

1   Introduction                                                     to explain this spatial heterogeneity (Scherler et al., 2011;
                                                                     Gardelle et al., 2012; Kääb et al., 2012).
Glaciers cover approximately 110 000 km2 in high-mountain               Although the debris-covered area only constitutes 11 %
Asia (HMA) and as such constitute an important water stor-           of the total glacier area, 30 % of the ice mass below the
age of the region (Pfeffer et al., 2014; Immerzeel et al., 2010).    equilibrium line altitude (ELA) is covered with debris
The glaciers are likely to melt rapidly in the future, with pro-     (Kraaijenbrink et al., 2017). While a thin debris cover
jections ranging from a total mass loss of 36 % to 64 % in the       increases melt because it decreases albedo, debris thickness
coming century depending on the climate scenario (Kraai-             above a critical thickness inhibits melt (Östrem, 1959). The
jenbrink et al., 2017). While the entire HMA has experi-             surface of a debris-covered glacier is often characterized by
enced an overall glacier mass and area loss in recent decades,       ice cliffs and supraglacial ponds, which result in high local
the changes have been found to be variable in space (Bolch           melt rates (Immerzeel et al., 2014b; Steiner et al., 2015;
et al., 2012; Kääb et al., 2012; Brun et al., 2017). Apart           Thompson et al., 2016; Miles et al., 2017a). Knowledge
from differences in climate, the presence of debris with vari-       about actual debris thickness is limited to few field obser-
able thickness on the glacier tongues plays an important role

Published by Copernicus Publications on behalf of the European Geosciences Union.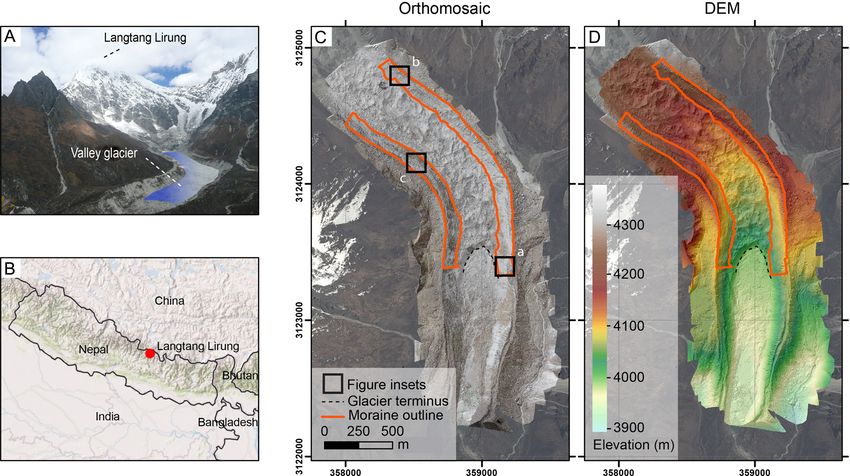
412             T. van Woerkom et al.: Sediment supply from lateral moraines to a debris-covered glacier in the Himalaya

vations (Nicholson and Benn, 2006; Ragettli et al., 2015;          buried ice cores can contribute as well (Ballantyne, 2013).
McCarthy et al., 2017) and attempts to derive it from thermal      The oversteepened upper parts may also be susceptible to
bands of satellite imagery (Mihalcea et al., 2008; Pfeffer         rockfall (Lukas et al., 2012) (Fig. 1Bc2). Eroded gully mate-
et al., 2014; Rounce and McKinney, 2014; Schauwecker               rial is deposited near the glacier margin as coalescing debris
et al., 2015; Rounce et al., 2018). Several studies suggest that   cones, which, together with rockfall and slumping, forms the
glaciers with prolonged periods of negative mass balance are       lower debris apron of the moraine. The material on these de-
associated with an increase in debris cover (Deline, 2005;         bris aprons is reworked by frost action, small landslides, de-
Mihalcea et al., 2006; Stokes et al., 2007; Shukla et al.,         bris flows, snow avalanches and solifluction (Fig. 1Bc3).
2009; Kirkbride and Deline, 2013; Gibson et al., 2017a).              During downwasting, the glacier surface becomes lower
Glaciers that have a neutral or positive mass balance, such        than the moraine crest, making lateral moraine slopes suscep-
as in the Karakoram in Pakistan, do not show any positive          tible to mass transport processes. As more and more of the
trends in debris-covered area (Herreid et al., 2015).              moraine slopes become exposed, a larger amount of moraine
   Not only is the debris-covered area variable, but the thick-    debris can be transported to the glacier surface and their rela-
ness also changes over time. A recent study on the Baltoro         tive contribution to the sediment budget will increase. This is
Glacier in Pakistan suggested that debris thickness changes        particularly the case for stagnating glacier tongues, where the
at rates of multiple centimetres per year with a maximum of        distal slope of the lateral moraine has the opposite aspect of
30 cm year−1 near the snout (Gibson et al., 2017a).                the adjacent valley slopes (Fig. 3). Due to glacier retreat and
   The source of supraglacial debris has been studied for          downwasting, the valley wall is disconnected from the actual
decades (Reheis, 1975; Boulton, 1978). Three potential             tongue. Material deposited below the ELA will furthermore
sources of supraglacial debris can be distinguished, which         remain at the glacier surface and add to the supraglacial de-
can be divided into direct and indirect sources. The direct        bris cover. Estimated rates of vertical lowering on the lat-
sources are basal erosion and bordering rockwalls. The indi-       eral moraines range from 49 to 151 mm year−1 for the Euro-
rect source is the lateral moraine, from which temporarily de-     pean Alps (Curry et al., 2006) and 3 to 169 mm year−1 for
posited debris is remobilized and transported (Fig. 1A). The       Norwegian field sites (Curry et al., 2006). On glaciers in the
relative contribution of these sources is variable but generally   study area (Langtang Valley in Nepal), a supply rate of 0.4–
depends on the amount and intensity of precipitation, glacier      31 mm year−1 (Watanabe et al., 1998) was previously found.
size, rockwall extent and erodibility of the bedrock and sed-      However, these values are averages over a much longer time
iments (Benn and Ballantyne, 1994; Benn and Owen, 2002).           span (< 550 years versus < 247 years for studies in Norway
In HMA, basal erosion (Fig. 1Aa) is likely only of limited         and < 79 for the Alps; Curry et al., 2006) or include source
relative importance, as the erosion processes on the steep         areas beyond the moraines (Watanabe et al., 1998). These
rockwalls and lateral moraines are highly active (Benn and         rates are nonetheless all much higher than rockwall erosion
Ballantyne, 1994; Benn and Owen, 2002). Bordering rock-            rates. All eroded material is deposited on debris cones (of-
walls have been observed to transport debris to the glacier via    ten on top of the glacier ice), which are intensely reworked
rockfall, rock avalanches and landslides as primary transport-     throughout the study period.
ing processes (Fig. 1Ab). These periodic events can be trig-          Previous studies only reported glacier-averaged erosion
gered by processes such as extreme rainfall or seismic events,     rates, although it is likely that the rates are spatially variable.
and are known to increase due to glacier melt and downwast-        We hypothesize that transport of remobilized debris from lat-
ing of the surface resulting in debuttressing and exposure of      eral moraines can explain the thick and continuous debris
unsupported strata (Soldati et al., 2004; Deline et al., 2014).    cover of tongues on downwasting debris-covered glaciers
   Generally, long-term rockwall erosion rates are on the or-      that have been disconnected from headwalls, in HMA. To
der of 1 mm year−1 (Heimsath and McGlynn, 2008). How-              this end, we use multi-annual, high-resolution orthomosaics
ever, the actual mass deposited on the glacier surface is more     and digital elevation models (DEMs) acquired using an un-
difficult to determine and varies from glacier to glacier, de-     manned aerial vehicle (UAV) to quantify surface lowering
pending on its exposure to rockwalls and geologic condi-           rates of the lateral moraines of a debris-covered glacier in
tions. The reworking of these deposits on the glacier surface,     Nepal. We attempt to explain the spatiotemporal variability
as a result of local hillslope geomorphology, surface melt,        and sediment transport processes using the terrain morphol-
glacier flow and englacial processes, may lead to small-scale      ogy and prevailing seasonal climates. Finally, we assess how
variations in debris cover as found in the Himalaya. In con-       important erosion from lateral moraines is in the formation
trast to transport from the rockwalls, which deposits material     of Himalayan debris-covered glaciers.
on specific locations, remobilization of lateral moraine de-
bris can result in a much more spatially uniform debris sup-
ply to the glacier (Fig. 1Ac). Lateral moraines typically have     2   Study area
a gullied upper part, where debris flows are the main trans-
port process (Curry et al., 2006) (Fig. 1Bc1). Most of these       The research was conducted on Lirung Glacier (28.23◦ N,
flows are released due to rainfall saturation, but the melt of     85.56◦ E), which is located in the Langtang Valley in the

Earth Surf. Dynam., 7, 411–427, 2019                                                    www.earth-surf-dynam.net/7/411/2019/
T. van Woerkom et al.: Sediment supply from lateral moraines to a debris-covered glacier in the Himalaya 413
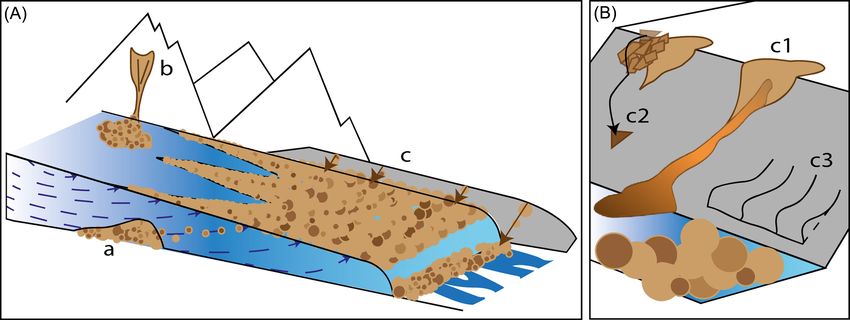
Figure 1. Schematization of debris supply processes towards the glacier surface (A), showing basal erosion (a), rockwall erosion (b) and
sediment supply from lateral moraines (c). Mass transport processes on a lateral moraine bordering the glacier (B), showing debris flows (c1),
rockfall (c2) and slow slumping (partly caused by the melt of sub-moraine ice) (c3).
Nepalese Himalaya (Fig. 2b). The glacier has a southern as- Table 1. Date of acquisition (in yyyy/mm/dd format) and area of
pect, steep rockwalls near the mountain crest and an almost the different datasets.
flat terminus. The lower part of the glacier is covered en-
tirely in debris (Fig. 4) and has been subject to strong down- Date Mapped area
wasting in recent decades (Immerzeel et al., 2014a; Nuimura (km2 )
et al., 2017). The study area is located between 3900 and 2013/05/18 2.04
4400 m a.m.s.l. (Fig. 2c, orange lines). In this section, debris 2013/10/22 3.25
from the valley rockwall cannot reach the glacier surface due 2015/10/18 2.61
to the opposite aspect of the distal moraine slopes (Fig. 3). 2016/04/30 1.97
The climate in the region is dominated by the monsoon, with 2016/10/06 2.70
a wet season between June and September in which 70 % of 2017/04/20 1.41
the annual precipitation falls. During the dry season between 2017/10/19 2.32
2018/04/28 2.12
November and May, considerably less precipitation reaches
the area and falls mostly as snow (Immerzeel et al., 2014b).
3 Data and methods Precipitation data were available from the meteorological
station at Kyanjing Village (28.21◦ N, 85.57◦ E) about 1.3 km
3.1 Field data south of the glacier in 2013. As data gaps are present between
2015 and 2018 for the Kyanjing station, the meteorologi-
Our observations of the lateral moraines of Lirung Glacier cal station in Langshisha (28.20◦ N, 85.67◦ E) about 13 km
span 2013 to 2018, consisting of images captured during south-east of the glacier was used for the remainder of the
multiple UAV flights with an optical camera. A structure period. Both rainfall intensities and the cumulative rainfall
from motion (SfM) workflow (Lucieer et al., 2014) is used between any two UAV time slices were analysed.
to derive three-dimensional (3-D) point clouds, which are
georeferenced by marking measured ground control points
(GCPs) and tie points. These operations finally result in co- 3.2 Deriving change in elevation
registered orthomosaics (0.1 m resolution) and DEMs (0.2 m
The DEMs were used to calculate vertical elevation differ-
resolution; for further details regarding measurements, pro-
ences between time steps. Two preprocessing steps were
cessing and data quality, see Kraaijenbrink et al., 2016). De-
taken. First, vegetated areas were selected using a maximum
tails about the mapped part of the glacier for each UAV cam-
likelihood supervised classification applied to the orthomo-
paign are provided in Table 1. The mutually overlapping area
saic and masked out of the DEMs, to remove noise related to
of all datasets covers 1.5 km2 of the glacier tongue including
vegetation growth and decay. Second, as the off-glacier and
the moraines. The accuracy of all generated DEMs is tested
off-moraine terrain did not show signs of sediment transport
by comparing the differences between DEM and GCPs.
during the investigated time span, these areas are assumed to
be stable. Therefore, the DEMs were corrected for elevation
changes in off-moraine and off-glacier terrain. To avoid bias
towards possible errors in the DEM, we removed the outliers
outside the 10–90th percentile range, while making sure to
www.earth-surf-dynam.net/7/411/2019/ Earth Surf. Dynam., 7, 411–427, 2019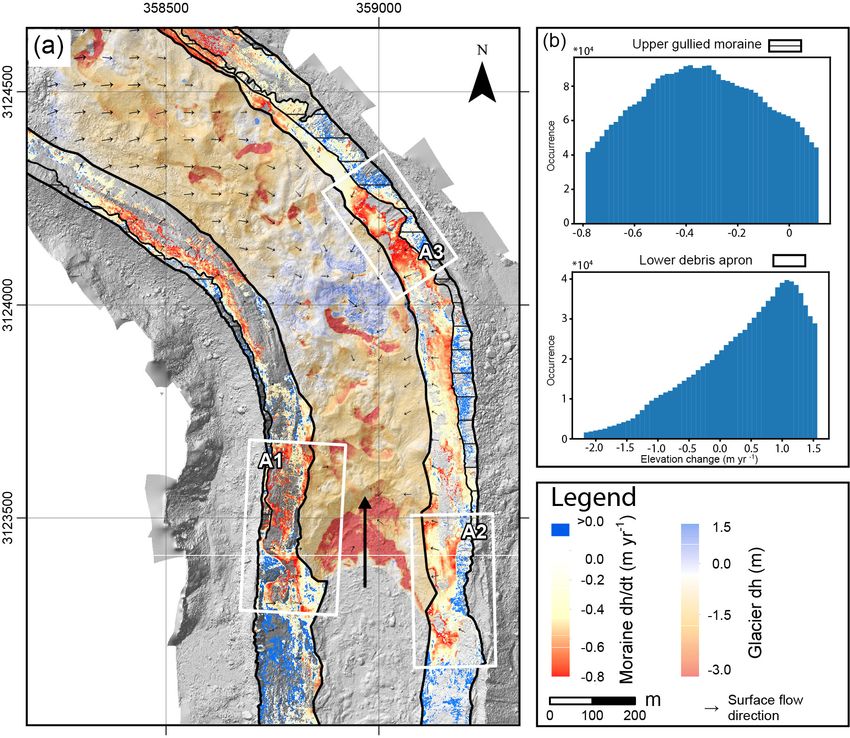
414              T. van Woerkom et al.: Sediment supply from lateral moraines to a debris-covered glacier in the Himalaya

Figure 2. Study area including the setting (A), location of the study area (B) and two more detailed overviews including the orthomosaic
and elevation data of the study area (C, D; from UAV flights in October 2015). The glacier terminus and studied section of the moraine are
outlined on these maps. The black squares in panel (C) indicate the location of Figs. 5 (a), 6a (b) and b (c).

Table 2. Extreme values below and above which the data are re-         3.3   Analysis of surface properties
moved from the original dataset, as well as the mean of the whole
dataset (µ).                                                           The orthomosaics were analysed visually to examine patterns
                                                                       of erosion and deposition, and compared against elevation
 Dataset (yyyy/mm)             µ   10th percentile   90th percentile   differences. Furthermore, the displacement, slope and rough-
                             (m)              (m)               (m)    ness of the lateral moraines were derived from the DEMs. We
 2013/05–2013/10 (wet)     −0.39           −2.07               1.18    employed the COSI-Corr software for cross-correlation fea-
 2015/10–2016/04 (dry)     −0.17           −1.06               0.72    ture tracking to calculate the displacement of debris on the
 2016/04–2016/10 (wet)     −0.34           −1.47               0.87    lateral moraines (Leprince et al., 2007; Kraaijenbrink et al.,
 2016/10–2017/04 (dry)     −0.36           −1.11               0.37    2016). As this software focuses more on block movement
 2017/04–2017/10 (wet)     −0.52           −2.16               1.11
 2017/10–2018/04 (dry)     −0.22           −0.88               0.13
                                                                       than on individual clast displacement (Leprince et al., 2007),
 2013/05–2018/04 (total)   −0.31           −0.31               0.79    correlating displacement with elevation change gives insight
                                                                       in slower slope processes such as creep or slow slumping,
                                                                       which often occur on a scale large enough to be detected by
retain large elevation change events related to debris flows           COSI-Corr. Fast events that travel beyond our chosen maxi-
and rockfall (Table 2). Finally, the glacial elevation change          mum window size of 26.5 m are registered by the algorithm
over the entire period (2018–2013) is determined for a 20 m            as noise and hence do not bias our average velocities on the
wide zone next to the proximal slope of the moraine, which is          moraine. Slope maps are created directly from the DEM. Fol-
an indication of the glacial melt underneath the debris apron.         lowing Nield et al. (2013), the roughness length z0 (m) was
When taking these corrections into account, the difference in          derived by
elevation between two time steps was assumed equal to the
                                                                       ln(z0 ) = 0.65 + 1.37 ln(σz ),                                 (1)
amount of sediment transport.
                                                                       with σz defined as the standard deviation of a 5 × 5 m win-
                                                                       dow of a detrended DEM. Although the window size greatly
                                                                       influences the roughness, a window of 25 m2 is suitable for
                                                                       this approach (Miles et al., 2017b). For each window, a high

Earth Surf. Dynam., 7, 411–427, 2019                                                         www.earth-surf-dynam.net/7/411/2019/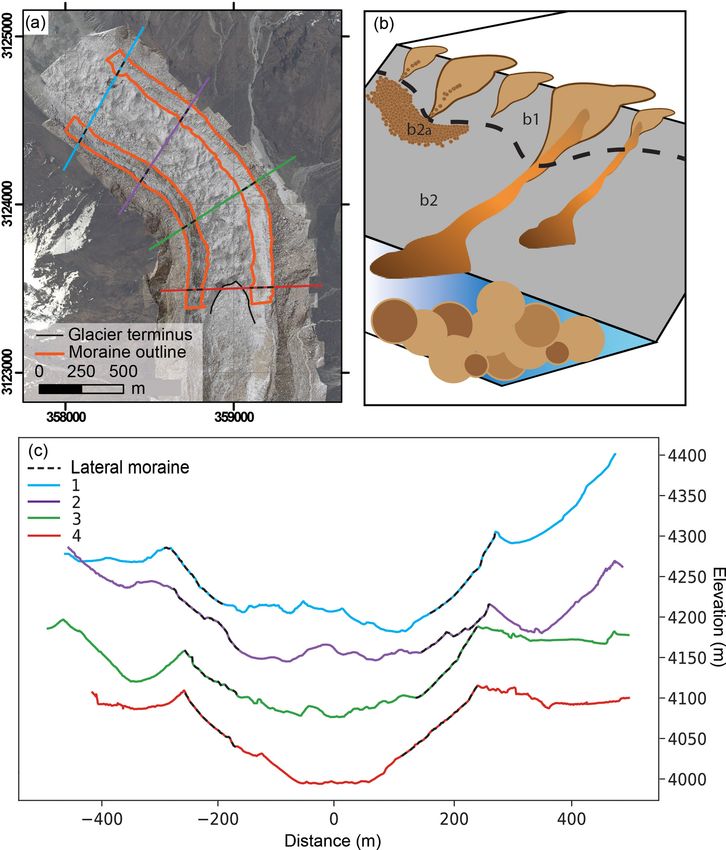
T. van Woerkom et al.: Sediment supply from lateral moraines to a debris-covered glacier in the Himalaya                                    415

                                                                           Figure 4. Field images of Lirung Glacier from the upper part (a),
Figure 3. Cross sections over the glacier and moraine, with their          where the rockwalls are still connected to the glacier, along the mid-
locations (a) and corresponding elevation profile (c). They clearly        dle disconnected part (b) to the lower glacier tongue (c), where the
indicate that the distal slope of the moraine has an opposite aspect to    decoupling is clearly visible. Also note the mass movements from
the proximal slope, due to which there is no debris input from higher      the upper slopes (b) that do not reach the glacier.
slopes and rockwalls in the valley. In panel (b), the different sections
of the moraine are indicated, with the upper gullied part (b1), the
debris apron or coalescing debris cones (b2) and the smooth section
of the debris apron interpreted as gully washout deposition (b2a).

roughness value indicates larger topographic variation, such
as boulders, while a small value indicates a more homoge-
neous surface (Miles et al., 2017b).

3.4   Moraine delineation

The DEM and orthomosaic, as well as their derivatives, were
used to delineate the lateral moraines and divide them into
zones with comparable characteristics. The moraine base is
often characterized by a break in slope (Figs. 4, 5b). Further-            Figure 5. Moraine delineation method. The crest is often well de-
more, a hillshade with a hummocky appearance is an indi-                   fined by the orthomosaic (a) and slope (b). An intermediate zone
cator for sub-debris ice (Lukas et al., 2012), and these ar-               with gully surface wash deposition is clearly visible from the rough-
eas are thus excluded from the moraine. Within the lateral                 ness data (c). The moraine consists of an intensely gullied upper
moraine two main zones were distinguished: an intensively                  part (right) and a lower debris apron consisting of coalescing debris
gullied upper part (Curry et al., 2006) and a lower part that              cones (left). See Fig. 2 for location.
consists mainly of reworked debris, usually in the form of
coalescing debris cones (Figs. 2, 4, 5a), as also described
by Ballantyne (2013). Although not distinguishable every-                  mosaic. We interpret this part of the coalescing cones as the
where, a zone with fine material was detected directly below               deposition zone of surface wash from the gullies upslope.
the gullied upper part, accompanied by a very low roughness
(Figs. 3b, 5c). The smoothness is also visible on the ortho-

www.earth-surf-dynam.net/7/411/2019/                                                              Earth Surf. Dynam., 7, 411–427, 2019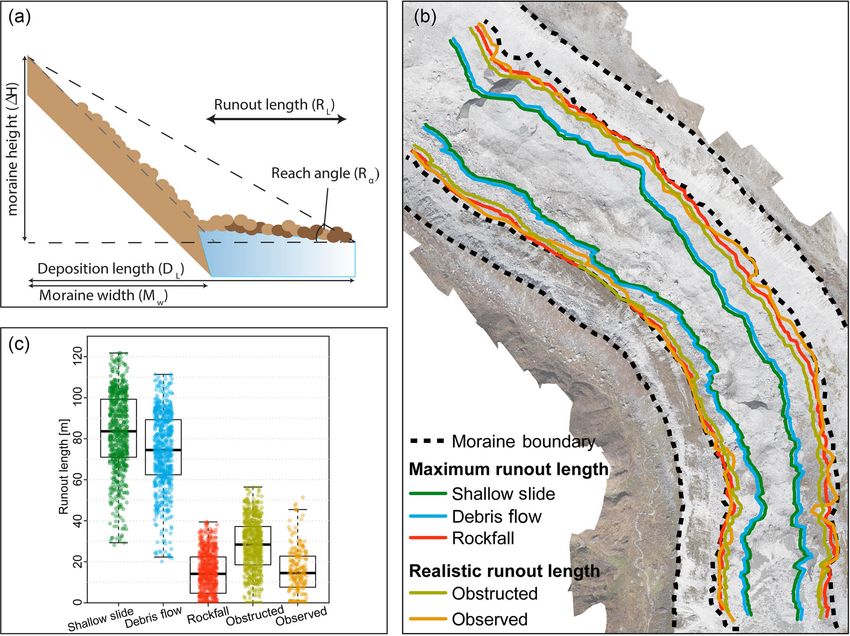
416             T. van Woerkom et al.: Sediment supply from lateral moraines to a debris-covered glacier in the Himalaya

3.5    Runout model                                               the centre of the tongue. If the lateral moraine indeed is an
                                                                  important source of debris, clast roundness is expected to de-
To investigate the importance of the lateral moraines as a
                                                                  crease from the lateral moraine towards the glacier centre,
source for supraglacial debris, we used a simple model to cal-
                                                                  as the influence of the lateral moraine diminishes and ma-
culate how far moraine material can travel onto the glacier.
                                                                  terial transported from further upglacier becomes dominant.
The model is based on the reach angle principle. The reach
                                                                  The clast analysis was conducted by investigating 70 indi-
angle is the angle between the origin and maximum reach
                                                                  vidual samples of debris. For each of the locations, on aver-
of a mass movement and has a range between 3 and 45◦
                                                                  age 46 (σ = 25) clasts were analysed. The roundness is de-
(Evans and Hungr, 1993). For debris flows, the reach an-
                                                                  termined based on the commonly used chart from Powers
gle is generally between 26 and 34◦ (De Haas et al., 2015).
                                                                  (1953), which results in a percentage of clasts for each sam-
These variations are mainly caused by differences in pro-
                                                                  ple that are angular or very angular (RA index). For 13 sam-
cesses, but the volume of the mass wasting is also important
                                                                  ples, the axis length of each clast was measured, allowing us
(Dai and Lee, 2002). Taking both process and volume into
                                                                  to determine the so-called C40 , which is the 40th percentile
account, minimum reach angles for rockfall, shallow slides
                                                                  ratio of short to long axes (c/a) in a sample. Actively trans-
and debris flows are found to be 33◦ (with a volume of 100–
                                                                  ported clasts are more likely to have low C40 and RA values,
1000 m3 ), 23◦ (800–2000 m3 ) and 22◦ (800–2000 m3 ), re-
                                                                  in contrast to clasts that experienced passive transport (Lukas
spectively (Corominas et al., 2003). Reach angles decrease
                                                                  et al., 2013). It has to be taken into account that both the C40
for values beyond these ranges and increase for smaller vol-
                                                                  and RA indices decline downglacier (Benn and Ballantyne,
umes.
                                                                  1994) and that differences in lithology result in different in-
   The runout length RL (m) from the lower moraine bound-
                                                                  dex values (Lukas et al., 2013). However, the latter will be of
ary was calculated as
                                                                  minor importance as the debris catchment is relatively small
         1H                                                       and homogeneous in lithology (Macfarlane et al., 1992).
RL =            − Mw ,                                     (2)
       tan(Rα )
where 1H is the difference in elevation between the start and     4     Results and discussion
deposition location (m), Rα (◦ ) is the reach angle (Fig. 9a),
and Mw is the planar moraine width (m). To derive the max-        4.1    Observed surface lowering rates
imum runout length, it was assumed that the start location of
                                                                  The mean elevation change rate of the non-vegetated
the mass transport is at the moraine crest, though in reality
                                                                  moraine between May 2013 and April 2018 equals −0.31 ±
they may start from anywhere inside the gullied zone (Curry
                                                                  0.26 m year−1 (Table 3). Most elevation change occurs on
et al., 2006).
                                                                  the lower moraine, consisting of extensively reworked co-
   As the minimum reach angles were used and since we
                                                                  alescing debris cones, at a rate of approximately −0.41 ±
assume the moraine crest as a starting point, the calculated
                                                                  0.21 m year−1 . The glacier downwasting near the debris
runout length RL indicates the furthest inward point on the
                                                                  apron occurred at a rate of −0.60 ± 0.45 m year−1 , which
glacier that debris can directly be transported to. Due to a
                                                                  indicates a deposition rate of +0.19 m year−1 on the apron,
decrease in mass movement velocity after the abrupt slope
                                                                  assuming a similar downwasting rate below the apron.
change on the glacier–moraine boundary, the amount of de-
                                                                  The upper gullied part on average has a surface lower-
bris deposition is expected to be highest close to the moraine
                                                                  ing rate of −0.16 ± 0.26 m year−1 . Debris remobilization on
and will decrease rapidly with distance. To validate this esti-
                                                                  other moraines that formed during recent glaciations gener-
mated runout length, the actual runout length is determined
                                                                  ally have lower elevation change rates than those observed
by detecting depositional features such as debris flow lobes
                                                                  on the gullies in this study but also peaked at approxi-
and rockfalls, and measuring their distance to the moraine
                                                                  mately −0.15 m year−1 (Curry et al., 2006), with Ballan-
edge.
                                                                  tyne and Benn (1994) noting their rates between −0.01 and
                                                                  −0.02 m year−1 to be minimum rates. The high gully ero-
3.6    Clast analysis                                             sion rates found are indicative of rapid surface change on
Model results were validated by performing a clast analy-         steep lateral moraines above downwasted glacier tongues
sis, which is used to distinguish between actively transported    during deglaciation and debuttressing. The vertical accuracy
clasts and those that are mostly affected by weathering and       of the dataset is determined by calculating DEM differences
reworking in rapid mass movement events (Lukas et al.,            for off-glacier terrain for all datasets. The total offset is
2013) and passively transported by the glacier. Moraine-          −0.05 ± 0.84 m over an area of 1.6 km2 . Although the offset
derived debris is assumed to have already been actively           varies from −0.04 ± 0.70 to 0.12 ± 0.66 m between the dif-
transported by the ice during moraine formation, when the         ferent time steps, it is at any time smaller than the observed
subglacial sediment was being deformed. Therefore, it has         surface lowering rates (Table 4).
a higher roundness than passively transported rockwall-
derived debris, which is expected to be more dominant in

Earth Surf. Dynam., 7, 411–427, 2019                                                  www.earth-surf-dynam.net/7/411/2019/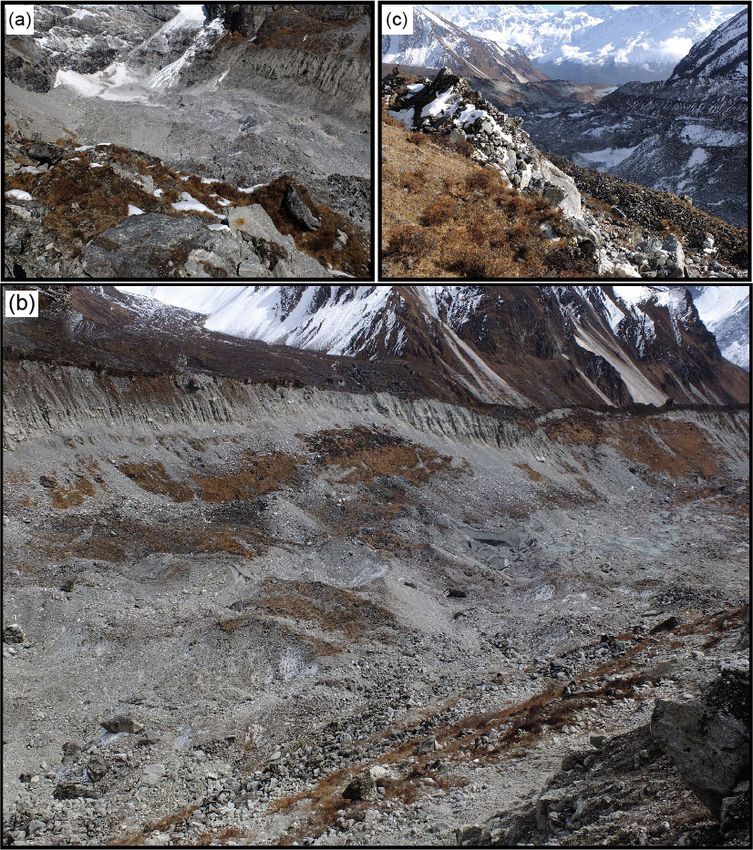
T. van Woerkom et al.: Sediment supply from lateral moraines to a debris-covered glacier in the Himalaya 417
Table 3. Seasonal elevation change values, furthermore divided into upper and lower moraine. The zonal mean (µ) is reported, as well as
the 1σ standard deviation (σ ). Precipitation is measured at Kyanjing station in 2013 and Langshisha station in all others seasons. Elevation
change values are in m year−1 , precipitation values in mm and mm h−1 . The significance column (sig) indicates the periods from which that
specific dataset statistically differs (p < 0.05).
Entire moraine Gullied upper part Debris apron Precipitation
Period Dataset (yyyy/mm) µ σ Sig µ σ Sig µ σ Sig Cumulative Mean
intensity
1 2013/05–2013/10 (wet) −0.39 0.79 all −0.28 0.77 all −0.41 0.83 2, 4–6 697 0.90
2 2015/10–2016/04 (dry) −0.17 0.44 all −0.07 0.43 all −0.21 0.44 all 145 0.62
3 2016/04–2016/10 (wet) −0.34 0.57 all −0.14 0.55 all −0.41 0.59 2, 5–6 584 0.58
4 2016/10–2017/04 (dry) −0.36 0.37 all −0.24 0.37 all −0.41 0.36 1–2, 5–6 172 0.84
5 2017/04–2017/10 (wet) −0.52 0.84 all −0.19 0.82 all −0.60 0.82 all 541 0.58
6 2017/10–2018/04 (dry) −0.22 0.98 all −0.12 0.98 all −0.25 1.00 all 117 0.50
7 2013/05–2018/04 (total) −0.31 0.26 all −0.16 0.26 all −0.41 0.21 2, 5–6 2257 0.67
Table 4. Off-glacier elevation differences on stable terrain. These
differences can be seen as the vertical accuracy of that specific
dataset. Values are in metres.
Dataset (yyyy/mm) µ σ
2013/05–2013/10 (wet) −0.04 0.44
2015/10–2016/04 (dry) −0.03 0.74
2016/04–2016/10 (wet) 0.12 0.66
2016/10–2017/04 (dry) −0.02 0.69
2017/04–2017/10 (wet) −0.04 0.70
2017/10–2018/04 (dry) 0.08 0.93
2013/05–2018/04 (total) −0.05 0.84
4.2 Mass transport mechanisms and processes
Our data enable us to differentiate between different trans-
port mechanisms, which can be divided into three main cat-
egories: erosion due to running water (entrainment and de-
bris flows), larger mass movements (slumps and rockfall)
and slower downslope processes (for example, slow slump-
ing). Despite the stability of inter-gully arêtes on the upper
moraine, the gullied topography indicates the importance of
flow erosion processes. Debris flows and sediment loaded
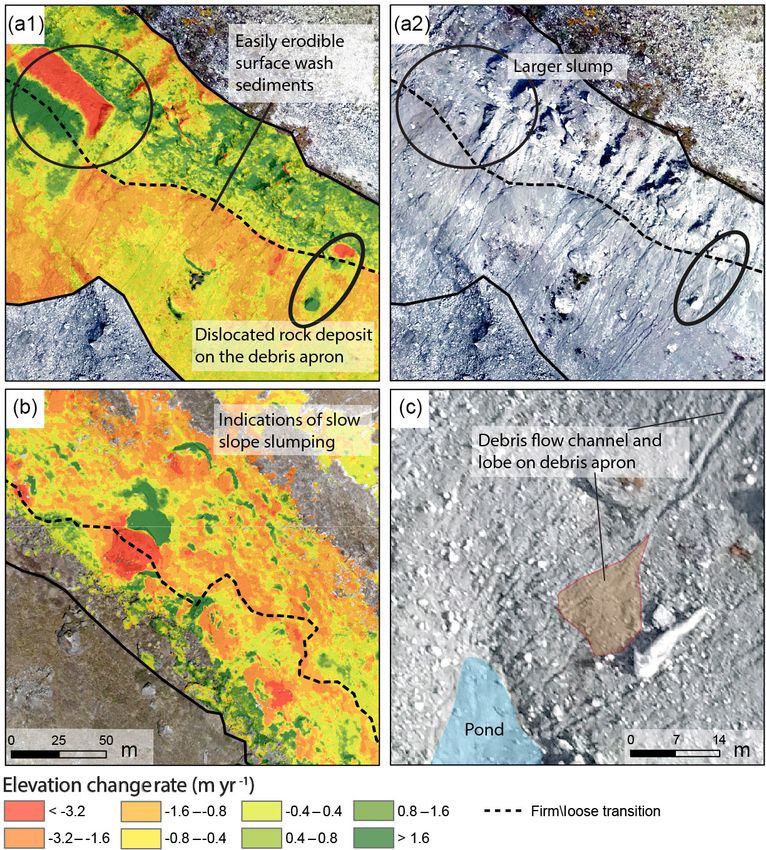
streams originate here mostly in the wet season, when there Figure 6. Different types or mass transport processes. Fast mass
is frequent rainfall, often with high intensity (Table 3). Rela- movements as slumps and rockfall occur on the moraine (a1, a2) as
tively high rates of surface lowering can be found just below well as water-driven movement as water flow and debris flows (c).
the gullies, which might be related to the presence of easily Furthermore, the slopes are slumping down slowly (b), which is
erodible surface wash deposits (Fig. 6a). The fact that these clearly visible by the alternation of positive (rocks moving in) and
negative (rocks moving out) elevation change values. See Fig. 2 for
higher rates can be found below more intensely gullied up-
location.
per sections supports this. Another possibility is that these
higher rates are caused by a steep scarp of fresh-looking till
which commonly forms at the very base of the eroding till
cliff. This scarp may be caused by the separation of the debris Further down, the debris apron the slope decreases and
apron from the gullied upper section as a result of sub-apron depositional features are observed, mostly related to debris
glacial downwasting. However, no such sharp step is visible flows, as distinct levees along a central flowpath and lobe-
on the orthophotos, keeping the exact origin unclear. like features (Fig. 6c). Frequently observed grain diameters
of > 40 cm on the debris apron furthermore indicate the im-
portance of debris flows over water flows (Iverson, 1997), as
www.earth-surf-dynam.net/7/411/2019/ Earth Surf. Dynam., 7, 411–427, 2019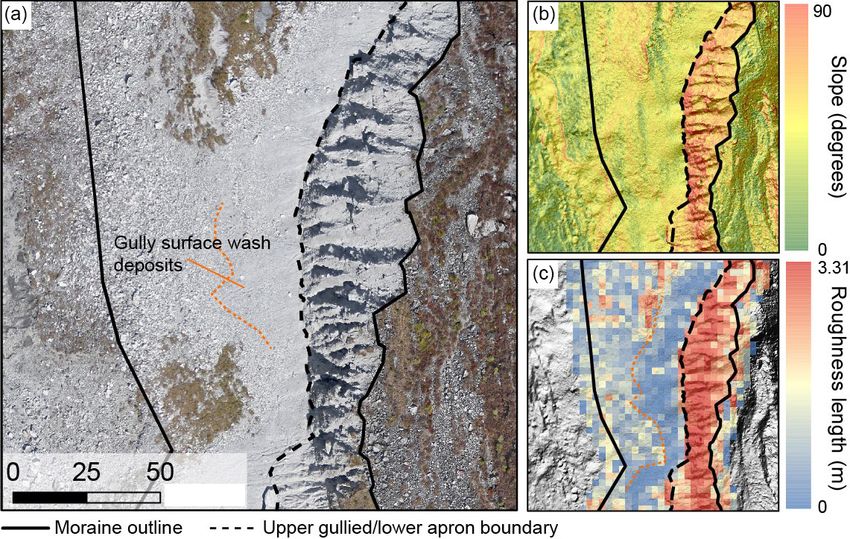
418             T. van Woerkom et al.: Sediment supply from lateral moraines to a debris-covered glacier in the Himalaya

debris flows, in contrast to water alone, are able to transport    dicates the importance of water-driven erosion and slumping
boulders of such a dimension. Nonetheless, many smaller            (Table 3).
channels show the importance of water flows for further re-           The upper gullied moraine experiences less change
working the sediment. Together with debris flows that cover        throughout the dry season, but its high seasonal differences
the debris apron, water flow reworks the debris and transports     indicate its sensitivity to precipitation changes, which affect
material onto the glacier. However, due to the large elevation     debris flow probabilities. During the dry season from 2016
loss on the near moraine glacier, it is likely that there is net   to 2017, when surface lowering of the gullied part was espe-
deposition on the debris aprons, and only a limited amount of      cially high, both the total precipitation as well as the intensity
debris is transported further onto the glacier. This is in line    were considerably higher. An increase of debris-flow-related
with the matching gully erosion rates (−0.16 m year−1 ) and        landforms after the wet season co-occurs with the larger neg-
approximate debris apron deposition rates (+0.19 m year−1 ).       ative elevation change that was observed on the gullied up-
The steep gullied upper slopes are also susceptible to larger      per part. Larger slumps and rockfall from this section were
mass movements, such as the occurrence of slumps and rock-         not limited to a single season, as they are mostly triggered
falls. These processes are enhanced by oversteepening of the       by a single rainfall event rather than by continuous wetting.
slope and cause locally high (> 2 m) erosion rates (Fig. 6a1).     Surface wash deposits below the gullies can also be seen
One large slump event was captured in our data (Fig. 6a1–          throughout the wet and dry seasons, as is the case for slow
a2), deposited mostly on the debris apron, where its loose         slumping of the debris apron. Nonetheless, the rate of move-
material is susceptible to continued reworking. The debris         ment was much faster during the wet summer season, as a
apron of the moraine is partly eroded by water flow but            larger loading and a decrease of shear strength may cause the
also moves downslope as a whole as the glacier ice be-             moraine to slump faster as a result of buried ice melt (Cai
low melts (Fig. 6b). There is a horizontal displacement to-        and Ugai, 2004). Although the exact nature of this process is
wards the glacier of 0.93 m year−1 , with a 90th percentile of     yet unclear and needs further investigation, it is clear that this
2.01 m year−1 . This is in the range of movement by solifluc-      does contribute substantially to the downslope movement of
tion and that of rock glaciers (Matsuoka, 2001; Frauenfelder       moraine debris.
et al., 2005). Despite the fact that the local climate would          Beyond precipitation, freeze–thaw cycles could also play
favour solifluction (Gruber et al., 2017), it is unlikely to be    a role in driving erosion, with erosion increasing as moraine
the main transporting mechanism as velocities speed up in          slopes warm up seasonally after the dry winter season and
summer. The lateral displacement is also higher than those         diurnally through the rest of the year.
typically related to creep of unfrozen debris (Kirkby, 1967);
thus, it is most likely caused by slow slumping of the debris      4.4   Towards a conceptual lateral moraine mass
apron. Although its contribution to surface lowering is un-              transport model
clear, this process does result in a steady debris supply to the
glacier.                                                           The steep intensely gullied upper part of the moraine had
                                                                   lower elevation change rates (−0.16 m year−1 ) than the
4.3   Temporal patterns in surface lowering
                                                                   lower debris apron part (−0.41 m year−1 ) (Fig. 6). However,
                                                                   with a glacial melt rate of −0.60 ± 0.45 m year−1 there is net
Moraine surface lowering occurs throughout the year, and           deposition on the debris apron. This is in line with other
a significant difference was observed between the wet              studies that indicate that post-deglaciation the steep upper
(−0.39 ± 0.74 m year−1 ) and dry (−0.23 ± 0.68 m year−1 )          slopes get rapidly deprived of their loose sediment (Ballan-
seasons. Elevation change rates ranged from −0.34 ± 0.57 to        tyne, 2013; Curry et al., 2006). This would suggest higher
−0.52 ± 0.84 m year−1 in the wet season and −0.17 ± 0.44           erosion rates on the upper moraine part in the past, and this
to −0.36 ± 0.37 m year−1 in the dry season. This differ-           hypothesis is supported by the large amount of deposited ma-
ence is caused by heavier precipitation during the summer          terial below. Currently, erosion still occurs in the gullies, al-
months (540–700 mm) compared to the winter months (117–            beit at a lower rate, and gully surface wash deposition just
145 mm) in addition to higher glacial melt rates of −0.76 ±        below the gullies fills the gaps between the larger boulders
0.73 m year−1 and −0.57 ± 0.45 m year−1 , respectively. On         and decreases the surface roughness locally (Fig. 5c). These
the upper gullied moraine, erosion rates were highly variable      finer-grained deposits are susceptible to reworking by water
between the dry and wet seasons (−0.07 ± 0.43 to −0.28 ±           flow (van Rijn, 1984).
0.77 m year−1 ) but generally lower than rates on the debris          Debris flows originating in the upper gullies both deposit
apron of the moraine (−0.25±1.0 to −0.60±0.82 m year−1 ).          and entrain material on the coalescing debris cones that form
The remarkably high elevation loss on the debris apron dur-        the lower part of the moraine. In addition, mass transport on
ing the wet season is mostly linked due to high glacier melt       this section of the moraine is caused by a slower slumping
rates in the summer season. In addition, more active mass          process in the wet season, which moves down the moraine
transport processes were observed in the wet seasons, con-         as a block. During the wet summer, when surface displace-
tributing to the higher surface lowering rates. This also in-      ment rates are on average > 1 m year−1 , higher velocities co-

Earth Surf. Dynam., 7, 411–427, 2019                                                    www.earth-surf-dynam.net/7/411/2019/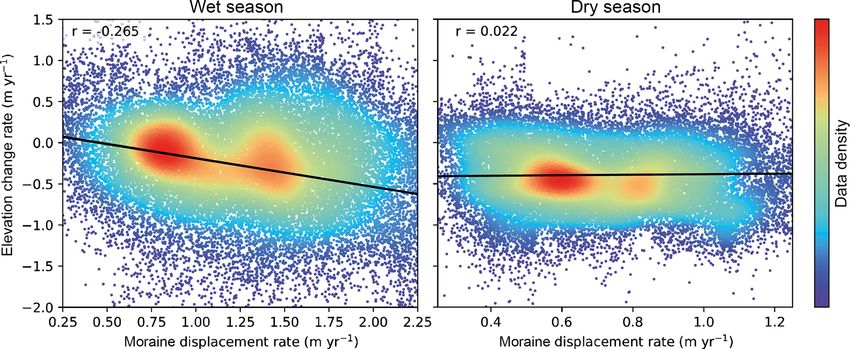
T. van Woerkom et al.: Sediment supply from lateral moraines to a debris-covered glacier in the Himalaya                                   419

Figure 7. Downwasting of the glacier surface between May and October 2013 (Immerzeel et al., 2014a) and surface flow direction (Kraai-
jenbrink et al., 2016) compared to elevation change on the moraines (a). Insets (A1), (A2) and (A3) show hotspots of surface lowering.
Small black arrows show surface motion, either by active debris transport or passive transport imposed by the glacier velocity. The arrow
size indicates exaggerated intensity of velocity, as velocities on the moraines (mean: 0.89 m year−1 ) are far smaller than on the upper glacier
(mean: ∼ 6 m year−1 ). The long black arrow shows retreat of the terminus between 2013 and 2018 (∼ 150 m). Blank areas are either outside
the study area, vegetated or outside the 10–90th percentile range. Panel (b) shows the histograms of the elevation change on the upper gullied
section and lower debris apron over the entire studied period (2018–2013).

incide with a more negative elevation change, possibly re-                seasons, which indicates the absence of sub-moraine ice in
lated to the melt of ice underneath (Fig. 8). In the dry win-             these parts and the absence of a slumping process. As these
ter season, displacement rates are lower (< 1 m year−1 ) and              displacements can be linked directly to a slumping process,
do not show a correlation with elevation change, indicat-                 they can easily be used to indicate areas of active mass trans-
ing a smaller importance of slow slumping processes. This                 port on lateral moraines.
is remarkable considering the still relatively high melt rates               It is difficult to quantify the importance of fast processes
(−0.57±0.45 m year−1 ). The slumping might be enhanced in                 such as debris flows, rockfall of individual large boulders
close proximity of areas of high glacier ice mass loss, as the            and landslides on the moraine. However, the intensely gul-
ice thins vertically but also recedes laterally (Fig. 7). These           lied upper part prevents large flows from occurring. Though
slump deposits may be identified on the moving glacier as                 rockfalls and a single slump are observed, they are infrequent
positive surface elevation change due to the dispersal of                 and occur at a small scale (Fig. 6). As a result, large infre-
the deposited slump sediments (Fig. 7b). The gullied upper                quent events are of minor importance for the lateral moraine-
moraine did not show any horizontal displacement over both                derived sediment budget on this glacier.

www.earth-surf-dynam.net/7/411/2019/                                                              Earth Surf. Dynam., 7, 411–427, 2019
420              T. van Woerkom et al.: Sediment supply from lateral moraines to a debris-covered glacier in the Himalaya

Figure 8. Relation between elevation change and moraine velocity in the wet and dry seasons. In the wet season, high velocities occur
with higher surface lowering rates. Debris apron displacement is likely caused by a slumping movement due to sub-apron ice melt. No such
relation exists in the dry season.

   The importance of frost action for supplying detachable            ble explanations for this. First, many mass movements might
sediments can also not be directly derived from the DEM               have a smaller volume than the 800–2000 m3 range used in
differencing. However, with surface temperatures well below           the calculation, which reduces the runout length (Coromi-
freezing level for a long time in winter, as evidenced by field       nas et al., 2003; Rickenmann, 2005). Second, the rough sur-
measurements, the formation of ice crystals is likely. These          face on the glacier obstructs the runout path and decreases
may detach sediments that can easily be removed afterwards.           runout length substantially (Corominas et al., 2003; Miles
No debris flows or landslides were originated on this part;           et al., 2017b). Using a smaller volume (< 800 m3 ) and an
hence, it is most likely that mass transport on the lower part        obstructed path, the reach angle of debris flows and shallow
was triggered by water and debris flows that originated in the        slides decreases to 30◦ , which results in a maximum runout
upper gullies. The coalescing debris cones that make up the           length of 56 m, much closer to the observed length of 51 m
lower part of the lateral moraine along this glacier are con-         (Fig. 9b). Nonetheless, both the calculated and measured
stantly reworked, as debris flows, water flow and slow slump-         runout lengths indicate that debris from the moraine can-
ing transport material to the glacier. However, net deposition        not directly reach the centre of the glaciated surface, which
takes place from the gullies above, in contradiction to what          is approximately 200 m from the moraine. Rough calcula-
the elevation change rates suggest. The continuous glacial            tions of required reach angles for moraine-derived debris to
melt also constantly increases the sediment accommodation             reach the centreline on other glaciers in the catchment, based
space, resulting in less debris to reach the glacier surface.         on the mean moraine prominence (Miles et al., 2016), show
                                                                      that this is likely true there as well. For the largest glacier,
                                                                      Langtang, the reach angle becomes 6◦ , while for the second
4.5   Debris distribution onto the glacier
                                                                      largest, Langshisha, it is 18◦ . Due to differences in valley
The main processes (debris flow, shallow slides, rockfall) de-        shape and moraine size, very different rates of relative cov-
scribed above were included in the model to calculate on-             erage by moraine-derived debris are however possible. Due
glacier debris deposition.                                            to an increasing elevation range between the moraine crest
   Using a specific reach angle for each process, the maxi-           and glacier tongue, the runout length has increased over time.
mum runout length on the glacier is 39 m for rockfall, 111 m          The debris currently found at the glacier’s centreline has
for debris flow and 122 m for shallow slides (Fig. 9b). The           either moved there by secondary processes such as glacier
runout length is not equal along the glacier, as a result of          movement and on-glacier sliding, or originated from other
differences in moraine elevation and the hummocky glacier             sources, e.g. rockwalls (Benn and Owen, 2002) or basal de-
surface (Fig. 9c). The observed runout length is manually de-         bris, (re-)emerging at the glacier surface towards the tongue
rived from the imagery and has a maximum of 51 m, which               (Boulton, 1978; Wirbel et al., 2018). This result also indi-
suggests rockfall as the most important process, closest to           cates that the proportion of moraine-derived supraglacial de-
this value. As rockfalls were not observed to be the most im-         bris increases as the glacier downwastes. The formation of
portant process on the moraine, this difference also indicates        a fully lateral moraine-derived debris cover is more likely
that debris flows and small slumps possibly occurred with             in the case of upstream medial moraine formation by con-
smaller runout lengths than modelled. There are two possi-            fluencing glaciers, from which secondary dispersal mecha-

Earth Surf. Dynam., 7, 411–427, 2019                                                       www.earth-surf-dynam.net/7/411/2019/
T. van Woerkom et al.: Sediment supply from lateral moraines to a debris-covered glacier in the Himalaya 421
Figure 9. Conceptual diagram of model approach (a), the modelled runout lengths (b) and the modelled variability in runout lengths (c).
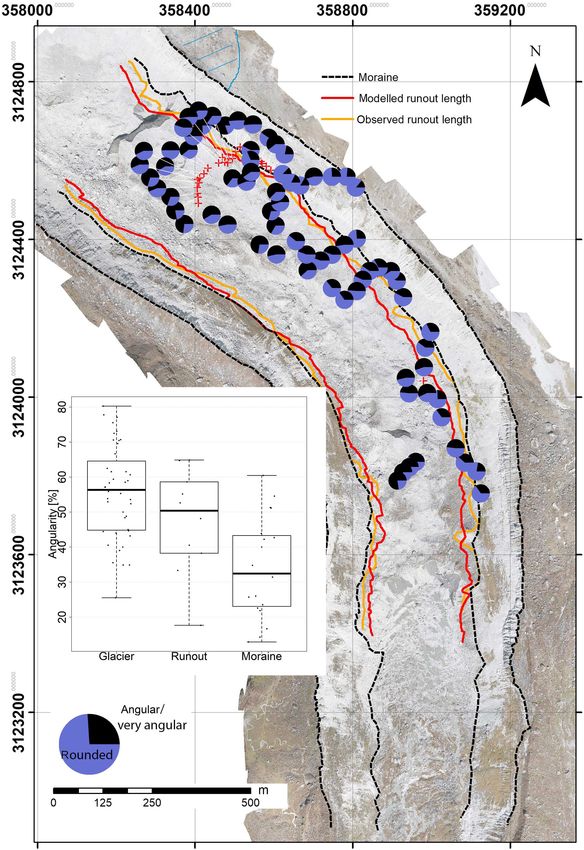
nisms may form a supraglacial debris cover (Kirkbride and modelled runout length have an RA index higher than 50 %,
Deline, 2013). Furthermore, advancing glaciers will have lit- closer to the RA index of the samples in the centre of the
tle moraine-derived input due to a lack of extensive lateral glacier. This may indicate that the modelled runout length
moraine slopes. is an upper maximum and debris from the moraines rarely
reaches this far, which is in line with the observed runout
length being shorter and the limited debris supply due to de-
4.6 Clast analysis position on the debris apron.
The locations of the clast samples are shown in Fig. 10. The
C40 index is relatively low (0.2 to 0.48), while the rounded 4.7 Consequences for debris thickness, terminus retreat
and very rounded fractions of the investigated sample are less and glacier downwasting
than 6 % on average, indicative of angular clasts. Looking at
the angular and very angular fractions, the RA index provides Debris-covered tongues are schematized with a convex–
a stronger indication of transport processes (Fig. 10). The concave upglacier thickness pattern, causing lower tongues
RA index on the moraine is on average just above 30 %, sug- to be covered in thick debris that causes debris-covered
gesting a dominance in more rounded samples. This is due tongues to stagnate (Anderson et al., 2018; Watson et al.,
to their previous transport path along the glacier bed before 2016; Kirkbride, 2000; Kirkbride and Deline, 2013). This
they were deposited along the moraine. Values are decreas- can be explained with debris accumulating continuously at
ing downglacier, corresponding to findings in Benn and Bal- the snout at higher rates than it can be evacuated (Fig. 11a2).
lantyne (1994), indicating that englacially transported and Moraine-derived debris can not be directly deposited over
moraine-derived debris becomes dominant. Higher RA in- the complete width of the tongue (Fig. 11a1), although sec-
dices on the moraine are found only where the moraine is still ondary processes may be capable to further distribute it
connected to the rockwall (Fig. 10). Clast samples in the cen- across the glacier. However, to get a first-order estimate of
tre of the glacier have a much higher RA index, > 50 %, as its potential relative contribution to the thick cover expected
they have been dominantly sourced directly from rockwalls on the snout, surface lowering rates from the moraines were
further upglacier and less frequently emerged from englacial compared to the overall debris thickness of the glacier. These
pathways. Clast samples from between the moraine and the net rates of −0.16 m year−1 on the gullied upper part and
www.earth-surf-dynam.net/7/411/2019/ Earth Surf. Dynam., 7, 411–427, 2019422 T. van Woerkom et al.: Sediment supply from lateral moraines to a debris-covered glacier in the Himalaya Figure 10. Angularity samples taken on the glacier surface; observed and modelled runout lengths are also shown. The inset shows angularity values for samples beyond the modelled runout length (“glacier”), between the runout length and the base of the moraine (“runout”) and on the moraine (“moraine”). In the top right corner, marked in blue, the glacier is still connected to rockwalls by way of avalanching. +0.19 m year−1 on the debris apron suggest that no debris erosion rate of −0.16 m year−1 , which occurs over an area reaches the glacier surface, but only a relocation of moraine of 0.095 km2 . If it is assumed that this amount of debris material takes place. However, we do see depositional fea- is distributed equally over the entire glacier surface within tures beyond the current debris apron on the glacier. In ad- the UAV domain (0.33 km2 ), this results in an annual in- dition, one could argue that the glacial melt rates under- crease in debris thickness of 0.05 m, although this is unlikely neath the debris apron are slightly lower than those on the given the observed runout lengths. If the debris is only de- glacier due to the thick debris layer on top (Schomacker, posited within the area constrained by the maximum runout 2008), which would decrease the net deposition rate on the distance (0.19 km2 ), this implies an annual increase in de- apron and would at maximum result in no net deposition bris thickness of 0.08 m. Observed debris thickness for this or erosion at the debris apron. This suggests that the maxi- glacier is in the range of 0.11–2.3 m (µ = 0.84 m) (McCarthy mum debris supply to the glacier is only related to the gully et al., 2017) and 0.4–1.6 m closer to the moraine (Steiner Earth Surf. Dynam., 7, 411–427, 2019 www.earth-surf-dynam.net/7/411/2019/
T. van Woerkom et al.: Sediment supply from lateral moraines to a debris-covered glacier in the Himalaya                                 423

Figure 11. Dominant processes at lateral moraines and consequences for the glacier terminus of a debris-covered glacier. Mass transport
from lateral moraines (a1) as well as debris transport from head walls and englacial transport (a2) are shown. Slumping as a consequence of
debuttressing at the terminus (a3) brings more material into the glacier forefield (a4), as the tongue retreats in time (t). As a consequence,
the moraine crest slumps (b2) and the moraine becomes shallower compared to upper parts where transport is mainly to rockfall and debris
flows (b1).

et al., 2018) measured around the on-glacier weather sta-                glacier surface. The lower the downwasting rate, the higher
tion. Furthermore, on the lower part of the Baltoro Glacier in           the possible surplus of debris that can possibly move beyond
the Karakoram, similar debris accumulation rates have been               the apron and closer to the centre of the tongue, resulting
found, ranging between 0.05 and 0.30 m year−1 , suggesting               in a thickening debris cover and making it a negative feed-
that debris-covered tongues get buried rapidly (Gibson et al.,           back effect. This is important to take into account in energy
2017b).                                                                  balance models (Carenzo et al., 2016; Rowan et al., 2015),
    The clear concave arcuate terminus appearance of retreat-            which often use a uniform debris cover derived solely from
ing debris-covered glaciers (DCGs) as opposed to the gener-              rockwalls and do not take deposition and remobilization of
ally convex terminus of clean glaciers however does suggest              lateral moraine debris into account. Lateral moraine debris
extensive moraine sediment supply, along with internal ab-               supply is also found to be important for the form of terminus
lation due to drainage conduits. As the tongue retreats, the             retreat.
debuttressing of the glacier causes the moraine to slump and
fill the space available with moraine material (Fig. 11a3 and
                                                                         5    Conclusion
b2), which might cause the higher debris supply here. At
Lirung Glacier, the terminus retreated at a rate of 30 m year−1          In this study, a time series of 5 years of UAV data is used to
at the centreline and much slower at the margins, as here                investigate the importance of lateral moraine mass transport
the moraine-derived debris quickly covered the ice, result-              to a debris-covered tongue and the following key conclusions
ing in the moraine crest to slump and become shallower                   are drawn:
(Fig. 11b2), and melt rates to decrease.
    It is also remarkable that the near-moraine glacier down-                – The surface lowering on the lateral moraines is high at
wasting rate (−0.6 m year−1 ) is much lower than previously                    an average rate of 0.31 m year−1 , also attributed par-
found downwasting rates over the entire glacier (< −1.3                        tially to the melt of sub-moraine ice. This translates to a
and −2.18 m year−1 ; Nuimura et al., 2017; Immerzeel et al.,                   maximum increase of debris thickness of 0.08 m year−1
2014a). This indicates a possibly thicker debris cover near                    in a narrow runout zone of approximately 50 m next to
the moraines suppressing downwasting rates, which is also in                   the moraine.
line with the lack of ponds and ice cliffs close to the moraine
(Immerzeel et al., 2014a) and supports the debris supply rates               – As the downwasting rate decreases, this rate of thicken-
presented in this paper. Considering these processes, our re-                  ing will likely increase, resulting in a negative feedback
sults indicate that lateral moraine mass transport can play an                 with increasing debris thickness and reduced melt rates.
important role in debris supply to the margins of a down-                      If supplied far enough upstream, this additional debris
wasted glacier tongue with steep lateral moraines, where it                    may then be redistributed on the glacier surface.
offsets the downwasting of the ice with deposition of debris.
As the glacier downwastes, more moraine surface is suscepti-                 – There is a strong seasonality in lateral moraine mass
ble to erosion, while more space becomes available for debris                  transport and the rates are higher in the wet summer
apron formation, continuously inhibiting debris to reach the                   season, which indicates the combination of water-driven
                                                                               processes and glacier melt as key mechanisms.

www.earth-surf-dynam.net/7/411/2019/                                                            Earth Surf. Dynam., 7, 411–427, 2019
424 T. van Woerkom et al.: Sediment supply from lateral moraines to a debris-covered glacier in the Himalaya
– The steep upper part of the moraine is intensely gullied Acknowledgements. The input from Tjalling de Haas on mass
and transports debris quickly to the depositional debris transport processes is greatly appreciated.
apron. Here, the more gentle slopes are reworked by wa-
ter flow, debris flow entrainment and slow slumping.
Financial support. This research has been supported by the Eu-
– Rockfall and landslides occur occasionally and influ- ropean Research Council (ERC) under the European Union’s Hori-
ence the vertical elevation change pattern; they are, zon 2020 research and innovation programme (grant agreement
however, of minor importance in the overall balance. no. 676819) and by the research programme VIDI with project num-
ber 016.161.308 financed by the Netherlands Organisation for Sci-
entific Research (NWO).
– Runout distance modelling shows that it is unlikely that
these processes are responsible for the distribution of
the eroded material on the glacier since the maximum
Review statement. This paper was edited by Niels Hovius and
distance is small (∼ 56 m). This is supported by the clast reviewed by Simon Pendleton, Martin Kirkbride, Martin Truffer,
analysis, which shows angularity to increase rapidly and one anonymous referee.
from the moraine (30 % being angular or very angu-
lar) towards the glacier centre (> 55 % being angular
or very angular), in addition to reduced melt rates near
the glacier margin. References
– Considering these results and revisiting our initial hy- Anderson, R. S., Anderson, L. S., Armstrong, W. H.,
pothesis, debris supply from lateral moraines alone can Rossi, M. W., and Crump, S. E.: Glaciation of alpine
not explain the thick and continuous debris cover of valleys: The glacier – debris-covered glacier – rock
tongues on debris-covered glaciers. While a consider- glacier continuum, Geomorphology, 311, 127–142,
able amount of debris from the moraines reaches the https://doi.org/10.1016/j.geomorph.2018.03.015, 2018.
surface, it can only explain thickening on the margins Ballantyne, C. K.: Paraglacial Geomorphology, in: Encyclopedia
of the tongue. of Quaternary Science: Second Edition, Pergamon, vol. 21,
553–565, https://doi.org/10.1016/B978-0-444-53643-3.00089-3,
– Further research is needed that incorporates glacier dy- 2013.
Ballantyne, C. K. and Benn, D. I.: Paraglacial Slope Adjust-
namics and lateral drag with the moraines and its impli-
ment and Resedimentation Following Recent Glacier Retreat,
cations for possible debris transport on the glacier sur-
Fabergstolsdalen, Norway, Arctic Alpine Res., 26, 255–269,
face. In addition, methods to quantify rockwall erosion https://doi.org/10.2307/1551938, 1994.
rates as well as subglacial erosion on debris-covered Benn, D. I. and Ballantyne, C. K.: Reconstructing the transport his-
glaciers need to be developed to understand the full sed- tory of glacigenic sediments: a new approach based on the co-
iment balance of a debris-covered glacier tongue. Better variance of clast form indices, Sediment. Geol., 91, 215–227,
estimations of sub-debris apron glacier melt would also https://doi.org/10.1016/0037-0738(94)90130-9, 1994.
greatly improve the debris supply estimations. Using Benn, D. I. and Owen, L. A.: Himalayan glacial sedimentary envi-
different future scenarios of glacier recession, the long- ronments: A framework for reconstructing and dating the former
term development of lateral moraines and their chang- extent of glaciers in high mountains, Quatern. Int., 97-98, 3–25,
ing contribution to an increasing debris cover could also https://doi.org/10.1016/S1040-6182(02)00048-4, 2002.
Bolch, T., Kulkarni, A., Kääb, A., Huggel, C., Paul, F., Cogley, J. G.,
be investigated in a dedicated modelling study.
Frey, H., Kargel, J. S., Fujita, K., Scheel, M., Bajracharya, S., and
Stoffel, M.: The state and fate of himalayan glaciers, Science,
336, 310–314, https://doi.org/10.1126/science.1215828, 2012.
Data availability. The elevation difference datasets from which Boulton, G. S.: Boulder shapes and grain-size distributions of debris
the values in this paper are derived can be found at the following as indicators, Sedimentology, 25, 773–799, 1978.
DOI: https://doi.org/10.5281/zenodo.2682541 (van Woerkom and Brun, F., Berthier, E., Wagnon, P., Kääb, A., and Treichler, D.:
Kraaijenbrink, 2019). A spatially resolved estimate of High Mountain Asia glacier
mass balances from 2000 to 2016, Nat. Geosci., 10, 668–673,
https://doi.org/10.1038/ngeo2999, 2017.
Author contributions. JFS, PDAK, ESM and WWI developed Cai, F. and Ugai, K.: Numerical Analysis of Rainfall Ef-
the research goal. TvW, JFS and PDAK performed the primary data fects on Slope Stability, Int. J. Geomech., 4, 69–78,
analysis and model development. TvW, JFS and WWI wrote the https://doi.org/10.1061/(ASCE)1532-3641(2004)4:2(69), 2004.
paper. PDAK and ESM helped with interpretation of results. Carenzo, M., Pellicciotti, F., Mabillard, J., Reid, T., and Brock,
B. W.: An enhanced temperature index model for debris-covered
glaciers accounting for thickness effect, Adv. Water Resour.,
Competing interests. The authors declare that they have no con- 94, 457–469, https://doi.org/10.1016/j.advwatres.2016.05.001,
flict of interest. 2016.
Earth Surf. Dynam., 7, 411–427, 2019 www.earth-surf-dynam.net/7/411/2019/You can also read