SEISMIC PERFORMANCE EVALUATION OF A MASONRY BUILDING SUBJECTED TO NEAR AND FAR FIELD GROUND MOTIONS
←
→
Page content transcription
If your browser does not render page correctly, please read the page content below
Article no. 25

                                                                THE CIVIL ENGINEERING JOURNAL 3-2020

               ---------------------------------------------------------------------------------------------------------------

   SEISMIC PERFORMANCE EVALUATION OF A MASONRY
  BUILDING SUBJECTED TO NEAR AND FAR FIELD GROUND
                      MOTIONS

                                                 Özden Saygılı

     Yeditepe University, Faculty of Engineering, Department of Civil Engineering,
               Istanbul, 34755, Turkey; ozden.saygili@yeditepe.edu.tr

ABSTRACT
        On October 23, 2011 an earthquake occurred approximately 20 km north of the province of
Van, Turkey with a magnitude of Mw 7.2. Following the main earthquake, 111 aftershocks with
magnitudes of 4.0 and above occurred. The state of damage was very severe and considerable
amount of unreinforced masonry buildings were affected highlighting the need for investigating the
seismic design of unreinforced masonry buildings in the affected area. In this paper, seismic
behaviour of a two story masonry building designed according to the 2019 Turkish Building
Seismic Code is presented. The main objective of this activity was to study the near field and far
field synthetic ground motions, artificial ground motions and evaluating the responses to get
reliable information on the seismic response of masonry buildings.

KEYWORDS
       Masonry buildings, Seismic analysis, Near-field seismic motion, Time history analysis

INTRODUCTION
        Located in a major earthquake zone in Turkey, most of the buildings especially in rural
areas are in form of masonry construction. Historical ones are generally unreinforced stone or brick
masonry. Modern masonry buildings are generally reinforced and confined masonry constructed
with fired clay bricks or concrete blocks. This structural type of brick masonry is also widely used
for housing in most of the countries due to its advantages of brickwork, aesthetic appearance and
economy of the construction [1], [2], [3], [4]. In many countries a considerable amount of research
was carried out and continues to contribute to improvement of seismic codes for masonry
buildings. In Turkey, this type of construction became popular in recent times but there is no
specific design code for masonry buildings. It is important to investigate the seismic behaviour of
masonry buildings since large mass of walls could result in serious damages under earthquake
ground motion. In this study a two-story masonry building was designed according to the recently
adopted 2019 Turkish Building Seismic Code (2019 TBSC) [5]. Structural performance of the
masonry building was investigated under seismic excitations. Dynamic analyses were performed
under real and simulated ground motions. Near filed and far field synthetic ground motions were
generated compatible with the target spectrum. Due to the characteristics of earthquakes, near
field ground motions have long period velocity pulses that are not shown in far field ground
motions. Besides, the effect of ground motion of a moderate-large earthquake recorded in a near-
field, mostly differ from the effects recorded far from the earthquake source [6]. This research also
aims to investigate the seismic response of a two-story masonry building due to near-field and far-
field ground. Therefore, the City of Van located in Turkey was chosen as the study area. The city is
under the influence of the 40 km long Bitlis fault zone which passes about 20 km north of the city

                                      DOI 10.14311/CEJ.2020.03.0025                                                  280
Article no. 25
THE CIVIL ENGINEERING JOURNAL 3-2020
---------------------------------------------------------------------------------------------------------------
and the South Anatolian fault. The region of Van is under the influence of the north-south
compression and contraction zone as a result of the proximity of the Arabian plate to the north
towards the Eurasian plate. There are three different categories of faults falling in the Van region;
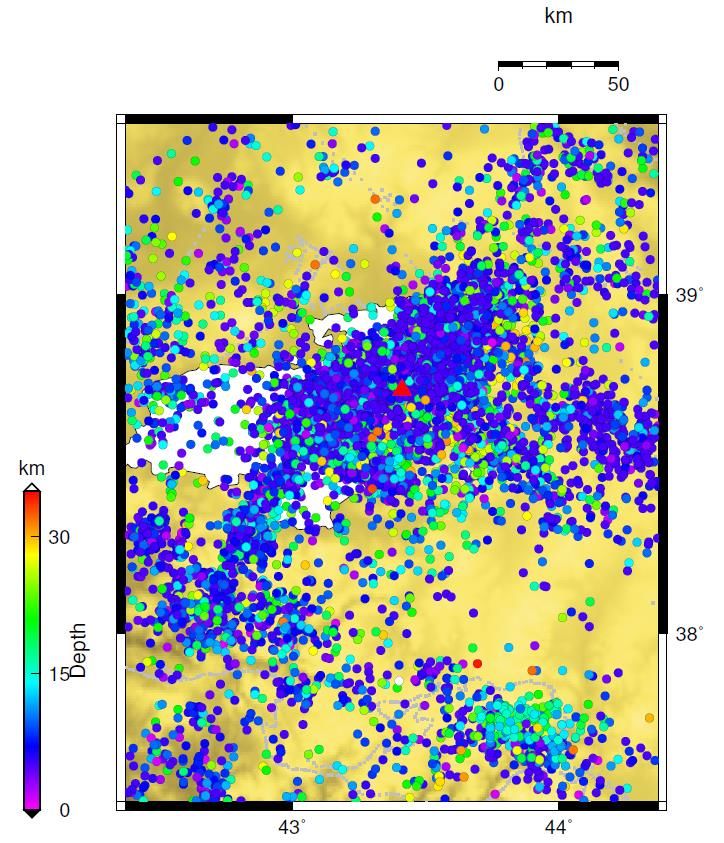
strike-slip, thrust to reverse and oblique-slip normal [7]. A simplified tectonic unit and seismic
activity of Van and its surroundings is given in Figure 1. These maps were constructed with
Generic Mapping Tools (GMT). On October 23, 2011 the Van earthquake occurred approximately
20 km north of the province of Van with a magnitude of Mw 7.2 with a right-lateral strike-slip
mechanism. Following the main earthquake, 111 aftershocks with a magnitude of Mw 4.0 and
above occurred. According to the Disasters and Emergency Situations Directorate of Turkey
(AFAD), this earthquake resulted in the death of approximately 604 people, 4,152 people were
injured, and 6,017 buildings collapsed [8]. Another earthquake of Mw 5.7 took place on 9
November 2011. In addition to that, after October 23, 2011, 5527 earthquakes ranging in size from
1.4 to 5.7 occurred in the Van earthquake region for about 1 year [9], [10].
GROUND MOTION DATA SETS
The ground motion recorded in field within a distance of about 20 km from the fault rupture
is typically known as near-field ground motion. Although there is no clear definition for the distance
range of near and far field, if the site is about 50 km around the fault then the ground motion is
considered as a far-field earthquake. Near-field ground motions distinctively have higher
acceleration, more limited frequencies and different pulses in time histories as far as far field
ground motion is concerned. In addition to that, forward directivity and fling step effects are
common characteristics of near-field ground motions. These effects result from rupture
mechanism, residual ground displacement and slip direction of rupture relative to the site. At the
beginning of the record, large pulses are observed due to transfer of a major portion of the fault’s
energy to the site when the rupture propagation of the fault towards a site with a velocity close to
the shear wave velocity. Seismic waves observed at site with radiation pattern of the fault oriented
in the fault-normal direction get close to each other and generate a large pulse which decreases
the duration of the fault waves reaching the structure [11], [12]. Although most of these pulses are
observed from the radiation pattern of the fault oriented in the fault-normal direction, the fault
parallel direction could result in strong pulses, too [13], [14]. Fling-step effect is the relative slip
between the hanging wall and footwall which produces large amplitude unidirectional velocity pulse
and a monotonic step in displacement time history [15], [16]. These pulses result in the occurrence
of static permanent ground displacements due to tectonic deformation associated with fault rupture
[17]. As these near field effects can lead to higher seismic demands, it is important to take seismic
design of structures located in the near-field zone into consideration [14], [18], [19], [20], [21]. 2019
TBSC provides regional variations in the shape of the response spectrum for site conditions,
earthquake source and path. In this study for the target spectrum, a reduced design acceleration
spectrum was created under a horizontal earthquake effect according to the 2019 TBSC. The soil
profile in the selected area is composed of thick, medium solid-hard silt and silt sand and gravel
sand layers ranging from clay to medium tight-tight. The shear wave velocities obtained in the
central districts of Van province according to SPT-N values vary between 261.3 m / s and 357.7 m
/ s [22], [23]. Taking into account the site properties proposed by the National Earthquake Hazard
Reduction Program (NEHRP), the site is medium tight-hard as class D [24].
DOI 10.14311/CEJ.2020.03.0025 281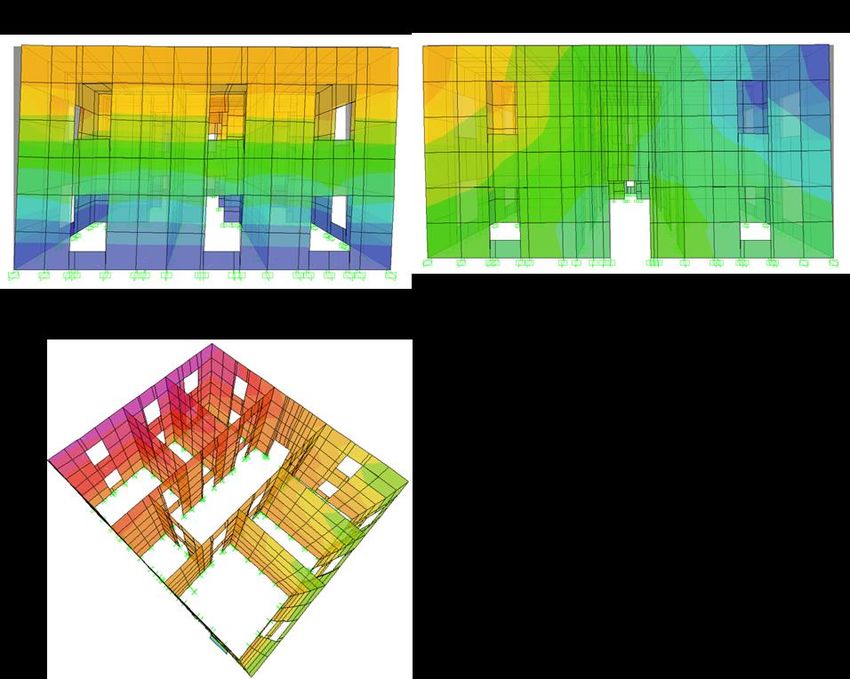
Article no. 25

                                                      THE CIVIL ENGINEERING JOURNAL 3-2020

     ---------------------------------------------------------------------------------------------------------------

                                                (a)

                                                (b)
Fig. 1 – A simplified tectonic units and seismic activity of Van and surroundings

                            DOI 10.14311/CEJ.2020.03.0025                                                  282
Article no. 25
THE CIVIL ENGINEERING JOURNAL 3-2020
---------------------------------------------------------------------------------------------------------------
Two different earthquake ground motion levels were taken into consideration for the
generation of synthetic accelerograms. The first ground motion level has a 2% probability to be
exceeded in 50 years. Return period of this ground shaking is approximately 2475 years. The
second ground motion level has a 10% probability to be exceeded in 50 years. Return period of
this ground shaking is approximately 475 years. For each earthquake ground motion level a total of
eight near field, eight far field synthetic excitations and eight artificial ground motions were
generated based on the adaptation of a random process to a target spectrum of the region.
SeismoArtif provides a user defined spectrum to generate artificial accelerograms [25]. The
accelerogram was defined using target spectrum and adapting its frequency content using the
Fourier transform. Hallodorson and Papageorgiou algorithm was used for the generation of
synthetic motions applied both in the near-fault and in the far-field region [26]. The correction of the
random process was performed for each iteration using Equation 1 [27]:
SRT(f)
F(f)i+1 = F(f)i [ SR(f) ] (1)
i
where,
F(f)i+1, F(f)i are the data of the accelerogram in the frequency domain;
SR(f)i is the data response spectrum relative to the accelerogram of that iteration due to
frequency f.
SRT(f) is the data of target spectrum relative to the accelerogram of that iteration due to
frequency f.
At each iteration a Fourier transformation was applied to move from time domain to
frequency domain. In order to generate the synthetic accelerogram, Gaussian white noise was
multiplied by Saragoni & Hart envelope shape [28]. Soil effects were considered as linear based on
NERPH class D (Vs30 = 255 m/s). The smallest and largest periods of the target response
spectrum were used to determine the frequency range within the power spectral density function.
In order to establish the elastic response spectra, linear dynamic analysis was performed using
Newmark integration method to solve the single degree of freedom system of equations of motion
[29]. In addition to these synthetic ground motions (SGM), artificial ground motions (AGM) were
generated through the use of a Saragoni and Hart (1974) envelope shape and a power spectral
density function which was calculated from the velocity target spectrum of earthquake ground
motion level 1 and level 2. Sinusoidal wave Equation 2 was used to generate the steady state
motion:
W(t) = ∑i Ai sin(wi t + ϕi ) (2)
where,
Ai is the amplitude and
Φi is the phase angle of the ith sinusoidal wave.
In order to simulate the transient behaviour for the artificial ground motions, GM(t) the
steady state motions were multiplied by Saragoni and Hart (1974) envelope shape, I(t) in which the
phase angles are in the interval of [0 2Π], with a uniform probability distribution by Equation 3:
GM(t) = I(x) ∑i Ai sin(wi t + ϕi ) (3)
For the ground motion level 1, peak ground acceleration (PGA) of near field and far field
synthetic ground motions varies between 0.51 g and 0.53 g. For the same ground motion level
peak ground velocity (PGV) values which are often considered as the indicator of damage potential
are in the range of 0.50 m/sec and 0.76 m/sec. For the ground motion level 2, peak ground
acceleration (PGA) of near field and far field synthetic ground motions is about 0.27 g. For the
same ground motion level peak ground velocity values vary between 0.31 m/sec and 0.53 m/sec.
DOI 10.14311/CEJ.2020.03.0025 283
Article no. 25
THE CIVIL ENGINEERING JOURNAL 3-2020
---------------------------------------------------------------------------------------------------------------
Furthermore ground motion record of October 23, 2011 Van earthquake (ML 6.7) was downloaded
from the Disaster and Emergency Management Authority (AFAD) Strong Motion Database. The
earthquake lasted for approximately 80 s. Acceleration time histories of Van Earthquake are given
in Figure 2. Comparison of target spectrum and response spectrum of ground motions are shown
in Figure 3 and Figure 4.
0,2 N-S 0,2 E-W
PGA = 0.178 g 0,15 PGA = 0.169 g
Acceleration (g)
Acceleration (g)
0,1 0,1
0,05
0
0
0,0
5,2
10,5
15,7
20,9
26,1
31,4
36,6
41,8
47,0
52,3
57,5
62,7
67,9
73,2
78,4
0,0
5,2
10,5
15,7
20,9
26,1
31,4
36,6
41,8
47,0
52,3
57,5
62,7
67,9
73,2
78,4
-0,1 -0,05
-0,1
-0,2 -0,15
Time (s) Time (s)
Fig. 2 – Acceleration histories of Van NS and EW components
Earthquake Ground Motion Earthquake Ground Motion
1,6 Level 1 Near Field SGM 1 1 Level 2 Near Field SGM 1
Near Field SGM 2 Near Field SGM 2
1,4 Near Field SGM 3 Near Field SGM 3
0,8
1,2 Near Field SGM 4 Near Field SGM 4
Near Field SGM 5 Near Field SGM 5
1 Near Field SGM 6 0,6 Near Field SGM 6
Acc (g)
Acc (g)
0,8 Near Field SGM 7 Near Field SGM 7
Near Field SGM 8 Near Field SGM 8
0,6 0,4
Target Spectrum Target Spectrum
0,4
0,2
0,2
0 0
1,44
3,36
0,96
2,88
0,24
0,48
0,72
0,96
1,2
1,68
1,92
2,16
2,4
2,64
2,88
3,12
3,6
3,84
0,24
0,48
0,72
1,2
1,44
1,68
1,92
2,16
2,4
2,64
3,12
3,36
3,6
3,84
0
0
Perıod (s) Perıod (s)
Earthquake Ground Motion Earthquake Ground Motion
1,6 Level 1 Far Field SGM 1 1 Level 2 Far Field SGM 1
Far Field SGM 2 Far Field SGM 2
1,4 Far Field SGM 3 Far Field SGM 3
0,8
1,2 Far Field SGM 4 Far Field SGM 4
Far Field SGM 5 Far Field SGM 5
1 Far Field SGM 6 0,6 Far Field SGM 6
Acc (g)
Acc (g)
0,8 Far Field SGM 7 Far Field SGM 7
Far Field SGM 8 Far Field SGM 8
0,6 0,4
Target Spectrum Target Spectrum
0,4
0,2
0,2
0 0
1,44
3,36
0,96
2,88
0
0,24
0,48
0,72
0,96
1,68
1,92
2,16
2,64
2,88
3,12
3,84
0
0,24
0,48
0,72
1,44
1,68
1,92
2,16
2,64
3,12
3,36
3,84
1,2
2,4
3,6
1,2
2,4
3,6
Perıod (s) Perıod (s)
Fig. 3 – Comparison of target spectrum and response spectrum of synthetic ground motion (SGM)
for ground motion level 1 and level 2
DOI 10.14311/CEJ.2020.03.0025 284Article no. 25
THE CIVIL ENGINEERING JOURNAL 3-2020
---------------------------------------------------------------------------------------------------------------
Earthquake Ground Motion Earthquake Ground Motion
1,6 Level 1 AGM 1 1 Level 2 AGM 1
AGM 2 AGM 2
1,4 AGM 3 AGM 3
0,8
1,2 AGM 4 AGM 4
AGM 5 AGM 5
1 AGM 6 0,6 AGM 6
Acc (g)
Acc (g)
0,8 AGM 7 AGM 7
AGM 8 AGM 8
0,6 0,4
Target Spectrum Target Spectrum
0,4
0,2
0,2
0 0
0
0,24
0,48
0,72
0,96
1,2
1,44
1,68
1,92
2,16
2,4
2,64
2,88
3,12
3,36
3,6
3,84
0,24
0,48
0,72
0,96
0
1,2
1,44
1,68
1,92
2,16
2,4
2,64
2,88
3,12
3,36
3,6
3,84
Perıod (s) Perıod (s)
(a)
Earthquake Ground Motion Earthquake Ground Motion
1,4 Level 1 1
Level 2
1,2
VAN EQ - EW
0,8
1 VAN EQ - EW
VAN EQ - NS 0,6 VAN EQ - NS
Acc (g)
0,8
Acc (g)
VAN EQ - UD VAN EQ - UD
0,6 0,4
Target Spectrum Target Spectrum
0,4
0,2
0,2
0 0
0,24
0,48
0,72
0,96
1,2
1,44
1,68
1,92
2,16
2,4
2,64
2,88
3,12
3,36
3,6
3,84
0
0,24
0,48
0,72
0,96
1,44
1,68
1,92
2,16
2,64
2,88
3,12
3,36
3,84
0
1,2
2,4
3,6
Perıod (s) Perıod (s)
(b)
Fig. 4 – Comparison of target spectrum and response spectrum of artificial ground motion (AGM)
for ground motion level 1 and level 2 (a), comparison of target spectrum and response spectrum of
October 23, 2011 Van Earthquake (b)
DESCRIPTION OF NUMERICAL MODEL
For the numerical modelling, finite element modelling (FEM) software SAP2000 was used
to create the two-story masonry building. The two story masonry building was considered to be
designed for dead load, live load and seismic load according to the 2019 TBSC. The masonry
building that was considered for this study was a double story building consisting of three bays in
each direction of 10.25 m long and 12 m wide. The wall was 0.25 m thick and the total height of
masonry buildings was 5.90 m. In the building, tops of openings in the story were at the same
level. The plan of the building consisted of a continuous lintel band through all walls just above the
openings but it was not considered in the numerical model. The wall was discretized into small
number of elements. The structural members of the masonry building were slabs, beams and
bearing walls. The slab was reinforced concrete and was supported by horizontal beams on the
masonry walls. In order to integrate concrete slab and masonry walls with each other and distribute
the horizontal loads to the masonry walls; rigid diaphragm behaviour was adopted. By this way, the
shear force induced by the walls was compensated by the in-plane rigidity of the walls. In the
numerical model floor, the slab has a degree of freedom of translation in two in-plane directions
and rotation about the vertical direction. At 4 m intervals in the masonry walls vertical beams were
designed according to 2019 TBSC. These vertical beams and proper connection between wall and
DOI 10.14311/CEJ.2020.03.0025 285Article no. 25
THE CIVIL ENGINEERING JOURNAL 3-2020
---------------------------------------------------------------------------------------------------------------
diaphragms would lead to ductile behaviour governed by the in plane response of the masonry
walls.
In the Eurocode 8 of Part 1 and Part 3, the conditions of limit for the design or assessment
of masonry buildings refer to a damage limitation and to an ultimate limit state. According to
Eurocode 8, three different performance criteria are included: damage limit state of the occurrence
of damage and the associated limitations of use. The Ultimate limit or Life Safety limit state that the
structure should remain without global or local collapse that the structure continue to carry the
gravity load demands of buildings and a residual load bearing capacity [30]. In the FEMA E-74,
earthquake damage to non-structural elements are given in three types of risks: Life Safety limit
state, Property Loss limit state and a Functional Loss limit state [31]. In the FEMA 273, the given
performance criteria applied for structural components and unreinforced masonry infill walls are
Immediate Occupancy, Life Safety and Collapse Prevention [32]. According to the given definitions
for the performance of masonry buildings in 2019 TBSC, if the shear strength of all the walls of the
masonry building in both directions is sufficient to meet the shear forces generated by the applied
earthquake effects, it is concluded that the building provides a Limited Damage Performance
Level. This level of performance corresponds to the level of damage in which the building damage
is limited, i.e. non-linear behaviour is limited. If the contribution of the walls that do not meet this
condition to the shear force is lower than the 40% in the earthquake direction applied on any floor,
the building will be considered to provide the Controlled Damage Performance Level. This level of
performance corresponds to the level of damage to the structural components which is not serious
and often repairable to ensure safety. If this rate exceeds 40%, the building is considered to be in a
Collapse State. In this study, the resulting shear force was compared with the safety shear strength
of the wall, taking into account the vertical normal force on the wall and the bearing strength of the
wall. Wall areas were calculated by removing gaps such as doors and windows. For the safety of
the structural system, the torsional rigidity relative to the vertical axis of the building was
determined according to the 2019 TBSC. Masonry walls were designed such that the stress
calculated by dividing the design force acting on the masonry wall in the vertical direction by the
cross-sectional area excluding door and window openings on the wall is not greater than the
allowable compressive stress for the wall. In addition to that, the masonry walls were designed
such that the design strength of vertical load was greater than the design normal force acting in the
vertical direction to the masonry wall. To this aim, the following equations (2019 TBSC) given in
Table 1 were used:
Tab. 1 - 2019 Turkish Building Seismic Code given design equations
Characteristic shear strength of masonry wall, fvk
Initial shear strength of masonry wall,
fvk = fvko + 0.4σvertical ≤ 0.10fb fvko obtained from TBSC 2019
fvko = 0.30 MPa
Vertical compression stress
Axial force, NEd
NEd Wall cross-section length, l
σvertical =
lt Wall thickness, t
Shear strength of masonry wall design
1.5fvdo NEd
VRd = lt √1 + VRd = fvdo tlc
b 1.5ltfvdo
fvko
fvdo =
γm
Strength reduction coefficient, γm is 0.2 determined according to the TBSC 2019
DOI 10.14311/CEJ.2020.03.0025 286Article no. 25
THE CIVIL ENGINEERING JOURNAL 3-2020
---------------------------------------------------------------------------------------------------------------
The initial shear strength of the masonry wall, fvk0 is determined according to the 2019
TBSC. Accepted compressive strength of the masonry wall, fb is 20 MPa. The elasticity and shear
modulus of the masonry walls was calculated according to the relationship between characteristic
compressive strength of masonry wall and elasticity given in 2019 TBSC.
Eigen frequencies and displacement mode shapes of model are shown in Figure 5. The first
period is approximately 0.067 seconds which is very close to the second mode 0.055 sec due to
the almost symmetric plan those corresponds to a bending mode shape on both orthogonal
horizontal planes. Mode 3 involves shear and torsional movements. Mode 1 and mode 2 are
predominant translation modes that exhibit a high relative modal mass in both orthogonal direction
and little or near zero in rotation. Modal analysis provided valuable information insight into the
dynamic characteristics of the masonry numerical model. In addition to that, as the modal
contribution to the displacement depends on the static properties of the system and the dynamic
response of the system under earthquake excitation time history analyses were performed.
Fig. 5 – Eigen frequencies and displacement mode shapes
SEISMIC RESPONSE ANALYSIS OF A MASONRY BUILDING
Seismic ground motions were applied as base excitation to the numerical model. It was
assumed that the structure was subjected to the earthquake in both horizontal directions. Due to
the fact that the seismic effects in two orthogonal directions are unlikely to reach their maximum
value at the same time, the 30 percent orthogonal loading rule was applied. For the time history
analysis under synthetic and artificial ground motions, 100% of the earthquake was combined with
DOI 10.14311/CEJ.2020.03.0025 287Article no. 25
THE CIVIL ENGINEERING JOURNAL 3-2020
---------------------------------------------------------------------------------------------------------------
30% of the earthquake in the orthogonal direction. During near field and far field seismic
excitations, depending on the direction of ground motion, in-plane and out-of-plane forces occurred
on the masonry walls. For out-of-plane, shear force and bending moment were developed in the
weak direction of the masonry wall due to the weakness of the out-of-plane stiffness of the
masonry wall. Horizontal inertia forces transmitted from the slab were transmitted by the in-plane
forces formed on the walls in the direction of force. Under near and far field earthquakes when the
torsional moment increases the shear force in one part of the masonry walls in the earthquake
direction, it decreases the shear force in the other part. It created a shear force on the masonry
walls for those which were not parallel to the direction of seismic loading.
Variation of top displacement and base shear force under artificial earthquakes, near and
far field earthquakes for ground motion level 1 and ground motion level 2 are given in Figure 6. A
brief inspection of the values indicates that the maximum roof displacements that the masonry
building experienced are under near field excitations created for ground motion level 1. The
duration of the artificial ground motions was about 20 sec. while for the near field and far field
ground motions duration was about 10 sec. and 14 sec., respectively. As the near field ground
motions have higher accelerations and more limited frequencies in time histories than the far field
ground motion, the selected building experienced the highest responses in terms of deformation
and stresses under near field synthetic excitations. The Masonry building was exposed to artificial
ground motions for 20 sec. which resulted in the highest base shear forces in both ground motion
levels. Furthermore, PGV of synthetic and artificial ground motions and roof drift ratios were
compared for each ground motion set (Figure 7). Drift ratios were found by dividing the roof
displacement with the story height. Considering the set of ground motion level 1; PGV of the
synthetic loadings were in the range of 50 cm/sec and 76 cm/sec and PGV of the artificial loadings
were in the range of 50 cm/sec and 58 cm/sec. For the second ground motion level, PGV of the
synthetic loadings varied between 31 cm/sec and 53 cm/sec while PGV of the artificial loadings
were in the range of 27 cm/sec and 36 cm/sec. It is evident for the near field synthetic and artificial
excitations of both ground motion levels; the drift ratio increases with the increase of PGV which is
not clear for far field ground motion data set. Considering the ground motion level 1, although the
PGVs are in about the same range for artificial and far field ground motions, higher drifts were
observed under far field loadings. Furthermore, during seismic analysis in addition to the horizontal
shear forces induced in the walls in the related direction of seismic loading, under vertical loads,
shear forces and bending moment occurred in slabs but shear forces were more effective on the
behaviour of walls of masonry buildings than the bending moment. The designed building had
damage of the ductile type distributed at many locations due to the absorption of a good amount of
energy received from the seismic excitations. Close the opening tensile stresses occurred under
compression which would result in cracks. As expected, the masonry structure experienced
maximum tensile stresses observed under near field earthquake for ground motion level 1 and
minimum tensile stress occurred under the October 23, 2011 Van Earthquake.
DOI 10.14311/CEJ.2020.03.0025 288Article no. 25
THE CIVIL ENGINEERING JOURNAL 3-2020
---------------------------------------------------------------------------------------------------------------
Earthquake Ground Motion Level 1
4000
3500
Base Shear Force (kN)
Near Field SGM
3000 Far Field SGM
2500
AGM
2000
1500
1000
500
0
0 0,2 0,4 0,6 0,8
Roof Displacement (m)
Earthquake Ground Motion Level 2
3000
2500 Near Field SGM
Base Shear (kN)
Far Field SGM
2000
AGM
1500
1000
500
0
0 0,1 0,2 0,3 0,4
Top Displacement (m)
Fig. 6 – Variation of top displacement and base shear force under artificial earthquakes (AGM),
near and far field synthetic earthquakes (SGM) for ground motion level 1 and ground motion level 2
DOI 10.14311/CEJ.2020.03.0025 289Article no. 25
THE CIVIL ENGINEERING JOURNAL 3-2020
---------------------------------------------------------------------------------------------------------------
Earthquake Ground Motion Level 1
PGV (cm/sec)
AGM 80-90
70-80
60-70
Far Field SGM 50-60
40-50
30-40
Near Field SGM 20-30
0,051 0,044 0,109 0,046 0,084 0,057 0,061 0,084 10-20
Roof Drift Ratio 0-10
Earthquake Ground Motion Level 2
PGV (cm/sec)
AGM 50-60
40-50
30-40
20-30
Far Field SGM 10-20
0-10
Near Field SGM
0,030 0,049 0,027 0,035 0,040 0,034 0,032 0,046
Roof Drift Ratio
Fig. 7 – Variation of drift ratio and peak ground velocity (PGV) under artificial earthquakes (AGM),
near and far field synthetic earthquakes (SGM) for ground motion level 1 and ground motion level 2
CONCLUSION
The response of masonry buildings subjected to seismic excitations depends basically on
their failure mechanism and deformation characteristics. Considering the in-plane response of
sliding shear failure of the masonry wall, displacement capacity was generally very large. When the
principal tensile stress exceeds the in-plane tensile strength of the masonry wall, diagonal shear
mode occurs. This case can be described by loss in strength and stiffness of masonry wall with
limited displacement capacity. Another failure mechanism of flexural failure occurs generally in
slender masonry walls due to the large ratio of moment to shear. In addition to these failure modes,
rocking response can be observed due to second order effects. This study evaluates the seismic
capacity of two story masonry buildings designed according to the TBSC 2019. In addition to the
capacity curves determined by pushover analyses performed in two principal directions, time
history analyses were also performed which led to the following conclusions:
• Near field ground motions is characterized by long period velocity pulses due to the
directivity effect and the permanent tectonic deformation at the site which is referred to as the fling
effect. Therefore, slender structures such as masonry minarets or towers with long natural time
periods could be subjected to larger seismic demands under near field seismic excitations. But the
DOI 10.14311/CEJ.2020.03.0025 290Article no. 25
THE CIVIL ENGINEERING JOURNAL 3-2020
---------------------------------------------------------------------------------------------------------------
inspection of the results indicates that these effects could also be accounted for the selected non
slender masonry building with a short natural time period.
• The maximum roof displacements that the masonry building experienced under near field
excitations created for ground motion level 1 were significantly higher than those for the other
earthquakes.
• Under the lateral shear force applied at roof level, the total displacement at the same level
can be considered to be comprised of a displacement of the gross wall acting as a cantilever
additional deflections resulting from flexibility of piers. For the ground motion level 2, under far field
excitations, artificial ground motions and the October 23, 2011 Van Earthquake, the masonry
building showed closed to an elastic behaviour. On the other hand, for the ground motion level 1,
under near field excitations, the masonry building showed an inelastic behaviour.
• For the two levels of synthetic and artificial near field motions considered in this study,
tensile stresses observed close the openings were significantly higher than the far field responses
which would result in cracks. Therefore, in the design process, the location and size of the
openings should be defined to optimize the performance under ground motion. Although, for
ground motion level 2 under far field excitations, artificial ground motions and the October 23, 2011
Van Earthquake masonry walls passed the range of linear elastic limit a bit, under other
earthquakes the deformation levels are well beyond the elastic limit.
• It can be concluded that the selected two story masonry building designed according to the
2019 TBSC can stably withstand inelastic actions without collapse. Results indicate that near field
motions play an important role in seismic resistant design of masonry structures. Near field
synthetic motions produced greater displacement responses in the masonry building than far field
seismic excitations. However, it should be noted that in the case of stiff soils, the reverse can
happen in that far field motions can result in higher responses than near field ground motions.
Therefore, more analysis results of various masonry buildings subjected to near and far field
seismic motion in stiff soil are needed. Major findings should be stated with respect to relevant
literature. Recommendations for future research should also be made.
REFERENCES
[1] Tomazevic M., 1999. Earthquake-resistant design of masonry buildings. Imperial College Press,
London (UK).
[2] EERI/IAEE, 2000. World housing encyclopedia. Earthquake Engineering Research Institute and the
International Association for Earthquake Engineering. www.worldhousing.net.
[3] El-Gawady M., Lestuzzi P., Badoux M., 2004. A Review of Conventional Seismic Retrofitting
Techniques for URM. In: Proceedings, 13th International Brick and Block Masonry Conference.
[4] D’Ayala D., Bostenaru M., Goretti A., Yakut A., Tomazevic M., 2005. Application of the World
Housing. Encyclopedia Geophy Res Abstr, 7, 01649.
[5] TBSC, 2019.Turkish Building Seismic Code (Türkiye Bina Deprem Yönetmeliği) Afet ve Acil Durum
Yönetimi Başkanlığı.
[6] Grimaz S. and MaliSan P., 2014. Near Field Domain Effects and Their Consideration in the
International and Italian Seismic Codes. Bollettino di Geofisica Teorica ed Applicata 55(4): 717-738.
[7] Koçyiğit A., 2013. New Field and Seismic Data about the Intraplate Strike-Slip Deformation in Van
Region, East Anatolian Plateau E. Turkey. J. Asian Earth Science, 60,586-605.
[8] AFAD, 2011. Disasters and Emergency Situations Directorate of Turkey, 28 November 2011.
[9] KOERI, 2011. Van earthquake (Mw 7.2) evaluation report as of 27 October 2011, Bogazçi University,
Kandilli Observatory and Earthquake Research Institute, 3.
[10] KOERI, 2012. Son Depremler, Kandili Rasathanesi ve Deprem araştırma Enstitüsü, Boğaziçi
Üniversitesi, http://www.koeri.boun.edu.tr/ sismo/zeqmap/gmapt.asp (Son Erişim: 26 Nisan 2012).
DOI 10.14311/CEJ.2020.03.0025 291Article no. 25
THE CIVIL ENGINEERING JOURNAL 3-2020
---------------------------------------------------------------------------------------------------------------
[11] Somerville P., Smith N., Graves R., Abrahamson N. 1997. Modification of Empirical Strong Ground
Motion Attenuation Relations to Include the Amplitude and Duration Effects of Rupture Directivity.
Seismological Society Letters, 1(68): 180-203.
[12] Tehranizade M. and Movahed H. 2011. The Investigation of Steel Moment-Resisting Frames in Tall
Structures in Near-Fault Range. Journal of Civil Engineering and Mapping, 5(44): 621-633.
[13] Bray JD., Rodrigues-Marek, A., 2004. Characterization of Forward-Directivity Ground Motions in the
Near-Fault Region. Soil Dynamics and Earthquake Engineering, 11(24): 815-828.
[14] Davoodi M., Sadjadi M., 2015. Assessment of Near-Field And Far-Field Strong Ground Motion
Effects on Soil Structure SDOF System. International Journal of Civil Engineering, 13.
[15] Abrahamson N. and Somerville P., 1996. Effects of the Hanging Wall and Footwall on Ground
Motions Recorded During the Northridge Earthquake. Bulletin of the Seismological Society of America,
86(1B), S93–S99.
[16] Somerville P. G., 2002. Characterizing near fault ground motion for the design and evaluation of
bridges. Paper presented at the Third National Conference and Workshop on Bridges and Highways,
Portland, Oregon.
[17] Bozorgnia B., Bertero V., 2004.Earthquake Engineering: from Engineering Seismology to
Performance-Based Engineering, Florida, CRCPress.
[18] Malhorta P., 1999. Response of Buildings to Near–Field Pulse Like Ground Motion. Earthq. Eng.
Struct. Dynamics, 28(11): 1309–1326.
[19] Alavi B., Krawinkler, H., 2001. Effects of Near-Fault Ground Motions on Frame Structures. John A.
Blume. Earthquake Engineering Center Stanford, California, No. 138.
[20] Rodriguez-Marek A., Bray JD., 2006. Seismic Site Response for Near-Fault Forward-Directivity
Ground Motion. Journal of Geotechnical and Geoenvironmental Engineering ASCE, 1611-1620.
[21] Li S., Xie L., 2007. Progress and Trend on Near-Field Problems in Civil Engineering. Acta
Seismological Sinica, 1(20): 105-114.
[22] Acarlar M., Bilgin E., Elibol E., Erkal T., Gedik İ., 1991. Van Gölü Doğu ve Kuzeyinin Jeolojisi. MTA
Genel Müdürlüğü, No: 1061.
[23] Selçuk L., Aydin H., 2012. Kuvaterner Yaşlı Alüvyal Zeminlerin Kuvvetli Yer Hareketine Etkisi: 2011
Van Depremleri. Jeoloji Mühendisliği Dergisi, 36(2).
[24] BSSC, 2009. The 2003 NEHRP Recommended Provisions for the Development of Seismic
Regulations for New Buildings and Other Structures, Building Seismic Safety Council, FEMA, Washington D.
C.
[25] SeismoSoft 2012. SeismoArtif, version 1.0.0 2012: SeismoArtif’s help system 2002–2012.
Seismosoft Ltd.
[26] Halldorsson B. and Papageorgiou A. S., 2005. Calibration of the Specific Barrier Model to
Earthquake Of Different Tectonic Regions. Bulletin of the Seismological Society of America, 95, 1276—1300.
[27] Mucciarelli M., Spinelli A., Pacor F., 2004. Un Programma per la Generazione di Accelerogrammi
Sintetici “Fisici” Adeguati Alla Nuova Normative. Proceedings of XI Congresso Nazionale L’Ingegneria
Sismica in Italia, Genova, Italy.
[28] Saragoni G.R., Hart G.C., 1974. Simulation of Artificial Earthquakes. Earthquake Engineering-and
Structural Dynamics, 2, 219-267.
[29] Newmark, N.M., 1959. A Method of Computation for Structural Dynamics. Journal of the Engineering
Mechanics Division ASCE, 85(3): 67-94.
[30] CEN., 2004. European Standard Eurocode 8: Design of Structures for Eathquake Resistance. EN
1998-1:2004, Comitè Européen de Normalisation, Bruxelles.
[31] FEMA E74, 2012. Reducing the Risks of Nonstructural Earthquake Damages, Federal Emergency
Management Agency, Practical Guide.
[32] FEMA 273, 1997. NEHRP Guidelines for the Seismic Rehabilitation of Buildings, Federal Emergency
Management Agency, U.S. Department of Homeland Security, Washington DC, USA.
DOI 10.14311/CEJ.2020.03.0025 292You can also read