Self Storage Performance Quarterly - Fourth Quarter 2020 Valuation & Advisory
←
→
Page content transcription
If your browser does not render page correctly, please read the page content below

Valuation & Advisory

Self Storage
Performance Quarterly

Fourth Quarter 2020

Self Storage Performance Quarterly

January 2021

Dear Market Participant,
It is important to note that the data collected for this quarter’s report was gathered between October 1st, 2020
and December 31th, 2020. The market continues to evolve, the data reflected herein does not necessarily reflect
current market conditions. Furthermore, a portion of the REIT analysis is also based on the Quarter End
statements that were released in October 2020 and reflecting 3rd Quarter 2020 results.
Notably, asking rental rates increased, while physical occupancy and rent per available square foot slighty
decreased from the 3rd Quarter 2020 results Nationwide and for the REITs. This demonstrates the sector's
resiliency during the pandemic.
Year over year, asking rental rates, physical occupancy and rental increased for the REITs. Nationwide, asking
rental rates and rental income stayed flat and physical occupancy increased.

      Source: Cushman &Wakefield, Inc. The Self Storage Performance Quarterly, a publication of Cushman & Wakefield, Inc., is intended solely for use by paid subscribers.
      Reproduction or distribution in whole or part without written permission is prohibited and subject to legal action. Copyright® 2021.

      Cushman & Wakefield | Valuation & Advisory                                                                                                                             ii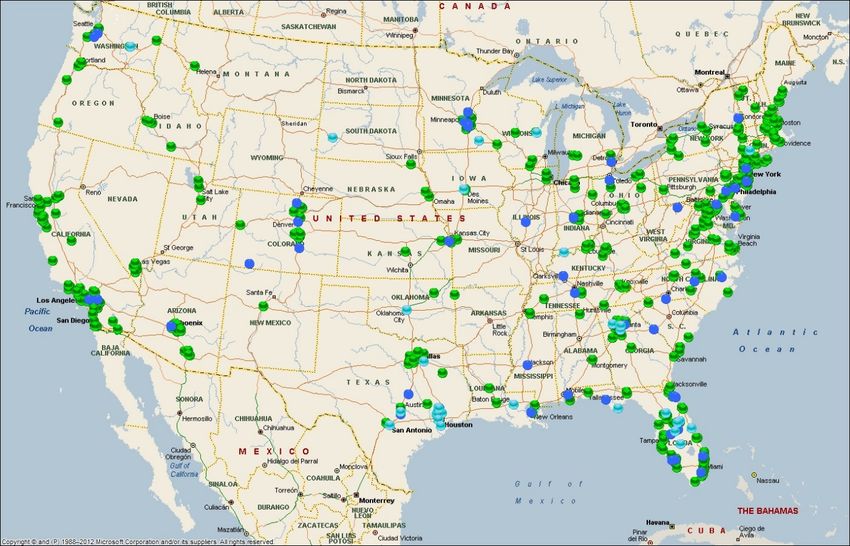
Self Storage Performance Quarterly

Supply and demand metrics appear to be slowing this quarter. Construction starts decreased 39% from last
quarter and decreased 41% as of 4th Quarter 2019. According to F.W. Dodge, there have been 427 new starts
the last four quarters (new starts includes new construction and alterations, additions, or renovations).

The SSPI Self-Storage Performance Index                                                                       Net Units Rented
decreased in the 4th Quarter 2020 and is at                                                                 Per Facility Per Month
123.3, a minus 2.9% change from 3rd                                                                         Nationwide - Average
Quarter 2020. Moreover, SSPI decreased                                                       15

                                                                          Net Units Rented
6.2% compared to 4th Quarter 2019.                                                           10
 Monthly Unit Absorption - Net unit                                                           5
absorption (move-ins less move-outs)                                                          0
indicates a negative trend from last quarter.
                                                                                              -5
For example, the total rental activity was up
4.5% in current four quarters vs. last years                                                 -10
four quarters in 2019, and the monthly unit                                                  -15
absorption was up. The graph illustrates the
average net number of units rented each
month and is based upon a sample of 440±
thousand storage units nationwide.
                                                                                                   2014   2015   2016       2017         2018        2019         2020
Leading Indicator – Self Storage Data
Service’s Rent per Available Square Foot (RPASF) is premised upon asking rental rates and since it takes six
to twelve months to be fully reflected in the facilities performance, RPASF is considered to be a leading indicator.
To measure the validity of this indicator, SSDS tracks the correlation between RPASF and the average rental
income as reported by the four REITs. There is a fairly high degree of statistical correlation between the two as
can be seen in the graph. The data demonstrates that the pace in rent growth will slow, a function of revenue
enhancement models already showing significant growth the past three years. Rent growth in self storage will
continue to exceed other real estate sectors.

       Source: Cushman &Wakefield, Inc. The Self Storage Performance Quarterly, a publication of Cushman & Wakefield, Inc., is intended solely for use by paid subscribers.
       Reproduction or distribution in whole or part without written permission is prohibited and subject to legal action. Copyright® 2021.

       Cushman & Wakefield | Valuation & Advisory                                                                                                                             iii
Self Storage Performance Quarterly

                                                    National
                                     Actual Rent Per SQFT (10x10 Analysis)
      1.60

      1.50

      1.40

      1.30

      1.20

      1.10

      1.00

      0.90

      0.80

                        Climate Ground                                                                   Climate - Upper Level

                        Non-Climate Ground                                                               Non-Climate - Upper Level

                             SSDS' Rent per Available Square Foot vs. the Average Four REITs Rental Income
                                              (Percentage Change - 1Yr Moving Average)

                23.0%

                18.0%

                13.0%

                 8.0%

                 3.0%

                -2.0%

                -7.0%

                                                               "REITs"                                          SSDS RPASF

       Source: Cushman &Wakefield, Inc. The Self Storage Performance Quarterly, a publication of Cushman & Wakefield, Inc., is intended solely for use by paid subscribers.
       Reproduction or distribution in whole or part without written permission is prohibited and subject to legal action. Copyright® 2021.

       Cushman & Wakefield | Valuation & Advisory                                                                                                                         iiii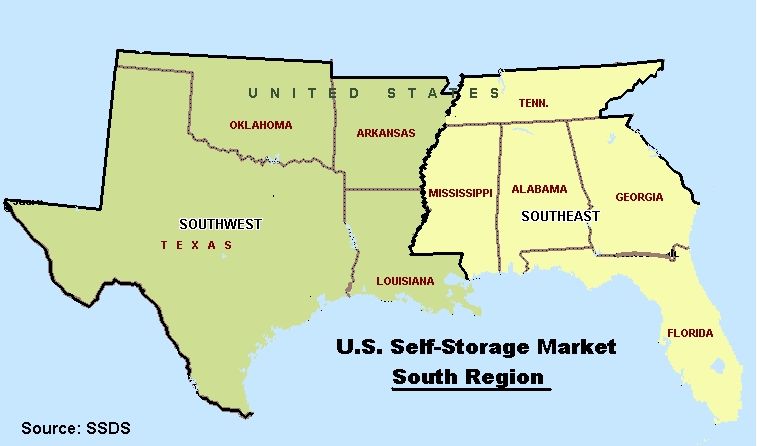
Self Storage Performance Quarterly

Summary of Findings

Self-Storage Performance Index – The SSPI decreased 2.9% compared to 3rd Quarter 2020 and decreased
6.2% to compared to 4th Quarter 2019. The SSPI now stands at 123.3.
Asking Rental Rates – Asking rents increased 0.1% compared to 3rd Quarter 2020 and stayed the same
compared to 4th Quarter 2019, and the REITs increased 1.9% compared to last quarter and increased 2.9% from
4th Quarter 2019.
Physical Occupancy – Median physical occupancy decreased 1.0% compared to 3rd Quarter 2020, also
increased 1.1% over the 4th Quarter 2019, and REITs decreased 1.2% compared to last quarter and increased
3.4% compared to last year.
Concessions – The use of concessions increased this quarter. The cost of concessions increased 0.4%
compared 3rd Quarter 2020, also increased 1.1% over the 4th Quarter 2019. The facilities offering concessions
increased 3.6% from last Quarter and increased 9.9% from year ago, the Concession Cost Index increased to
121.6 in 4th Quarter 2020.
Rent per Available Square Foot – RPASF for the benchmark 100 square foot non-climate-controlled units is
down 1.6% from 3rd Quarter 2020 and stayed the same 0.0% compared to 4th Quarter 2019 and the REITs
decreased 1.8% compared to last quarter and increased 3.4% from last year.
Sampling Statistics – SSDS’ sampling technique assures that the number of REIT facilities in each market’s
sample represents the approximate percentage of actual REIT facilities in that given market. In this quarter
report, data was obtained from 2,242 facilities owned by the four REITs and 8,058 facilities privately owned.
Thus, the percentage of REIT facilities included in this quarter’s sample is a reasonable proportion to their market
share in these top 50 markets.

 Sincerely,
 Cushman & Wakefield Self Storage Data Services
 Self Storage Industry Group

       Source: Cushman &Wakefield, Inc. The Self Storage Performance Quarterly, a publication of Cushman & Wakefield, Inc., is intended solely for use by paid subscribers.
       Reproduction or distribution in whole or part without written permission is prohibited and subject to legal action. Copyright® 2021.

       Cushman & Wakefield | Valuation & Advisory                                                                                                                         iiv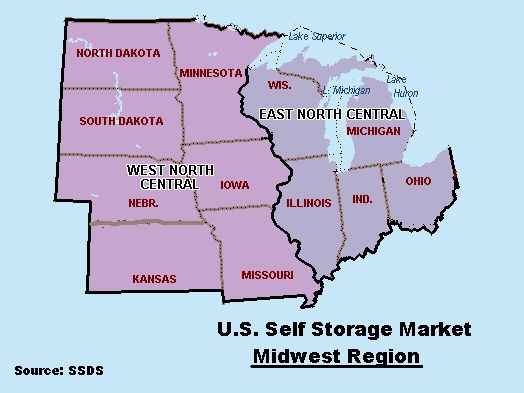
Self Storage Performance Quarterly

Table of Contents
Preface ............................................................................................................................................. 1
Section I – Executive Summary ........................................................................................................ 2
• Performance At-a-Glance ............................................................................................................ 2
Section II – Supply and Demand ...................................................................................................... 3
• Supply .......................................................................................................................................... 3
• Construction Pipeline .................................................................................................................. 3
• New Construction Starts .............................................................................................................. 6
• Location of New Construction ..................................................................................................... 7
• Demand ....................................................................................................................................... 8
Section III – Market Performance Data 4th Quarter 2020 ............................................................... 11
• Self Storage Performance Index ............................................................................................... 11
• Self Storage Performance Benchmarks .................................................................................... 12
• Concession Trends.................................................................................................................... 12
• Trends in Ten Most Popular Concessions ................................................................................ 13
• Elasticity in Demand .................................................................................................................. 14
• Operating Performance – By Region ........................................................................................ 17
• East Region ............................................................................................................................... 21
• Midwest Region ......................................................................................................................... 24
• South Region ............................................................................................................................. 27
• West Region .............................................................................................................................. 30
• Operating Performance – By MSA ............................................................................................ 33
• Median Asking Rental Rates per Square Foot .......................................................................... 34
• Median Physical Occupancy ..................................................................................................... 35
• Median Rent per Available Square Foot ................................................................................... 36
• Implied Economic Occupancy by Metropolitan Area ................................................................. 37
Section IV – Real Estate Investment Trusts (REITs) Performance Data 3rd Quarter 2020............ 38
Section V – Appendices ................................................................................................................ 40
• Methodology & Glossary of Terms ............................................................................................ 40
• Self Storage Chart of Accounts ................................................................................................. 43
• Company Profile ........................................................................................................................ 44

Source: Cushman & Wakefield, Inc. The Self Storage Performance Quarterly, a publication of Cushman & Wakefield, Inc., is intended solely for use by paid subscribers.
Reproduction or distribution in whole or part without written permission is prohibited and subject to legal action. Copyright® 2021.

Cushman & Wakefield | Valuation & Advisory
Self Storage Performance Quarterly

Preface
The Self Storage Performance Quarterly (SSPQ) provides an independent and comprehensive
overview of the current status of the domestic self-storage industry. It is published within 30 days
following the end of each calendar quarter, thus allowing subscribers to monitor the health of the
industry at the operations level in a timely manner. It contains the Self–Storage Performance Index®
(SSPI) as well as an analysis of the markets illustrated with detailed charts and tables.
SSPQ Sample Size - The data and findings contained in this report are the result of operating data
collected each quarter from the population of more than 18,000 self-storage facilities located in the 50
largest metropolitan areas (MSAs) in the United States.

                   4th Quarter 2020 Sample Statistics

                   Geographic Regions & Divisions
                   (See Page 17)                                                      Sample Size                        % of Market
                   Mideast                                                                        875                             16.9%
                   Northeast                                                                   1,352                              26.5%
                   East Region                                                                 2,227                              21.4%
                   East North Central                                                          1,408                              19.7%
                   West North Central                                                             466                             12.4%
                   Midwest Region                                                              1,874                              17.2%
                   Southeast                                                                   1,509                              21.4%
                   Southwest                                                                   2,130                              25.6%
                   South Region                                                                3,639                              23.7%
                   Mountain                                                                       751                             16.5%
                   Pacific                                                                     1,809                              28.6%
                   West Region                                                                 2,560                              23.5%
                   Total of USA                                                              10,300                               21.6%
                   Total of Top 50 MSAs                                                      10,300                               56.3%
                   Source: Cushman & Wakefield, Inc., Copyrighted ® 2021

Note: Cushman & Wakefield has taken every precaution to ensure accuracy in the analysis of the
data and is not liable for any errors or omissions. This data is presented for informational purposes
only.

Source: Cushman & Wakefield, Inc. The Self Storage Performance Quarterly, a publication of Cushman & Wakefield, Inc., is intended solely for use by paid subscribers.
Reproduction or distribution in whole or part without written permission is prohibited and subject to legal action. Copyright® 2021.

Cushman & Wakefield | Valuation & Advisory                                                                                                                          1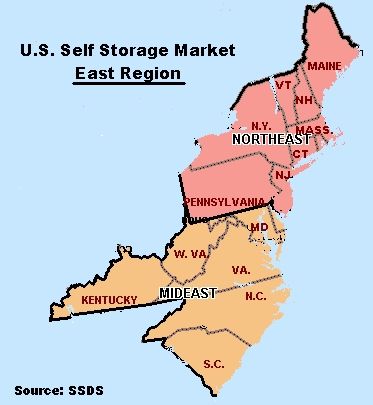
Self Storage Performance Quarterly

Section I – Executive Summary
Performance At-a-Glance
FOURTH QUARTER 2020

(BENCHMARK GROUND LEVEL 10X10 NON-CLIMATE-CONTROLLED-UNITS)
                                                                                                                                              Annual
                                                         Quarterly                                  Seasonal                           Current Four Quarters
 Nationwide
                                                       4Q20 vs. 3Q20                              4Q20 vs. 4Q19                         vs. Preceding Four
                                                                                                                                            Quarters (1)

                                                                           Up                                  No Change                                  No Change
 Asking Rental Rate
                                                                          0.1%                                   0.0%                                       0.0%

                                                                         Down                                        Up                                         Up
 Physical Occupancy Rate
                                                                         -1.0%                                      1.1%                                       0.3%

 Rent Per Available                                                      Down                                  No Change                                  No Change
 Sq. Ft. (Rental Income)                                                 -1.6%                                   0.0%                                       0.0%

                                                                                                                                              Annual
                                                         Quarterly                                  Seasonal                           Current Four Quarters
 REITs
                                                       4Q20 vs. 3Q20                              4Q20 vs. 4Q19                         vs. Preceding Four
                                                                                                                                            Quarters(1)

                                                                           Up                                        Up                                         Up
 Asking Rental Rate
                                                                          1.9%                                      2.9%                                       0.8%

                                                                         Down                                        Up                                         Up
 Physical Occupancy Rate
                                                                         -1.2%                                      3.4%                                       0.8%

 Rent Per Available                                                      Down                                        Up                                         Up
 Sq. Ft. (Rental Income)                                                 -1.8%                                      3.4%                                       0.9%

 Note: (1) The Annual changes reflect the percent change in the moving average for the four quarters ended in the current quarter
 relative to the four quarters ended in the previous quarter

Source: Cushman & Wakefield, Inc. The Self Storage Performance Quarterly, a publication of Cushman & Wakefield, Inc., is intended solely for use by paid subscribers.
Reproduction or distribution in whole or part without written permission is prohibited and subject to legal action. Copyright® 2021.

Cushman & Wakefield | Valuation & Advisory                                                                                                                          2
Self Storage Performance Quarterly

Section II – Supply and Demand
Supply
Supply Data Source – SSDS acquires data from F. W. Dodge to benchmark the trend in new supply,
recognizing that this data source does not report everything that is being built. Data from F. W. Dodge
is published monthly in arrears. As a result, quarter-end data arrives after the scheduled publishing of
the SSPQ report; thus, the supply data reflects the last month statistics of the previous quarter and the
first two-month statistics of the current quarter.

Construction Pipeline
The table below illustrates self-storage projects in the various phases of the construction pipeline by
region of the country. The line item in the table below for New Construction Starts includes: alterations,
renovations, interior completions and additions.

                                                              Project Pipeline By Region

                                                                                                                      Totals         Q4-20 vs          Q4-20 vs
                Description                           East           Midwest           South           West
                                                                                                                      Q4-20           Q3-20             Q4-19
Bidding (All Stages)                                    9                4               6               10             29              -17%             -12%
Construction-In-Process                                 21               7               30              7              65              -11%               5%
Projects Deferred                                       8                3               13              11             35              -20%             -10%
Pre-Planning                                            48               11              20              26             105              24%              -7%
Planning                                               110               37              73              77             297             -21%             -18%
Final Planning                                          2                0               1               0               3               0%               0%
Certificates of Occupancy                               5                3               0               4              12               33%              20%
Permit Issued                                           0                0               0               0               0               0%               0%
New Construction Starts                                 14               14              42              12             82              -39%             -41%
Other                                                   0                0               0               0               0               0%               0%
Totals                                                 217               79             185             147             628             -18%             -17%
% Of Region                                            35%              13%             29%             23%            100%

Note: New construction starts listed here included alterations, additions, and renovations.

PROJECT PHASE DEFINITIONS
Bidding – Plans and specifications are complete. The owner is taking bids on the prime (general)
contract.
Construction – This is an update to a Start report. There can only be one Start report issued. Work is
underway.
Deferred – Project is on hold and may proceed at a later time.
Pre-Planning – No primary design factor (i.e., architect or design engineer).
Planning – An architect or engineer has been selected for the project, and plans are underway. Initial
approvals have usually been granted and a general description of the project may appear on the report.
Final Planning – The project will go out for bids or construction will start within four months.
Permits – Permit information taken from local municipalities.
Start – A new start means that the general contract has been awarded and work will begin soon. Note:
this includes new projects, as well as alterations, renovations, interior completions and, additions.

Source: Cushman & Wakefield, Inc. The Self Storage Performance Quarterly, a publication of Cushman & Wakefield, Inc., is intended solely for use by paid subscribers.
Reproduction or distribution in whole or part without written permission is prohibited and subject to legal action. Copyright® 2021.

Cushman & Wakefield | Valuation & Advisory                                                                                                                          3
Self Storage Performance Quarterly MARKETS WITH LARGEST NUMBER OF PROJECTS IN THE PIPELINE There was an increase in the number of projects (35) placed on hold this quarter which represents change of 10% less than 4th Quarter 2019. The metropolitan areas with the largest number of projects in all the various phases of the pipeline are: Market No of Projects New York-Newark-Edison 44 Washington-Arlington-Alexandria 31 Miami-Fort Lauderdale-Miami Beach 27 Los Angeles-Long Beach-Santa Ana 19 Atlanta-Sandy Springs-Marietta 18 Phoenix-Mesa-Scottsdale 17 Dallas-Fort Worth-Arlington 17 Riverside-San Bernardino-Ontario 16 Minneapolis-St. Paul-Bloomington 15 Philadelphia-Camden-Wilmington 14 Houston-Baytown-Sugar Land 12 Orlando 10 Boston-Cambridge-Quincy 9 Indianapolis 9 Louisville 9 San Francisco-Oakland-Fremont 9 Source: Cushman & Wakefield, Inc. The Self Storage Performance Quarterly, a publication of Cushman & Wakefield, Inc., is intended solely for use by paid subscribers. Reproduction or distribution in whole or part without written permission is prohibited and subject to legal action. Copyright® 2021. Cushman & Wakefield | Valuation & Advisory 4
Self Storage Performance Quarterly
Pipeline of 4th Quarter 2020
Certificates New
Bidding Construction- Projects Final Permit
Top 50 MSAs Pre-Planning Planning of Construction Other Total
(All Stages) In-Process Deferred Planning Issued
Occupancy Starts
Atlanta-Sandy Springs-Marietta, GA MSA 1 1 2 3 6 5 18
Austin-Round Rock, TX MSA 1 2 1 2 6
Baltimore-Towson, MD MSA 1 1 2 4
Birmingham-Hoover, AL MSA 0
Boston-Cambridge-Quincy, MA-NH MSA 3 2 1 3 9
Buffalo-Cheektowaga-Tonawanda, NY MSA 2 2
Charlotte-Gastonia-Concord, NC-SC MSA 1 1
Chicago-Naperville-Joliet, IL-IN-WI MSA 1 2 3
Cincinnati-Middletown, OH-KY-IN MSA 0
Cleveland-Elyria-Mentor, OH MSA 1 1 2
Columbus, OH MSA 1 1 4 6
Dallas-Fort Worth-Arlington, TX MSA 5 2 2 7 1 17
Denver-Aurora, CO MSA 1 1 2
Detroit-Warren-Livonia, MI MSA 1 1 1 3
Hartford-West Hartford-East Hartford, CT MSA 1 1
Houston-Baytown-Sugar Land, TX MSA 2 1 9 12
Indianapolis, IN MSA 3 5 1 9
Jacksonville, FL MSA 5 2 7
Kansas City, MO-KS MSA 4 1 5
Las Vegas-Paradise, NV MSA 6 6
Los Angeles-Long Beach-Santa Ana, CA MSA 1 8 10 19
Louisville, KY-IN MSA 3 5 1 9
Memphis, TN-MS-AR MSA 1 1 2
Miami-Fort Lauderdale-Miami Beach, FL MSA 6 3 3 12 1 2 27
Milwaukee-Waukesha-West Allis, WI MSA 1 1
Minneapolis-St. Paul-Bloomington, MN-WI MSA 11 4 15
Nashville-Davidson--Murfreesboro, TN MSA 2 2 1 5
New Orleans-Metairie-Kenner, LA MSA 1 1 2
New York-Newark-Edison, NY-NJ-PA MSA 3 4 1 11 21 1 3 44
Oklahoma City, OK MSA 1 1 2
Orlando, FL MSA 1 1 1 4 3 10
Philadelphia-Camden-Wilmington, PA-NJ-DE-MD MSA 3 1 8 2 14
Phoenix-Mesa-Scottsdale, AZ MSA 3 3 2 1 7 1 17
Pittsburgh, PA MSA 1 1
Portland-Vancouver-Beaverton, OR-WA MSA 1 1 4 6
Providence-New Bedford-Fall River, RI-MA MSA 5 1 6
Richmond, VA MSA 2 1 3
Riverside-San Bernardino-Ontario, CA MSA 1 1 12 2 16
Rochester, NY MSA 0
Sacramento--Arden-Arcade--Roseville, CA MSA 1 1 1 1 4
Salt Lake City, UT MSA 1 1
San Antonio, TX MSA 1 1 2
San Diego-Carlsbad-San Marcos, CA MSA 3 3
San Francisco-Oakland-Fremont, CA MSA 1 3 2 3 9
San Jose-Sunnyvale-Santa Clara, CA MSA 4 4
Seattle-Tacoma-Bellevue, WA MSA 1 3 4 8
St. Louis, MO-IL MSA 1 1
Tampa-St. Petersburg-Clearwater, FL MSA 1 3 1 3 8
Virginia Beach-Norfolk-Newport News, VA-NC MSA 1 4 1 6
Washington-Arlington-Alexandria, DC-VA-MD-WV MSA 6 1 14 9 1 31
Top 50 MSAs Total 17 44 24 63 183 2 5 51 389
Other MSAs Total 12 15 9 32 91 1 4 24 188
Non-MSAs Total 6 2 10 23 3 7 51
Total 29 65 35 105 297 3 12 0 82 0 628
Source: Cushman & Wakefield, Inc. The Self Storage Performance Quarterly, a publication of Cushman & Wakefield, Inc., is intended solely for use by paid subscribers.
Reproduction or distribution in whole or part without written permission is prohibited and subject to legal action. Copyright® 2021.
Cushman & Wakefield | Valuation & Advisory 5Self Storage Performance Quarterly
New Construction Starts
The graph below illustrates the historical trend in the total number of new construction starts including
alterations, renovations and interior construction, both within and outside major metropolitan areas.
Total New Construction - Nationwide
180 10,000
160 9,000
8,000
140
74
7,000
120 29
Square Footage (000)
50
Number of Starts
49 6,000
30
100 34
27
36 5,000
37
33
80 27
36
4,000
31
60
105 3,000
95 91 89 85 85
40 83
72 69 2,000
67 65
59
51
20 1,000
0 0
4Q17 1Q18 2Q18 3Q18 4Q18 1Q19 2Q19 3Q19 4Q19 1Q20 2Q20 3Q20 4Q20
Starts New Alterations, Additions, or Renovations Total Square Feet
Total Construction Starts
Top 50 MSAs Secondary Total Nationwide
Markets (Combined)
New Construction 33 18 51
Alterations/Renovations, Interior
18 13 31
Completions
Total Number of Starts 51 31 82
“New” Construction Starts Characteristics
Facility Size (average gross sq ft) 82,364 50,059 70,963
Direct Construction Cost (per sq ft) $88.21 $73.12 $84.45
Value of Direct Construction Cost $239,765,000 $65,884,000 $305,649,000
Total Gross Square Feet 2,718,026 901,066 3,619,092
Source: Cushman & Wakefield, Inc. The Self Storage Performance Quarterly, a publication of Cushman & Wakefield, Inc., is intended solely for use by paid subscribers.
Reproduction or distribution in whole or part without written permission is prohibited and subject to legal action. Copyright® 2021.
Cushman & Wakefield | Valuation & Advisory 6Self Storage Performance Quarterly
CONSTRUCTION STARTS BY METROPOLITAN AREA
Location of New Construction
• STARTS • ALTERATIONS • PLANNED
COMMENTS ON SUPPLY
Construction starts decreased 39% from last quarter and decreased 41% as of 4thQuarter 2019.
According to F.W. Dodge, there have been 427 new starts the last four quarters (new starts includes
new construction and alterations, additions, or renovations).
Source: Cushman & Wakefield, Inc. The Self Storage Performance Quarterly, a publication of Cushman & Wakefield, Inc., is intended solely for use by paid subscribers.
Reproduction or distribution in whole or part without written permission is prohibited and subject to legal action. Copyright® 2021.
Cushman & Wakefield | Valuation & Advisory 7Self Storage Performance Quarterly
Demand
Methodology – SSDS tracks the rental activity of 274,000± self-storage units found in
approximately 440 self-storage facilities every 30-days. To measure the changes in demand, SSDS
tracks several indicators including: The Ratio of Move-Ins to Move-Outs, the Net Absorption of
Units and the changes in total facility’s Potential Gross Income.
Demand Trend
Ratio of Move-Ins : Move Outs
(Same-Store Sample - 440 ± Facilities Nationwide)
65%
60%
55%
50%
45%
40%
35%
Move-Outs Move-Ins
Our findings are reported monthly to subscribers and are summarized in the following tables and
graphs.
Ratio of Move-Ins : Move-Outs – The red line in the graph below illustrates the trend in the ratio
of tenants moving into storage as opposed to those moving out of storage. At the peak of the
season, typically in May and June, the percentage of tenants moving into storage approaches 55%
of the total rental activity.
Net Absorption Ratio – Another measure of demand is to measure the net difference in the ratios
of move-ins to move-outs which is calculated as follows:
Move-ins - Move outs = Net Absorption Ratio
Total Rental Activity Total Rental Activity
Source: Cushman & Wakefield, Inc. The Self Storage Performance Quarterly, a publication of Cushman & Wakefield, Inc., is intended solely for use by paid subscribers.
Reproduction or distribution in whole or part without written permission is prohibited and subject to legal action. Copyright® 2021.
Cushman & Wakefield | Valuation & Advisory 8Self Storage Performance Quarterly
Total Rental Activity is the sum of move-ins and move-outs in a given time period. When the ratio is
positive it is indicative of positive net absorption. The size of the Net Absorption Ratio reflects the gap
or differential between move-ins and move-outs.
The graph below reflects the net difference in the ratio since June 2018. The trend line suggests that
the ratio of move-ins is returning to parity with move-outs. In layman’s terms, when the trend line is
sloping upward, demand is increasing and conversely, a downward sloping line would indicate
weakening demand.
Storage Demand – The following tables illustrate the trends in demand based upon 274,000± self-
storage units found in 440± facilities SSDS tracks every month.
Ratio of Move-Ins to Move-Outs
Net Difference in Ratio
3.0%
2.0%
1.0%
0.0%
-1.0%
-2.0%
-3.0%
1-Year Moving Average
Storage Demand – Nationwide
September 2020 September 2020 3Q20
vs. vs. vs.
August 2020 September 2019 3Q19
Total Rental Activity -8.9% 7.0% 4.5%
Move-Ins -3.4% 16.7% 17.3%
Move-Outs -14.3% -1.8% -6.7%
Source: Cushman & Wakefield, Inc.
Source: Cushman & Wakefield, Inc. The Self Storage Performance Quarterly, a publication of Cushman & Wakefield, Inc., is intended solely for use by paid subscribers.
Reproduction or distribution in whole or part without written permission is prohibited and subject to legal action. Copyright® 2021.
Cushman & Wakefield | Valuation & Advisory 9Self Storage Performance Quarterly
Storage Demand by Region
Jul, Aug, Sep 2020 vs. Jul, Aug, Sep 2019 (Same Store Sample)
East Midwest South West
Total Rental Activity 6.1% 10.8% 3.1% 0.1%
Move-Ins 23.9% 29.3% 14.0% 0.6%
Move-Outs -8.6% -4.5% -6.7% -0.3%
Source: Cushman & Wakefield, Inc.
Physical Occupancy by Region
Sep 2020 vs. Sep 2019 (Same Store Sample)
Nationwide East Midwest South West
Absolute Change 3.4% 4.6% 2.7% 2.7% 4.5%
Source: Cushman & Wakefield, Inc.
Demand as Measured by Changes in Potential Gross Income by Region
Sep 2020 vs. Sep 2019 (Same Store Sample)
Nationwide East Midwest South West
Potential Gross Income 0.9% 0.7% 1.3% -0.6% 8.5%
Source: Cushman & Wakefield, Inc.
Source: Cushman & Wakefield, Inc. The Self Storage Performance Quarterly, a publication of Cushman & Wakefield, Inc., is intended solely for use by paid subscribers.
Reproduction or distribution in whole or part without written permission is prohibited and subject to legal action. Copyright® 2021.
Cushman & Wakefield | Valuation & Advisory 10Self Storage Performance Quarterly
Section III – Market Performance Data 4th Quarter 2020
Self Storage Performance Index
Self-Storage Performance Index® - The SSPI measures the changes in net operating income, taking
into consideration changes in asking rents, physical occupancy and concessions, as well as operating
expenses. It is therefore a reliable and unbiased way of measuring the changes in self-storage’s
operating performance. Each quarter, the Index is reset to reflect the latest changes in expenses from
the prior quarter.
Comment on SSP Index:
The U.S. Self-Storage Performance Index® (SSPI) decreased 2.9% in the 4th Quarter 2020 compared
to last quarter, and is down 6.2% from last year. The SSPI for the 4th Quarter ending December 31,
2020 now stands at 123.3 down 2.9% from the prior quarter’s index (1), and down 6.2% from the 4th
Quarter 2019.
Self Storge Performance Index
145.0
140.0
135.0
130.0 123.3
125.0
120.0
Index
115.0
110.0
105.0
100.0
95.0
90.0
85.0
80.0
Base: 4th Quarter 2003 = 100
Note (1) The SSPI value for the 3rd Quarter 2020 was projected to be 127.8 based on projected operating expenses and pending
receipt of actual expenditures for the 3rd Quarter 2020. The final index value of 127.0 is used in the tables and graphs contained
herein.
Source: Cushman & Wakefield, Inc. The Self Storage Performance Quarterly, a publication of Cushman & Wakefield, Inc., is intended solely for use by paid subscribers.
Reproduction or distribution in whole or part without written permission is prohibited and subject to legal action. Copyright® 2021.
Cushman & Wakefield | Valuation & Advisory 11Self Storage Performance Quarterly
Self Storage Performance Benchmarks
Change
National Benchmarks
4Q19 1Q20 2Q20 3Q20 4Q20 Quarterly Seasonal Annual
Median Rental Rates/Sq.Ft.
Non-Climate-Controlled Units
Ground Level1 $ 1.0000 $ 0.9900 $ 0.9900 $ 0.9995 $ 1.0000 0.1% 0.0% 0.0%
Upper Level $ 1.3500 $ 1.2995 $ 1.2500 $ 1.3000 $ 1.3300 2.3% -1.5% -0.4%
Climate-Controlled Units
Ground Level1 $ 1.2900 $ 1.2500 $ 1.2300 $ 1.2900 $ 1.2900 0.0% 0.0% 0.0%
Upper Level $ 1.2300 $ 1.2100 $ 1.2000 $ 1.2495 $ 1.2900 3.2% 4.9% 1.2%
2
Median Occupancy 90.9% 91.0% 92.0% 93.0% 92.0% -1.0% 1.1% 0.3%
Rent Per Available Sq.Ft. $ 0.8410 $ 0.8305 $ 0.8357 $ 0.8544 $ 0.8406 -1.6% 0.0% 0.0%
1
The differential between ground- and upper-level rental rates is skewed by the disproportionate number of single-level facilities
in the population and sample of self-storage facilities. Facilities with upper-level units tend to be in higher density,
2
The aggregated median physical occupancy statistic is not meaningful by itself. Please refer to the detailed occupancy
statistics by submarket found in Table 3.
Concession Trends
The trends in the types of concessions being offered provide an indication of the direction the markets
are headed. SSDS tracks concessions in 45 different categories. Given the relative strength or
weakness of any given market, the type and number of facilities offering concessions will vary. The
comparative cost of alternative concession programs can be significant. For example:
The cost of a one-month free rent program can vary dramatically based on the duration of a
tenant’s occupancy, and on when, in the course of the tenancy, the “free” month is credited.
Assuming a tenant’s occupancy duration of six months, a one-month concession is a discount
of 1/6th of the asking rental rate. As the occupancy duration shortens, the effective cost of the
discount increases.
Effective Cost – SSDS calculates the effective cost of concessions by category and weights them by
prevalence. The result is an effective benchmark cost of concessions by market and in the aggregate
and should not be confused with the actual cost of concessions in any given market place.
Absolute Change
4Q19 1Q20 2Q20 3Q20 4Q20 Quarterly Seasonal Annual
Facilities Offering
56.8% 60.7% 62.2% 63.1% 66.7% 3.6% 9.9% 2.5%
Concessions
Concession Cost
104.1 107.8 115.0 115.0 121.6 6.6 17.5 4.4
Index.
Source: Cushman & Wakefield, Inc. The Self Storage Performance Quarterly, a publication of Cushman & Wakefield, Inc., is intended solely for use by paid subscribers.
Reproduction or distribution in whole or part without written permission is prohibited and subject to legal action. Copyright® 2021.
Cushman & Wakefield | Valuation & Advisory 12Self Storage Performance Quarterly
SSDS CONCESSION INDEX
Self Storge Concession Index
121.6
125
120
115
110
Index
105
100
95
90
85
80
Base: 4th Quarter 2003 = 100
Trends in Ten Most Popular Concessions
PERCENT OF FACILITIES OFFERING EACH TYPE
Type of Rent Absolute Change (% )
4Q19 1Q20 2Q20 3Q20 4Q20
Concession Quarterly Seasonal Annual
Various Specials 29.87% 33.50% 32.87% 36.63% 38.01% 1.38% 8.14% 2.04%
$1.00 Move-In 6.62% 7.80% 9.99% 7.18% 11.09% 3.91% 4.47% 1.12%
1 Month Free 2.31% 3.66% 4.06% 3.89% 6.00% 2.11% 3.69% 0.92%
1st Month Free 6.17% 5.08% 4.45% 5.50% 3.72% -1.78% -2.45% -0.61%
1/2 Off 1st Month 2.92% 3.02% 3.77% 3.70% 2.17% -1.53% -0.75% -0.19%
Move-In Specials 0.90% 0.86% 1.15% 1.50% 1.52% 0.02% 0.62% 0.16%
1/2 Off 1st 3 Months 1.13% 0.91% 0.91% 0.66% 0.73% 0.07% -0.40% -0.10%
1/2 Month Free 1.21% 0.66% 0.66% 0.62% 0.65% 0.09% 0.43% 0.11%
1/2 Off 1st 2 Months 1.38% 1.37% 1.05% 1.03% 0.59% -0.44% -0.79% -0.20%
1 Month Free w/ One-way 1.60% 1.06% 0.63% 0.58% 0.40% -0.18% -1.20% -0.30%
Other Concessions 2.66% 2.74% 2.70% 1.83% 1.84% 0.01% -0.82% -0.20%
None 43.23% 39.34% 37.76% 36.88% 33.28% -3.60% -9.95% -2.49%
Total 100.0% 100.0% 100.0% 100.0% 100.00%
Source: Cushman & Wakefield, Inc. The Self Storage Performance Quarterly, a publication of Cushman & Wakefield, Inc., is intended solely for use by paid subscribers.
Reproduction or distribution in whole or part without written permission is prohibited and subject to legal action. Copyright® 2021.
Cushman & Wakefield | Valuation & Advisory 13Self Storage Performance Quarterly
Concessions Composition
2%
3% 3% 4% 4%
4%
5% 4% 6%
6%
6%
4% 4% 4%
2%
8% 7% 11% 1/2 Off 1st Month
7% 10%
1st Month Free
1 Month Free
$1.00 Move-In
Various Specials
30% 34% 37% 38%
33%
4Q19 1Q20 2Q20 3Q20 4Q20
Source: Cushman & Wakefield, Inc. The Self Storage Performance Quarterly, a publication of Cushman & Wakefield, Inc., is intended solely for use by paid subscribers.
Reproduction or distribution in whole or part without written permission is prohibited and subject to legal action. Copyright® 2021.
Cushman & Wakefield | Valuation & Advisory 14Self Storage Performance Quarterly
Elasticity in Demand
Due to the sampling techniques, the median is the best measure of overall performance as it excludes
the extremes. However, the elasticity in self-storage demand is best demonstrated by looking at the
average, rather than the median rental rate and physical occupancy data.
AVERAGE ASKING RENTAL RATE AND AVERAGE PHYSICAL OCCUPANCY
$125.00 100%
$120.00
$115.00 95%
Average Physical Occupancy
$110.00
Average Asking Rent
$105.00 90%
$100.00
$95.00 85%
$90.00
$85.00 80%
$80.00
$75.00 75%
(RENTAL RATE FOR 100 SQ. FT. GROUND LEVEL NON-CLIMATE-CONTROLLED UNIT)
Source: Cushman & Wakefield, Inc. The Self Storage Performance Quarterly, a publication of Cushman & Wakefield, Inc., is intended solely for use by paid subscribers.
Reproduction or distribution in whole or part without written permission is prohibited and subject to legal action. Copyright® 2021.
Cushman & Wakefield | Valuation & Advisory 15Self Storage Performance Quarterly
Rent per Available Square Foot
Nationwide
20%
15%
10%
5%
0%
-5%
-10%
Seasonally 12 Month Moving Average Seasonal Change
Source: Cushman & Wakefield, Inc. The Self Storage Performance Quarterly, a publication of Cushman & Wakefield, Inc., is intended solely for use by paid subscribers.
Reproduction or distribution in whole or part without written permission is prohibited and subject to legal action. Copyright® 2021.
Cushman & Wakefield | Valuation & Advisory 16Self Storage Performance Quarterly Operating Performance – By Region The Self-Storage Performance by Geographic Regions and Divisions section contains tables and graphs illustrating the performance of facilities first in each of the four major regions of the country, followed by the performance within the eight divisions. Sub-regional data aggregates are not additive to regional data aggregates as the populations and sample sizes are different in each region and sub- region. NOTE: SSDS reports the operating performance data using the median figures which best measure the central tendency of the data as a whole and are not affected by data extremes. Source: Cushman & Wakefield, Inc. The Self Storage Performance Quarterly, a publication of Cushman & Wakefield, Inc., is intended solely for use by paid subscribers. Reproduction or distribution in whole or part without written permission is prohibited and subject to legal action. Copyright® 2021. Cushman & Wakefield | Valuation & Advisory 17
Self Storage Performance Quarterly

 East Region’s Divisional Performance 4Q20 vs. 4Q19
                                                                                                                                Mideast                Northeast
                                                       Mideast                Northeast
                                                                                                      Nationwide                   vs.                     vs.
                                                       Division                Division
                                                                                                                               Nationwide              Nationwide

 Asking Rental Rates                                     -1.0%                    4.2%                     0.0%                    -1.0%                    4.2%

 Physical Occupancy                                       1.0%                    0.1%                     1.1%                    -0.1%                   -1.0%

 Rent per Available SF                                   -0.7%                    3.3%                     0.0%                    -0.7%                    3.3%

 Percent of Facilities
                                                         73.5%                   67.4%                    66.7%                    6.8%                     0.7%
 Offering Concessions
 Effective Cost of
                                                          8.2%                    7.6%                     7.9%                    0.3%                    -0.3%
 Concessions Factor
 Source: Cushman & Wakefield, Inc.

 Midwest Region’s Divisional Performance 4Q20 vs. 4Q19
                                                                                                                              East North               West North
                                                      East North              West North                                       Central                  Central
                                                       Central                 Central                Nationwide
                                                                                                                                  vs.                      vs.
                                                       Division                Division
                                                                                                                              Nationwide               Nationwide

 Asking Rental Rates                                       4.7%                    1.1%                    0.0%                    4.7%                     1.1%

 Physical Occupancy                                        0.0%                    1.0%                    1.1%                    -1.1%                   -0.1%

 Rent per Available SF                                     3.1%                    2.1%                    0.0%                    3.1%                     2.1%

 Percent of Facilities Offering
                                                         59.2%                    67.8%                   66.7%                    -7.5%                    1.1%
 Concessions
 Effective Cost of
                                                          6.9%                     7.5%                    7.9%                    -1.0%                   -0.4%
 Concessions Factor
 Source: Cushman & Wakefield, Inc.

Source: Cushman & Wakefield, Inc. The Self Storage Performance Quarterly, a publication of Cushman & Wakefield, Inc., is intended solely for use by paid subscribers.
Reproduction or distribution in whole or part without written permission is prohibited and subject to legal action. Copyright® 2021.

Cushman & Wakefield | Valuation & Advisory                                                                                                                         18
Self Storage Performance Quarterly
South Region’s Divisional Performance 4Q20 vs. 4Q19
Southeast Southwest
Southeast Southwest
Nationwide vs. vs.
Division Division
Nationwide Nationwide
Asking Rental Rates 0.7% 1.2% 0.0% 0.7% 1.2%
Physical Occupancy 2.0% 1.0% 1.1% 0.9% -0.1%
Rent per Available SF 0.9% 1.8% 0.0% 0.9% 1.8%
Percent of Facilities Offering
75.1% 61.1% 66.7% 8.4% -5.6%
Concessions
Effective Cost of
9.1% 7.3% 7.9% 1.2% -0.6%
Concessions Factor
Source: Cushman & Wakefield, Inc.
West Region’s Divisional Performance 4Q20 vs. 4Q19
Pacific Mountain
Pacific Mountain
Nationwide vs. vs.
Division Division
Nationwide Nationwide
Asking Rental Rates 2.0% -0.9% 0.0% 2.0% -0.9%
Physical Occupancy 0.0% 3.6% 1.1% -1.1% 2.5%
Rent per Available SF 0.2% 1.0% 0.0% 0.2% 1.0%
Percent of Facilities Offering
65.7% 72.6% 66.7% -1.0% 5.9%
Concessions
Effective Cost of
8.3% 9.1% 7.9% 0.4% 1.2%
Concessions Factor
Source: Cushman & Wakefield, Inc.
Source: Cushman & Wakefield, Inc. The Self Storage Performance Quarterly, a publication of Cushman & Wakefield, Inc., is intended solely for use by paid subscribers.
Reproduction or distribution in whole or part without written permission is prohibited and subject to legal action. Copyright® 2021.
Cushman & Wakefield | Valuation & Advisory 19Self Storage Performance Quarterly
PERFORMANCE BY REGION (4Q20 VS. 4Q19)
Asking Rental Rates
4.0%
3.5% 3.4%
3.0%
2.5%
2.5% 2.3% 2.3%
% Change
2.0%
1.5%
1.5%
1.1%
1.0%
0.5%
0.1%
0.0%
0.0%
East MidWest South West
Median Average
Physical Occupancy
1.4%
1.3%
1.2%
1.0%
1.0%
0.9%
% Change
0.8%
0.7% 0.7%
0.6%
0.4%
0.4%
0.3%
0.2%
0.0%
0.0%
East MidWest South West
Median Average
Rent per Available Square Foot
4.0% 3.7%
3.0% 2.6%
2.0% 1.8%
1.6%
% Change
1.1%
1.0%
0.0%
-0.1%
-1.0%
-1.1% -1.1%
-2.0%
East MidWest South West
Median Average
Source: Cushman & Wakefield, Inc. The Self Storage Performance Quarterly, a publication of Cushman & Wakefield, Inc., is intended solely for use by paid subscribers.
Reproduction or distribution in whole or part without written permission is prohibited and subject to legal action. Copyright® 2021.
Cushman & Wakefield | Valuation & Advisory 20Self Storage Performance Quarterly
Market Conditions
East Region
Sample Size
Total Sample %
Facilities Size Sample
Mideast
5,317 875 16.5%
Division
Northeast
5,101 1,352 26.5%
Division
East Region 10,418 2,227 21.4%
Rental Rate %
Per Sq. Ft. 4Q19 4Q20 Change Rental Rates
Mideast Division 6.00%
Median $1.0200 $1.0100 -1.0%
4.00%
Average $1.0946 $1.0851 -0.9%
Northeast Division 2.00%
Median $1.2000 $1.2500 4.2% 0.00%
Average $1.3051 $1.3760 5.4%
-2.00%
East Region Mideast Northeast East Region
Median $1.1121 $1.1500 3.4%
Median Average
Average $1.1976 $1.2274 2.5%
Physical Absolute Average
Occupancy 4Q19 4Q20 Change Physical Unit Occupancy
Mideast Division
Median 90.0% 91.0% 1.0% 92.00%
Average 90.1% 90.9% 0.8% 91.00%
90.00%
Northeast Division
89.00%
Median 90.6% 90.7% 0.1%
88.00%
Average 91.2% 90.9% -0.3%
87.00%
East Region 4Q18 4Q19 4Q20
Median 90.0% 91.0% 1.0%
Mideast Northeast East Region
Average 90.6% 90.9% 0.3%
Source: Cushman & Wakefield, Inc. The Self Storage Performance Quarterly, a publication of Cushman & Wakefield, Inc., is intended solely for use by paid subscribers.
Reproduction or distribution in whole or part without written permission is prohibited and subject to legal action. Copyright® 2021.
Cushman & Wakefield | Valuation & Advisory 21Self Storage Performance Quarterly
Rent Per Available
Sq. Ft. 4Q19 4Q20 % Change
Mideast Division
Median $0.8422 $0.8359 -0.7%
Average $0.9049 $0.8970 -0.9%
Northeast Division
Median $1.0064 $1.0394 3.3%
Average $1.1024 $1.1469 4.0%
East Region
Median $0.9228 $0.9566 3.7%
Average $1.0015 $1.0192 1.8%
Median
Rent Per Available Sq. Ft . Change
7.00%
4.00%
1.00%
-2.00%
-5.00%
-8.00%
-11.00%
4Q19 1Q20 2Q20 3Q20 4Q20
Mideast Northeast East Region
Average
Rent Per Available Sq. Ft . Change
5.00%
0.00%
-5.00%
-10.00%
-15.00%
4Q19 1Q20 2Q20 3Q20 4Q20
Mideast Northeast East Region
Source: Cushman & Wakefield, Inc. The Self Storage Performance Quarterly, a publication of Cushman & Wakefield, Inc., is intended solely for use by paid subscribers.
Reproduction or distribution in whole or part without written permission is prohibited and subject to legal action. Copyright® 2021.
Cushman & Wakefield | Valuation & Advisory 22Self Storage Performance Quarterly
Change in
Rental Rate Occupancy
Key Seasonal Change in MSAs in East Regions Rent Per
Change Change
Avail. SF
Mideast Division
BAL Baltimore-Towson, MD MSA 0.0% 1.0% 0.3%
CHA Charlotte-Gastonia-Concord, NC-SC MSA -6.3% 0.0% -9.3%
LOU Louisville, KY-IN MSA -5.9% 2.0% -5.3%
RIC Richmond, VA MSA 3.3% 0.0% 4.3%
VIR Virginia Beach-Norfolk-Newport News, VA-NC MSA 4.2% -0.2% 3.0%
WAS Washington-Arlington-Alexandria, DC-VA-MD-WV MSA 6.0% 1.0% 7.5%
CIN Cincinnati-Middletown, OH-KY-IN MSA 3.8% -2.9% -1.9%
PHI Philadelphia-Camden-Wilmington, PA-NJ-DE-MD MSA 1.7% 2.0% 6.0%
Northeast Division
BOS Boston-Cambridge-Quincy, MA-NH MSA 3.2% 2.0% 2.8%
BUF Buffalo-Cheektowaga-Tonawanda, NY MSA -1.0% 6.1% 5.8%
HAR Hartford-West Hartford-East Hartford, CT MSA 10.3% 2.3% 10.7%
NYN New York-Newark-Edison, NY-NJ-PA MSA 10.7% -0.7% 8.6%
PHI Philadelphia-Camden-Wilmington, PA-NJ-DE-MD MSA 1.7% 2.0% 6.0%
PIT Pittsburgh, PA MSA -3.5% 0.0% -5.7%
PRO Providence-New Bedford-Fall River, RI-MA MSA 14.2% 2.0% 16.4%
ROC Rochester, NY MSA 10.0% 4.7% 15.7%
Note : Light Tan shading denotes that MSA is split between NCREIF Regions and or Divisions.
Source: Cushman & Wakefield, Inc. The Self Storage Performance Quarterly, a publication of Cushman & Wakefield, Inc., is intended solely for use by paid subscribers.
Reproduction or distribution in whole or part without written permission is prohibited and subject to legal action. Copyright® 2021.
Cushman & Wakefield | Valuation & Advisory 23Self Storage Performance Quarterly
Market Conditions
Midwest Region
Sample Size
Total Sample %
Facilities Size Sample
East North
7,133 1,408 19.7%
Central
West North
3,760 466 12.4%
Central
Midwest
10,893 1,874 17.2%
Region
Rental Rate %
Per Sq. Ft. 4Q19 4Q20 Change Rental Rates
5.00%
East North Central
4.00%
Median $0.8500 $0.8900 4.7%
Average $0.9071 $0.9315 2.7% 3.00%
West North Central 2.00%
Median $0.8900 $0.8999 1.1% 1.00%
Average $0.9187 $0.9320 1.4%
0.00%
Midwest Region East North West North Midwest
Central Central Region
Median $0.8800 $0.8900 1.1%
Average $0.9111 $0.9317 2.3% Median Average
Physical Absolute
Occupancy 4Q19 4Q20 Change Average
East North Central Physical Unit Occupancy
Median 91.0% 91.0% 0.0% 93.00%
Average 91.1% 91.0% -0.1% 92.00%
West North Central 91.00%
Median 91.0% 92.0% 1.0% 90.00%
Average 91.1% 92.4% 1.3% 89.00%
Midwest Region 88.00%
4Q18 4Q19 4Q20
Median 91.0% 91.0% 0.0%
ENC WNC Midwest Region
Average 91.1% 91.5% 0.4%
Source: Cushman & Wakefield, Inc. The Self Storage Performance Quarterly, a publication of Cushman & Wakefield, Inc., is intended solely for use by paid subscribers.
Reproduction or distribution in whole or part without written permission is prohibited and subject to legal action. Copyright® 2021.
Cushman & Wakefield | Valuation & Advisory 24Self Storage Performance Quarterly
Rent Per Available
Sq. Ft. 4Q19 4Q20 % Change
East North Central
Median $0.7264 $0.7488 3.1%
Average $0.7761 $0.7838 1.0%
West North Central
Median $0.7443 $0.7600 2.1%
Average $0.7692 $0.7909 2.8%
Midwest Region
Median $0.7480 $0.7473 -0.1%
Average $0.7737 $0.7862 1.6%
Median
Rent Per Available Sq. Ft . Change
4.00%
0.00%
-4.00%
-8.00%
-12.00%
4Q19 1Q20 2Q20 3Q20 4Q20
East North Central West North Central Midwest Region
Average
Rent Per Available Sq. Ft . Change
4.00%
0.00%
-4.00%
-8.00%
-12.00%
-16.00%
4Q19 1Q20 2Q20 3Q20 4Q20
East North Central West North Central Midwest Region
Source: Cushman & Wakefield, Inc. The Self Storage Performance Quarterly, a publication of Cushman & Wakefield, Inc., is intended solely for use by paid subscribers.
Reproduction or distribution in whole or part without written permission is prohibited and subject to legal action. Copyright® 2021.
Cushman & Wakefield | Valuation & Advisory 25Self Storage Performance Quarterly
Change in
Rental Rate Occupancy
Key Seasonal Change in MSAs in Midwest Regions Rent Per
Change Change
Avail. SF
East North Cental Division
CHI Chicago-Naperville-Joliet, IL-IN-WI MSA 5.6% 4.0% 8.1%
CIN Cincinnati-Middletown, OH-KY-IN MSA 3.8% -2.9% -1.9%
CLE Cleveland-Elyria-Mentor, OH MSA 1.1% -0.4% 1.1%
COL Columbus, OH MSA 0.0% 1.0% -0.8%
DET Detroit-Warren-Livonia, MI MSA 5.3% -1.0% 3.0%
IND Indianapolis, IN MSA -2.6% -1.0% -6.5%
MIL Milwaukee-Waukesha-West Allis, WI MSA -5.6% -2.0% -7.4%
LOU Louisville, KY-IN MSA -5.9% 2.0% -5.3%
MIN Minneapolis-St. Paul-Bloomington, MN-WI MSA 5.6% 1.0% 9.6%
STL St. Louis, MO-IL MSA -1.2% 6.3% 5.7%
West North Cental Division
KAN Kansas City, MO-KS MSA -2.3% 0.0% -4.1%
MIN Minneapolis-St. Paul-Bloomington, MN-WI MSA 5.6% 1.0% 9.6%
STL St. Louis, MO-IL MSA -1.2% 6.3% 5.7%
Note : Light Tan shading denotes that MSA is split between NCREIF Regions and or Divisions.
Source: Cushman & Wakefield, Inc. The Self Storage Performance Quarterly, a publication of Cushman & Wakefield, Inc., is intended solely for use by paid subscribers.
Reproduction or distribution in whole or part without written permission is prohibited and subject to legal action. Copyright® 2021.
Cushman & Wakefield | Valuation & Advisory 26Self Storage Performance Quarterly
Market Conditions
South Region
Sample Size
Total Sample %
Facilities Size Sample
Southeast 7,066 1,509 21.4%
Southwest 8,320 2,130 25.6%
South Region 15,386 3,639 23.7%
Rental Rate %
Per Sq. Ft. 4Q19 4Q20 Change Rental Rates
Southeast
3.00%
Median $0.9200 $0.9265 0.7% 2.50%
Average $0.9797 $0.9823 0.3% 2.00%
Southwest 1.50%
Median $0.8400 $0.8500 1.2% 1.00%
Average $0.8608 $0.8844 2.7% 0.50%
0.00%
South Region
Southeast Southwest South Region
Median $0.8600 $0.8800 2.3%
Median Average
Average $0.9154 $0.9294 1.5%
Physical Absolute
Occupancy 4Q19 4Q20 Change Average
Southeast Physical Unit Occupancy
Median 90.0% 92.0% 2.0% 94.00%
Average 91.0% 92.1% 1.1% 92.00%
Southwest
90.00%
Median 90.0% 91.0% 1.0%
88.00%
Average 89.9% 90.5% 0.6%
South Region 86.00%
4Q18 4Q19 4Q20
Median 90.0% 91.3% 1.3%
Southeast Southwest South Region
Average 90.4% 91.3% 0.9%
Source: Cushman & Wakefield, Inc. The Self Storage Performance Quarterly, a publication of Cushman & Wakefield, Inc., is intended solely for use by paid subscribers.
Reproduction or distribution in whole or part without written permission is prohibited and subject to legal action. Copyright® 2021.
Cushman & Wakefield | Valuation & Advisory 27Self Storage Performance Quarterly
Rent Per Available
Sq. Ft. 4Q19 4Q20 % Change
Southeast
Median $0.7614 $0.7681 0.9%
Average $0.8206 $0.8153 -0.6%
Southwest
Median $0.6985 $0.7112 1.8%
Average $0.7149 $0.7355 2.9%
South Region
Median $0.7137 $0.7325 2.6%
Average $0.7635 $0.7722 1.1%
Median
Rent Per Available Sq. Ft . Change
6.00%
4.00%
2.00%
0.00%
-2.00%
-4.00%
-6.00%
-8.00%
-10.00%
4Q19 1Q20 2Q20 3Q20 4Q20
Southeast Southwest South Region
Average
Rent Per Available Sq. Ft . Change
4.00%
2.00%
0.00%
-2.00%
-4.00%
-6.00%
-8.00%
-10.00%
-12.00%
4Q19 1Q20 2Q20 3Q20 4Q20
Southeast Southwest South Region
Source: Cushman & Wakefield, Inc. The Self Storage Performance Quarterly, a publication of Cushman & Wakefield, Inc., is intended solely for use by paid subscribers.
Reproduction or distribution in whole or part without written permission is prohibited and subject to legal action. Copyright® 2021.
Cushman & Wakefield | Valuation & Advisory 28Self Storage Performance Quarterly
Change in
Rental Rate Occupancy
Key Seasonal Change in MSAs in South Regions Rent Per
Change Change
Avail. SF
Southeast Division
ATL Atlanta-Sandy Springs-Marietta, GA MSA 1.2% 5.0% 3.6%
BIR Birmingham-Hoover, AL MSA 4.8% 5.0% 10.1%
JAC Jacksonville, FL MSA 11.2% 2.0% 16.3%
MEM Memphis, TN-MS-AR MSA -8.9% 5.0% -5.2%
MIA Miami-Fort Lauderdale-Miami Beach, FL MSA 13.2% 0.6% 10.2%
NAS Nashville-Davidson-Murfreesboro, TN MSA -5.3% -1.0% -8.1%
ORL Orlando, FL MSA 4.6% 3.0% 4.3%
TAM Tampa-St. Petersburg-Clearwater, FL MSA -5.7% 0.8% -5.5%
Southwest Division
AUS Austin-Round Rock, TX MSA 4.5% 1.0% 4.9%
DAL Dallas-Fort Worth-Arlington, TX MSA 3.5% 1.0% 4.6%
HOU Houston-Baytown-Sugar Land, TX MSA -1.2% 1.3% -0.5%
NOR New Orleans-Metairie-Kenner, LA MSA 5.2% 0.0% 5.2%
OKC Oklahoma City, OK MSA 3.2% -1.0% 0.9%
SAT San Antonio, TX MSA -2.3% 1.0% -2.1%
MEM Memphis, TN-MS-AR MSA -8.9% 5.0% -5.2%
Note : Light Tan shading denotes that MSA is split between NCREIF Regions and or Divisions.
Source: Cushman & Wakefield, Inc. The Self Storage Performance Quarterly, a publication of Cushman & Wakefield, Inc., is intended solely for use by paid subscribers.
Reproduction or distribution in whole or part without written permission is prohibited and subject to legal action. Copyright® 2021.
Cushman & Wakefield | Valuation & Advisory 29Self Storage Performance Quarterly
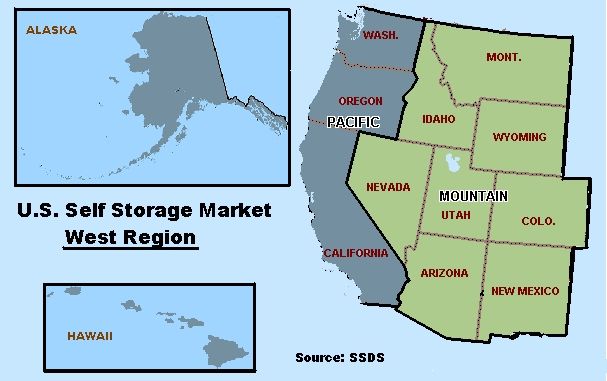
Market Conditions
West Region
Sample Size
Total Sample %
Facilities Size Sample
Mountain 4,565 751 16.5%
Pacific 6,315 1,809 28.6%
West Region 10,880 2,560 23.5%
Rental Rate %
Per Sq. Ft. 4Q19 4Q20 Change Rental Rates
Mountain 2.50%
2.00%
Median $1.0600 $1.0500 -0.9% 1.50%
Average $1.1068 $1.1008 -0.5% 1.00%
Pacific 0.50%
0.00%
Median $1.5000 $1.5300 2.0% -0.50%
Average $1.5979 $1.6045 0.4% -1.00%
-1.50%
West Region
Mountain Pacific West Region
Median $1.3900 $1.3900 0.0%
Average $1.3918 $1.3931 0.1% Median Average
Physical Absolute
Occupancy 4Q19 4Q20 Change Average
Mountain Physical Unit Occupancy
Median 90.0% 93.6% 3.6% 93.00%
Average 90.7% 92.6% 1.9% 92.00%
Pacific 91.00%
Median 92.0% 92.0% 0.0% 90.00%
Average 91.8% 91.8% 0.0% 89.00%
West Region 88.00%
4Q18 4Q19 4Q20
Median 91.3% 92.0% 0.7%
Mountain Pacific West Region
Average 91.4% 92.1% 0.7%
Source: Cushman & Wakefield, Inc. The Self Storage Performance Quarterly, a publication of Cushman & Wakefield, Inc., is intended solely for use by paid subscribers.
Reproduction or distribution in whole or part without written permission is prohibited and subject to legal action. Copyright® 2021.
Cushman & Wakefield | Valuation & Advisory 30Self Storage Performance Quarterly
Rent Per Available
Sq. Ft. 4Q19 4Q20 % Change
Mountain
Median $0.8789 $0.8875 1.0%
Average $0.9255 $0.9195 -0.6%
Pacific
Median $1.2770 $1.2801 0.2%
Average $1.3572 $1.3393 -1.3%
West Region
Median $1.1729 $1.1600 -1.1%
Average $1.1760 $1.1631 -1.1%
Median
Rent Per Available Sq. Ft . Change
4.00%
2.00%
0.00%
-2.00%
-4.00%
-6.00%
-8.00%
-10.00%
4Q19 1Q20 2Q20 3Q20 4Q20
Mountain Pacific West Region
Average
Rent Per Available Sq. Ft . Change
6.00%
4.00%
2.00%
0.00%
-2.00%
-4.00%
-6.00%
-8.00%
-10.00%
4Q19 1Q20 2Q20 3Q20 4Q20
Mountain Pacific West Region
Source: Cushman & Wakefield, Inc. The Self Storage Performance Quarterly, a publication of Cushman & Wakefield, Inc., is intended solely for use by paid subscribers.
Reproduction or distribution in whole or part without written permission is prohibited and subject to legal action. Copyright® 2021.
Cushman & Wakefield | Valuation & Advisory 31Self Storage Performance Quarterly
Change in
Rental Rate Occupancy
Key Seasonal Change in MSAs in West Regions Rent Per
Change Change
Avail. SF
Mountain Division
DEN Denver-Aurora, CO MSA -3.5% 3.6% -2.7%
LVP Las Vegas-Paradise, NV MSA -7.3% 3.7% -6.1%
PHO Phoenix-Mesa-Scottsdale, AZ MSA 8.0% 2.7% 10.6%
SLC Salt Lake City, UT MSA -1.0% -1.0% -5.0%
Pacific Division
LAX Los Angeles-Long Beach-Santa Ana, CA MSA 0.6% 2.0% 1.3%
POR Portland-Vancouver-Beaverton, OR-WA MSA 3.0% -1.0% -4.6%
RIV Riverside-San Bernardino-Ontario, CA MSA 11.5% -1.0% 9.0%
SAC Sacramento-Arden-Arcade-Roseville, CA MSA 3.2% -2.0% -1.4%
SDC San Diego-Carlsbad-San Marcos, CA MSA 6.5% -3.0% 0.4%
SFO San Francisco-Oakland-Fremont, CA MSA 5.3% 2.0% 6.1%
SJS San Jose-Sunnyvale-Santa Clara, CA MSA 10.7% 1.0% 11.0%
SEA Seattle-Tacoma-Bellevue, WA MSA 6.2% 1.0% 8.5%
Source: Cushman & Wakefield, Inc. The Self Storage Performance Quarterly, a publication of Cushman & Wakefield, Inc., is intended solely for use by paid subscribers.
Reproduction or distribution in whole or part without written permission is prohibited and subject to legal action. Copyright® 2021.
Cushman & Wakefield | Valuation & Advisory 32Self Storage Performance Quarterly Operating Performance – By MSA Most Improved and Watch List Markets The intent of the Most Improved and Watch List Markets is to identify those markets that demonstrate the most significant change during the current year. The ranking is based on the highest and lowest aggregate growth scores. The growth score is calculated by adding the percentage change in asking rental rates and physical occupancy for the same period. The aggregate growth score is calculated as a moving average of the quarterly growth scores for the current and three preceding quarters. The higher the aggregate growth scores for a market, the greater the likelihood that facility earnings will improve. Conversely, the lower the aggregate growth score, the greater the likelihood is for adverse change in facility earnings. Hence, our Watch List Markets are those markets with the lowest aggregate growth scores. As of quarter end, the results are as follows: Six Most Improved Markets Aggregate Growth Score 1. Rochester, NY MSA 8.1 2. Phoenix-Mesa-Scottsdale, AZ MSA 7.3 3. Providence-New Bedford-Fall River, RI-MA MSA 6.8 4. Birmingham-Hoover, AL MSA 6.7 5. Hartford-West Hartford-East Hartford, CT MSA 5.7 6. Chicago-Naperville-Joliet, IL-IN-WI MSA 3.9 Watch List Markets (Highest Negative Scores) Aggregate Growth Score 1. Indianapolis, IN MSA -8.1 2. Memphis, TN-MS-AR MSA -7.3 3. Minneapolis-St. Paul-Bloomington, MN-WI MSA -6.3 4. Baltimore-Towson, MD MSA -5.5 5. Houston-Baytown-Sugar Land, TX MSA -5.4 6. Denver-Aurora, CO MSA -5.3 Source: Cushman & Wakefield, Inc. The Self Storage Performance Quarterly, a publication of Cushman & Wakefield, Inc., is intended solely for use by paid subscribers. Reproduction or distribution in whole or part without written permission is prohibited and subject to legal action. Copyright® 2021. Cushman & Wakefield | Valuation & Advisory 33
You can also read