Senseable City Lab : Massachusetts Institute of Technology
←
→
Page content transcription
If your browser does not render page correctly, please read the page content below
Senseable City Lab :.:: Massachusetts Institute of Technology
      This paper might be a pre-copy-editing or a post-print
  author-produced .pdf of an article accepted for publication. For
    the definitive publisher-authenticated version, please refer
           directly to publishing house’s archive system

                            SENSEABLE CITY LAB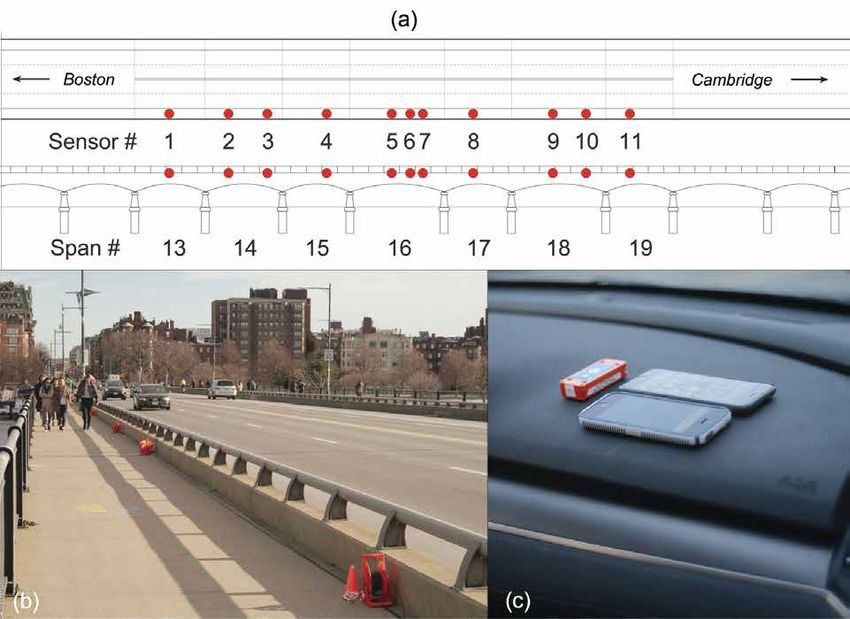
Crowdsensing Framework for
Monitoring Bridge Vibrations
Using Moving Smartphones
This paper discusses new services that can be delivered to urban environments
through big data generated by the public’s smartphones, enhancing the relationship
between a city and its infrastructure.
By T h o m a s J. m a T a r a z z o , P a o l o s a n T i , s h a m i m n. P a k z a d , k r i s T o P h e r C a r T e r ,
C a r l o r aT T i , B a Ba k m oav e n i , C h r is o sg o od , a n d n ige l J aCoB

ABSTRACT | Cities are encountering extensive deficits in                                    hypothesis that smartphone data, collected within vehicles
infrastructure service while they are experiencing rapid                                    passing over a bridge, can be used to detect several modal
technological advancements and overhauls in transportation                                  frequencies of the bridge. The result defines an opportunity
systems. Standard bridge evaluation methods rely on visual                                  for local governments to make partnerships that encourage
inspections, which are infrequent and subjective, ultimately                                the collection of low-cost bridge vibration data, which can
affecting the structural assessments on which maintenance                                   contribute to more effective management and informed
plans are based. The operational behavior of a bridge must                                  decision-making.
be observed more regularly and over an extended period in
order to sufficiently track its condition and avoid unexpected                              KEYWORDS | Big Data; Bridge Management; Crowdsourcing;
rehabilitation. Mobile sensor networks are conducive to                                     Damage Detection; Structural Health Monitoring; System
monitoring bridges vibrations routinely, with benefits that have                            Identification; Vehicular Networks; Wireless Sensor Networks;
been demonstrated in recent structural health monitoring (SHM)                              Intelligent Infrastructure
research. Though smartphone accelerometers are imperfect
sensors, they can contribute valuable information to SHM,                                   The state of U.S. infrastructure can be described as expir-
especially when aggregated, e.g., via crowdsourcing. In an                                  ing: about 40% of bridges are over 50 years old; in each day
application on the Harvard Bridge (Boston, MA), it is shown that                            of 2016, Americans took 188 million trips over structurally
acceleration data collected using smartphones in moving vehicles                            deficient bridges [1], [2]; and the backlog in bridge rehabil-
contained consistent and significant indicators of the first                                itation is estimated at $123 billion. For effective commerce
three modal frequencies of the bridge. In particular, the results                           and transit between U.S. states, federal laws require bien-
became more precise when informatics from several smartphone                                nial bridge condition evaluations. Local governments and
datasets were combined. This evidence is the first to support the                           transportation authorities manage bridges and are respon-
                                                                                            sible for a majority of the funding; they employ inspec-
Manuscript received August 6, 2017; revised December 15, 2017; accepted                     tions, then form and prioritize plans based on engineering
February 9, 2018. Date of current version March 26, 2018. This work was supported in part
by the National Science Foundation under Grant CMMI-1351537 Hazard Mitigation and
                                                                                            assessments and allocated budgets. Yet, modern inspec-
Structural Engineering program, and by a grant from the Commonwealth of Pennsylvania,       tion protocols are sparse in time, and often do not include
Department of Community and Economic Development, through the Pennsylvania Infra-
structure Technology Alliance (PITA). (Corresponding author: Thomas J. Matarazzo.)
                                                                                            sensors or other technological tools, and as a result, can
T. J. Matarazzo and C. Ratti are with MIT Senseable City Laboratory, Cambridge, MA          miss damage indicators and/or lead to improper diagnoses.
02139 USA (e-mail: tomjmat@mit.edu).
P. Santi is with MIT Senseable City Laboratory, Cambridge, MA 02139 USA and also                 A visual inspection is the primary condition evalua-
with Istituto di Informatica e Telematica del CNR, 56124 Pisa, Italy.                       tion method which, while often thorough, is subjective
S. N. Pakzad is with Lehigh University, Bethlehem, PA 18015 USA.
K. Carter, C. Osgood and N. Jacob are with The City of Boston, Boston, MA 02201             by nature and can be impaired by obstructive nonstruc-
USA.                                                                                        tural elements or other physical restrictions [3]–[5]. Even
B. Moaveni is with Tufts University, Medford, MA 02155 USA.
                                                                                            if a compromised structural component is in clear sight
Digital Object Identifier: 10.1109/JPROC.2018.2808759                                       of a professional bridge inspector, early signs of damage,
                                0018-9219 © 2018 IEEE. Personal use is permitted, but republication/redistribution requires IEEE permission.
                                   See http://www.ieee.org/publications_standards/publications/rights/index.html for more information.
                                                                                            Vol. 106, No. 4, April 2018 | Proceedings of the IEEE    577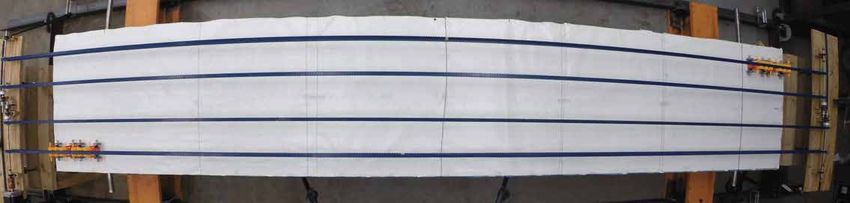
Matara z zo et al. : Crowdsensing Framework for Monitoring Bridge Vibrations Using Moving Smar tphones

e.g., local yielding or microcracking, can be simply unde-          and simplifications on structural behavior are common
tectable to the human eye. More frequent monitoring                 practices (albeit necessary and embedded in design codes).
guarantees higher confidence in structural assessments.             The construction process further contributes to unexpected
Advanced notice of structural deficiencies can save hun-            differences between the design and built system. These two
dreds of millions of dollars in bridge repairs [6] while maxi-      items alone provide adequate justification for establish-
mizing its service and lifecycle. At last, bridge systems must      ing the original (baseline) conditions of a built structure
be resilient, with a transparent and quantifiable reliability if    through inspection and explicit measurements. When the
they are expected to support potentially more annual trips          structure is in service, engineers must accept uncertainties
than ever before through population growths [7], new waves          within operational (everyday) behavior, which are related to
of transportation modes [8], and mobility patterns [9], [10].       variations in usage, material properties, inherent defects,
    Ubiquitous smartphones currently include over a dozen           and environmental conditions among other factors.
sensors and can collectively generate massive amounts of                Data collection and analysis are essential to bridge man-
data that enable insight at the resolution of an individual,        agement systems [18]. Regardless of its age, up-to-date knowl-
defining new opportunities to study human activity. Digital         edge of a bridge’s structural properties and behavior is highly
traces [11], [12] capture human mobility [8], [13], [14], and       valuable for condition forecasts and to effectively manage it
can reveal patterns which help us better understand how             as an asset [19]–[22]. Digital sensors and data acquisition sys-
people use and interact with the urban environment [15],            tems can address the frequency and subjectivity challenges
[16]. Such realizations have highlighted inherent simi-             currently faced in visual inspection methods by facilitating
larities and differences in human tendencies among cities           continual information procurement and measuring physi-
around the world [17]. Finally, through Internet-of-Things          cal phenomena with dedicated devices. Modern sensor net-
(IoT) connectivity, smartphones have an ability to facilitate       work technology is capable of recording ambient vibrations
mass participation and information gathering, as illustrated        of a civil structure, e.g., accelerations; such data captures the
by mobile applications, whose service is dependent on indi-         inherent, cyclic dynamic characteristics of the system, which
vidual user contributions, e.g., Google Maps, Yelp, Waze.           are tied to its physical stiffness and mass, as well as material
    Which services can be delivered to urban environments           properties. An ability to monitor a structure’s operational
                                                                    activity over an extended period is key to tracking its physi-
through big data generated by the public’s smartphones?
                                                                    cal attributes and a cornerstone in preventative maintenance.
Can digital data, produced by ubiquitous smartphone sens-
ing, supply bridge condition information cost-effectively,
thereby creating a new relationship between a city and its          B. Condition Monitoring and Evaluation of Civil
infrastructure? These are some of the questions that are            Structures
investigated in this paper.                                            Structural health monitoring (SHM) [23] research is
                                                                    dedicated to better understanding structural performance
I. I N F ER R I NG ST RUC T U R A L                                 and determining the true conditions of a structural system
PROPERT I E S F ROM V I BR AT ION DATA                              through the analysis of field measurements (sensor data).
                                                                    Modern data acquisition systems consist of a fixed sensor
A. Motivation                                                       network, whose scale and configuration can vary vastly
   Unknowns about the true state of any structural system           depending on the application and technology implemented
begin as early as the design phase, in which assumptions            (some notable deployments are listed in Table 1). While the
          Table 1 Selected SHM Sensor Network Deployments on Large Civil Structures

578 Proceedings of the IEEE | Vol. 106, No. 4, April 2018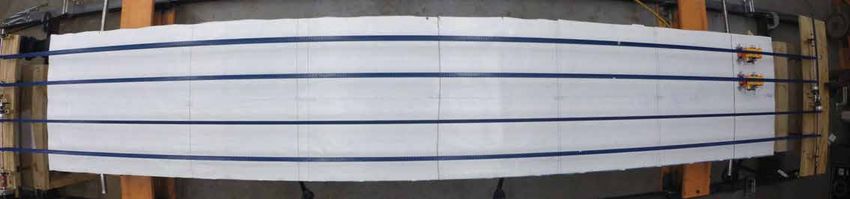
Matara z zo et al. : Crowdsensing Framework for Monitoring Bridge Vibrations Using Moving Smar tphones

SHM field is diverse and continually expanding, its major              The first consequence is the realization that sensor net-
objectives contain three recurring themes: damage detec-           works with a larger spatial coverage have a greater ability
tion (and characterization), prognostics, and risk assessment      to collect data near a damaged location, which permits
[5], which in terms of asset management, correlate with            identification. Second, DID methods require data from an
long-term performance tracking, inspection optimization,           undamaged reference structural state in order to properly
and decision-making assistance. Structural deterioration           characterize an unknown state (a statistically significant
is immeasurable in itself, although through comparisons            difference between damage sensitive features indicates
over time, distress indicators are inferable [24]. To achieve      damage). Regular and archival monitoring data enable con-
explanatory insights from collected data sets, computational       dition evaluations to occur at a rate and detail that surpass
procedures have been designed to manifest special features         modern visual inspection protocols, thereby increasing the
and metrics, often utilizing statistical frameworks and            likelihood that structural damage is properly identified
mathematical models.                                               while it is treatable.
    System identification (SID) [30], the determination of
structural dynamic properties from vibration data, is one of
the most matured and repeatable processes available for civil      C. Drawbacks of the Fixed Sensor Network Paradigm
structures. Over the past two decades, a plethora of tech-             Data collection for SHM has relied on fixed sensor net-
niques have emerged, with varied algorithmic complexities.         works, which must be designed, installed, and maintained
Many are founded on time series concepts, e.g., autore-            by experienced personnel. These networks can be as simple
gressive [31], or state-space [32]–[34] models, and recently       or elaborate as the budget allows. For instance, long-term
some have incorporated machine learning [35] or Bayesian           and cyber–physical monitoring systems [49], [50] empower
[36] frameworks. Furthermore, studies on the mathemati-            regular monitoring and provide an ability to view structural
cal precision [37], [38] of modal identification techniques        performance metrics in real time; yet, while comprehen-
as well as long-term applications have allowed for a better        sive, the high costs associated with equipment and mainte-
understanding of robustness, i.e., how the results may be          nance mean that this highly technological approach is only
influenced by deterministic and stochastic variables. A great      practical for a select number of bridges (usually those newly
deal of the sophistication in SID methods can be attributed        constructed, or in critical condition). City departments of
to the relative ease in observing the resonances of a dynamic      transportation do find importance in collecting response
system from output-only vibration data. As an example, it          data from the bridges they manage; however, they operate
is possible to reveal structural modal (resonant) frequen-         under a limited budget, which cannot afford the procure-
cies from a single data set through simple frequency domain        ment and maintenance of a measurement system for each
approaches, e.g., Fourier transforms. Structural damage, on
                                                                   bridge. It seems as though the adoption of high tech moni-
the other hand, is often a highly localized spatiotemporal
                                                                   toring systems in SHM may unintentionally accelerate the
phenomenon that is not omnipresent in such sensor data.
                                                                   disconnect between bridge inspection protocols and the
    The vibration characteristics of a structural system are
                                                                   data-driven tools available.
permanently altered by damage, which can initiate after a
                                                                       Whether the goal is SID or DID, the size and arrange-
particular event or develop gradually over time. At any rate,
                                                                   ment of the fixed sensor network plays a crucial role in the
a local stiffness reduction, such as a crack, will affect struc-
                                                                   informatics that can be extracted. The need for optimal sen-
tural parameters or modal properties to some degree, e.g.,
decrease in frequency, increase in damping, and modified           sor placement and compressed sensing strategies in SHM
mode shapes [39]. Damage identification (DID) strategies           have suggested that while a larger fixed sensor network is
have a clear belonging within frameworks for risk assess-          known to provide advantageous information in comparison
ment and bridge management. Accordingly, in SHM, there             to smaller ones, the costs associated with such systems can
is considerable ongoing attention on the detection, localiza-      be prohibitive to research budgets. Fig. 1 illustrates how
tion, and quantification of structural damage (the DID trio)       fixed sensor network parameters impact SID results. In par-
using sensor network data [38]–[43]. Because damage is a           ticular, the number of sensors deployed restricts the struc-
broad and complex entity that for all practical purposes is        tural mode shape information that may be determined; if
immeasurable, more effort is needed to expose its attributes.      only few sensors are available, higher order mode shapes
Many techniques aim to extract damage sensitive traits from        cannot be estimated accurately—a problem that is analo-
the data via signal processing, feature extraction [45], [46],     gous to aliasing in discrete signal processing. High fidelity
time-series methods [40], [47], or statistical classification/     spatial information is more valuable in DID, e.g., techniques
clustering [23]. Furthermore, damage tends to be highly            based on mode shape curvature [51], [52], since damage-
localized (and potentially sparse) in space, and generally, its    prone areas cannot be known a priori and higher order
presence does not necessarily impact structural modal prop-        structural modes have shown to have a higher sensitivity to
erties to an extent that is distinguishable from operational       damage, even though dynamic properties are in general not
variation (although a counterexample is presented in [48]).        good damage features.

                                                                    Vol. 106, No. 4, April 2018 | Proceedings of the IEEE   579
Matara z zo et al. : Crowdsensing Framework for Monitoring Bridge Vibrations Using Moving Smar tphones
1) match the capabilities available with methods designed
for fixed sensor data; and 2) illustrate the advantageous
spatial information that is exclusive to sensors with mobil-
ity. Recently, the extended structural identification using
expectation maximization (STRIDEX) method [62], [63]
achieved these goals while proving that one mobile sensor
could provide spatial information comparable to 120 fixed
sensors.
In contrast to a network of fixed sensors, the quantity
of mobile sensors does not inherently restrict the spatial
information that is captured. This superior feature is dem-
onstrated experimentally, using the testbed described in
[62]. Fig. 2(top) shows two mobile sensor network setups,
containing two and four sensors, respectively. The mobile
sensor cars containing accelerometers traversed the span
Fig. 1. Illustration depicting the limitations in spatial information of the beam (3048 mm), then returned to their starting
provided by fixed sensor networks. In general, N sensors
distributed along a dimension can successfully reconstruct mode
positions, at a speed of 114 mm/s, while sampling at 280
shapes having no more than N − 1 points of inflection. For example, Hz. The structural modal properties (frequencies, damp-
five sensors provide sufficient resolution for a lower order mode ing ratios, and mode shapes) of the specimen were deter-
shape, but are inadequate for higher order mode shapes, i.e., those mined through SID using STRIDEX and are displayed at
with five or more points of inflection.
the bottom of Fig. 2. The high-resolution mode shapes
illustrate how relatively few moving sensors can provide
D. Mobile Sensor Networks as a Scalable Monitoring rich spatial information, which can support DID. With
Solution mobile sensing, dedicated devices are no longer needed;
Over the past decade, there has been interest in the therefore, the deployment and maintenance needs of a
problem of identifying structural properties, i.e., SID, sensor network are reduced substantially. The benefits
from mobile sensor network data. Mobile sensor networks are twofold: fewer sensors provide more spatial infor-
are attractive because they address the shortcomings of mation, and can scan several structures more quickly.
fixed sensor networks by achieving a dense spatial cover- Mobile sensor networks are conducive to regular bridge
age using fewer sensors [53], [54]. In fixed sensor networks, monitoring, which is essential to a bridge management
each sensor is dedicated to a particular point on the struc- system.
ture. Mobile sensors scan structural vibrations, making
it possible to measure vibrations from multiple bridges, II. SM A RT PHON E S A S MU LT I PU R P OSE
using the same equipment, within a short time frame. I N F R A ST RUC T U R E SC A N N ER S
In essence, a single mobile sensor can provide informa-
tion comparable to that provided by numerous fixed sen- A. Civic Data Collection Through Human Mobility
sors. Studies have proven that mobile sensors can capture Mobile sensor data contain a denser spatial resolution
modal property information [55]–[57]. In particular, it has when compared to that collected by an equivalent num-
been shown that the fundamental frequency of a bridge ber of distributed fixed sensors. In the digital age, high
can be detected from a vibration sensor mounted in a mov- smartphone ownership levels in urban hubs have reduced
ing vehicle [58]–[61]. These results suggest that with the the need to procure dedicated devices in order to densely
proper analytical tools, it may be possible to shift data cover a city. Specifically, smartphones carried by humans
dependence from a dense fixed sensor networks to mobile create a large-scale mobile sensor network. Throughout
sensor networks, which are simpler to implement and have hundreds of millions of daily trajectories, humans scan city
lower setup costs. infrastructure routinely and comprehensively. Numerous
While innovative, these methods have not yet provided studies have illustrated the many ways in which the analy-
an ability to estimate bridge modal properties in the field ses of such big data streams can generate latent informa-
with a performance comparable to the current standard, tion that is useful to the public, the urban planning com-
which is SID using fixed sensor data. Simultaneously, in the munity, and local government entities [64], [65]. Even
digital age, an identification technique for mobile sensor before mobile phones reached peak levels in technological
data with consistent and accurate estimates in practice can capabilities and ubiquity, researchers have been involved
significantly impact the rate and scale at which vibration in the development of data collection, processing, and
data are collected and analyzed. The current state of the art management systems to compute real-time traffic met-
in modal identification methods for mobile sensors aims to rics based on aggregated vehicle trips [54], [66], [67]. In
580 Proceedings of the IEEE | Vol. 106, No. 4, April 2018Matara z zo et al. : Crowdsensing Framework for Monitoring Bridge Vibrations Using Moving Smar tphones
Fig. 2. Experimental mobile sensing platform at Lehigh University. Three structural modes, complete with frequency (f ), damping (ζ ), and
mode shapes, are identified from wireless accelerometers in moving pulley-driven cars. High-resolution mode shapes are extracted using
the STRIDEX SID method. Until recently, this has traditionally required a dense distributed fixed sensor network.
Fig. 3, the pervasive sensing of smartphones in a city is to guarantee a service. In a commercial sense, this recursive
illustrated for Boston using data from the users of a par- relationship can potentially obstruct the growth of newly
ticular smartphone app. Detailed map inferences can be launched crowdsourcing initiatives: if the user is not pro-
extracted from sparse and noisy GPS traces collected from vided a service, what is the incentive to participate? For local
within vehicles—as data accumulates over longer collec- governments, crowdsourcing offers new insights on human
tion periods, the maps gain precision [68]. activity and a channel for civic interaction. In a smart cities
Currently, similar tools [69] are integrated into smart- landscape, automatic diagnoses of complex urban problems
phone navigation applications, which provide advanced fea- could contribute to a better quality of life for residents.
tures to its users, e.g., route recommendations and real-time
traffic updates. This example follows a basic principle of B. Applications in the City of Boston
crowdsourcing: each user contributes unique, presumably
useful data with the corollary that as user levels increase, The Mayor’s Office of New Urban Mechanics in the City
the quality and value of the collective information also of Boston (henceforth “The Office”) embraced big data as
improve. The result is that crowdsourcing schemes may ini- an opportunity to better maintain urban infrastructure and
tially require a certain amount of regular user contributions enhance public safety. In 2012, with industrial and academic
support, The Office launched their first crowdsourcing pro-
gram called Street Bump in response to road surface problems,
mainly potholes, which represent a longstanding quality-of-
life issue experienced by city residents as well as a road main-
tenance costs [70]. The smartphone application transmits
the accelerometer and GPS measurements into an anomaly
detection and decision support system [71]. The objective
was to locate actionable bumps in city streets, a classification
which would help Boston manage repairs. While the identi-
fication of road surface features from sensors in vehicles is
not a new concept [72]–[74], this was perhaps the first initi-
ated by the local government to address an urban problem.
Fig. 3. Representation of human mobility in Boston, produced from
Ultimately, the program did not succeed as a robust pothole
smartphone app user data. Residents habitually scan the city using finder in itself, as it was difficult to distinguish a pothole from
smartphone sensors, at a high spatial resolution. other conditions, e.g., sunk casting, with high certainty. Yet,
Vol. 106, No. 4, April 2018 | Proceedings of the IEEE 581Matara z zo et al. : Crowdsensing Framework for Monitoring Bridge Vibrations Using Moving Smar tphones
this project demonstrated that big data can indeed provide a addressing complex urban issues. Big data can help stream-
distinct service to the city. Rather than focusing on potholes, line improvements to physical infrastructure; it can also
these data sets can be used to cost-effectively evaluate ride ignite individual probes for positive social change through-
smoothness in a more generic sense, e.g., rideability. In the out the community. Over a longer term, information from
long term, such metrics could be linked with the pavement crowdsourced data can help shape innovative policies that
condition indicator that is currently included in MassDOT are mindful of sociotechnical trends.
Highway Division asset management reports.
In 2015, The Office partnered with Boston’s Vision Zero
C. Measuring Vibrations in Civil Engineering Using
Task Force and Cambridge Mobile Telematics to introduce
Smartphones
the Boston’s Safest Driver smartphone application as part of
an effort to eliminate fatal traffic crashes by 2030. Through Smartphones simplify the collection and distribution of
Vision Zero, Boston has outlined a multifaceted action plan sensory data but they measure imperfectly. The sensors that
that includes education and enforcement programs to reduce come standard in smartphone models were not designed
distracted and impaired driving. The key offering of the app for scientific applications; they were selected based on fac-
is a personalized evaluation of the user’s driving behavior tors such as functionality, power consumption, size, and
based on speed, acceleration, braking, cornering, and phone cost. Accelerometers in smartphones are subject to some
distraction [75]. The user receives an objective score based basic signal processing problems, e.g., temporal jitter, high
on his/her activity, which provides a unique opportunity for noise, clipping, missing data, etc. [76]–[78], which can limit
self-reflection and elicits social dialogues about safe driving overall reliability. Nonetheless, the resulting data have been
habits. Since the program’s commencement, several compe- shown to supply information that is useful to civil engineers,
tition cycles have completed, throughout which prizes were especially when part of a crowdsourcing campaign.
awarded weekly to top drivers, the most improved scores, As previously mentioned, mobile sensor networks for
new users, as well as those who chose car-free trips. The app SHM have shown promise, yet lack successful demonstra-
has recorded over 200 000 trips with user levels near 1800 tions on large-scale bridges in the urban environment.
on average and about 5000 during competitions. The data Recent studies have corroborated the performance of smart-
indicated reductions in higher risk actions for the top 25% phone accelerometers (while stationary) in civil engineer-
of users. In addition, speeding decreased by 35% and phone ing applications on structures in a controlled setting and
distraction dropped 47%. These preliminary results suggest through comparisons with calibrated reference sensors. It
that users adopted safer driving habits when they knew their has been shown that an individual smartphone can measure
activity was being monitored. Aside from helping the public accelerations with an accuracy that captures fundamental
drive more safely, this program instills notable social bene- signal properties, such as amplitude and frequency content
fits. Whether an individual uses this tool as a metric for self- [79], [80].
improvement or to compete with friends, the social aspects With a long-term goal of crowdsourcing structural vibra-
of Boston’s Safest Driver are highly valuable features that lead tion data, recent work has looked at stationary smartphones
to conversations in communities about safe driving. and participation from pedestrians. In an application on
It remains challenging to attract a large user base and an indoor pedestrian bridge, spatiotemporally mixed data
keep them engaged in certain apps. The user levels of other were collected by consecutively placing one smartphone
smartphone apps managed by Boston indicate that incentive at eight positions; then, the frequency domain decomposi-
and service are primary factors. For example, the ParkBoston tion (FDD) technique [81] was implemented to find three
app facilitates an everyday city activity by allowing its natural frequencies, whose corresponding mode shapes
users to pay for metered parking directly from their mobile were constructed after combining phase information from
devices. Accordingly, the ParkBoston app was downloaded reference results [82]. Additional studies have focused on
over 400 000 times within its first two years. Comparatively, reducing the influence of certain undesirable features of
the services provided by apps such as Street Bump or Boston’s smartphone data so that they may be better suited for SHM
Safest Driver may be perceived as amenities with little imme- methods available for fixed sensor data [83]. The biome-
diate value, making it is difficult to quickly attain mass user chanical effects of a standing human were isolated to mini-
levels. One way to mitigate this effect would be to merge mize pedestrian-induced vibrations [84]. Gyroscope and
existing apps that utilize human mobility and similar sensor magnetometer sensors were utilized to correct misaligned
readings into a centralized hub or multipurpose app. signals from phones fixed to a structure [77].
A municipality that initiates crowdsourcing programs In an average sense, signal features of crowdsourced smart-
may be able to develop a reputation as a proactive problem phone data can more closely match estimates from a higher
solver. Through the Street Bump and Boston’s Safest Driver quality accelerometer. Recent applications using smartphones
programs, the City of Boston engaged its residents, dem- as seismometers have suggested that, in some applications,
onstrated the capabilities of smartphones for crowdsourc- it is possible to overcome measurement fidelity problems by
ing civic data, and explored how big data can be an asset to aggregating heterogeneous data sets [76], [85], [86].
582 Proceedings of the IEEE | Vol. 106, No. 4, April 2018Matara z zo et al. : Crowdsensing Framework for Monitoring Bridge Vibrations Using Moving Smar tphones
III. BR ID GE F R EQU ENC Y DET EC T ION
USI NG SM A RT PHON E S I N PA S SI NG
V EHICL E S: A PPL IC AT ION ON T HE
H A RVA R D BR ID GE
A. Objectives and Scope
This section investigates a real-world example of moni-
toring bridge vibrations using a smartphone in a moving
vehicle, which is applicable to an individual’s daily com-
mute. The Harvard Bridge is a 25-span (five continuous sec-
tions), haunched steel girder bridge with a total length of
about 660 m; it connects Boston and Cambridge over the
Charles River in Massachusetts, USA and serves on the order
of 30 000 daily trips. The study has three main objectives:
Fig. 5. Power spectral density (PSD) estimates and ERA-NExT
1) estimate modal frequencies of the Harvard Bridge
stabilization diagram (determined using the SMIT program) based on
using a traditional fixed sensor network and SID fixed sensor data set #18. The solid lines are the PSD estimates for
procedure; four sensors (6, 7, 9, and 11) with power levels indicated on the left
2) demonstrate the capabilities of an individual smart- ordinate. The black markers (circles and crosses) superposed on the
plot indicate convergence at a particular model order (right ordinate)
phone accelerometer in the context of a passing
during the ERA-NExT process. Vertical trends of convergence markers
vehicle; confirm structural modal properties in the data. In other words, these
3) evaluate the prominence of the bridge frequencies in frequency peaks can be explained by the bridge dynamic system.
aggregate mobile sensing data collected using smart- Note an absence of a convergence marker trend does not necessarily
reject a peak as a structural modal frequency. It is instructive to
phones in moving vehicles.
process additional data sets to confirm further modes.
The mobile sensor data considered in the application
are a limited representation of the variety presented by a
smartphone-based crowdsensing platform. In a true wide- B. Frequency Identification of the Harvard Bridge
spread crowdsourced implementation, the vehicle system, Using a Fixed Sensor Network
vehicle speed and path, smartphone model, and its position A network of 11 wired accelerometers (PCB 393B04)
within the vehicle are all influential variables. This applica- was distributed across seven spans (13–19) of the Harvard
tion considers a fairly large data set which includes variety Bridge. The sensor network [pictured in Fig. 4(a) and (b)]
among vehicles and sensors. Yet, a limited range of vehicle recorded traffic-induced bridge vibrations on the east side-
speeds and only one sensor position (flat on dashboard) are walk at 2048 Hz during two consecutive high-traffic hours.
considered. The measured accelerations are expected to have cap-
tured the operational behavior of the bridge such that the
dominant frequencies in the data are representative of the
bridge’s structural dynamical properties.
The Harvard Bridge is not a simple structure; it comprises
five continuous sections. The deck joints introduce dynam-
ics that are more complex than those of a fully continuous
bridge, e.g., closely spaced modes. Yet, it is difficult to under-
stand its behavior in full with an unknown excitation and a
limited number of fixed sensors. The power spectral density
(PSD) estimates (solid colored lines in Fig. 5) show several
frequency regions with significant power levels, each suggest-
ing the presence of a structural modal frequency. A few of
these regions include smaller peaks that are consistent among
the sensors, e.g., just below 3 Hz. At a first glance, it appears
that the bridge has some closely spaced modal frequencies
but overall this is inconclusive. A formal SID method must
Fig. 4. (a) Plan and elevation views of a segment (spans 13�19) be implemented to determine which of the peaks in the PSD
of the Harvard Bridge with fixed sensor network layout.
(b) Photograph of the fixed sensors on the East side of the Harvard
estimates correspond to structural modal frequencies.
Bridge. (c) Photograph of the reference sensor and smartphones on The ERA-NExT method [87] was selected for SID
a vehicle dashboard. using the SMIT computer program [88]. For each data set,
Vol. 106, No. 4, April 2018 | Proceedings of the IEEE 583Matara z zo et al. : Crowdsensing Framework for Monitoring Bridge Vibrations Using Moving Smar tphones
ERA-NExT produced a stabilization diagram, whose purpose sensor data were recorded at 100 Hz using the Sensor Play
is to highlight the peaks that are associated with structural iOS app, which includes gyroscope and GPS measurements.
modes. The standard method is to view the identification In general, high traffic conditions create special circum-
results for increasing SID model orders and measure the con- stances that can improve data quality: larger bridge vibra-
sistency among the estimates using convergence criteria. In tion amplitudes, slower vehicle speeds, and longer data sets.
Fig. 5, a stabilization diagram is superposed on the PSD esti- Large bridge excitation levels can increase the presence of
mate to illustrate this process for one data set (#18). The right bridge vibration signatures, e.g., modal properties, within
ordinate of the plot indicates the model order (even numbers the mobile sensor data. Slower vehicle speeds provide more
2 through 200). The vertical trends of the black convergence samples per location (higher spatial resolution) and reduce
markers confirm specific structural modal frequencies. noise generated by poor pavement conditions. Finally, a
The participation (presence) of individual structural larger number of observations of the involved dynamical sys-
modes within the measurements is dependent on the dynamic tems will better support the solutions to the inverse problem.
loading conditions, e.g., traffic on a bridge. In most cases, the
input excitation of the structure cannot be measured and as a D. Frequency Analyses of Aggregate Acceleration
result, multiple sets of structural response data are analyzed. Data
In this study, the bridge’s modal properties were evaluated by The mobile sensor data were analyzed using simple
reviewing 18 stabilization diagrams, each corresponding to frequency domain techniques to exemplify the content
one 6-min data set. Afterwards, three dominant frequencies within raw, or minimally processed, smartphone accelera-
were identified as 2.05 Hz, 2.66 Hz, and 2.88 Hz; these are tion measurements. The methods here are “model-free”;
only a few of the modal frequencies of the Harvard Bridge. they do not require spatial information to function and are
applicable to unsynchronized data sets. It is expected that
C. Mobile Sensing Experiments on the Harvard the inclusion of additional sensor data, e.g., GPS, gyroscope,
Bridge and/or the implementation of a more elaborate technique,
designed specifically to process mobile sensor data for SID
Regarding the mobile sensor data, acceleration measure- or DID, could extract further detailed information.
ments were collected using two smartphones (iPhone 5S and First, as a comparison between the frequency content
iPhone 6) and a reference sensor (Mide Slam Stick C). In each recorded among the various sensors, a short-time Fourier
vehicle trip, the sensors were mounted on the dashboard of transform (STFT) was implemented to display time-depend-
the vehicle [illustrated in Fig. 4(c)] and were triggered manu- ent frequency signatures. Fig. 6 displays three STFT plots
ally. The data includes 42 trips, mixed between two vehicles for the longest data set (#11, 464 s), which was collected
(Honda CRV and Honda Civic) over the bridge at slow speeds within vehicle 1. During heavy traffic, the vehicle traveled
during rush hour (further details in Table 2). Smartphone at a slower average speed (stop-and-go conditions), which
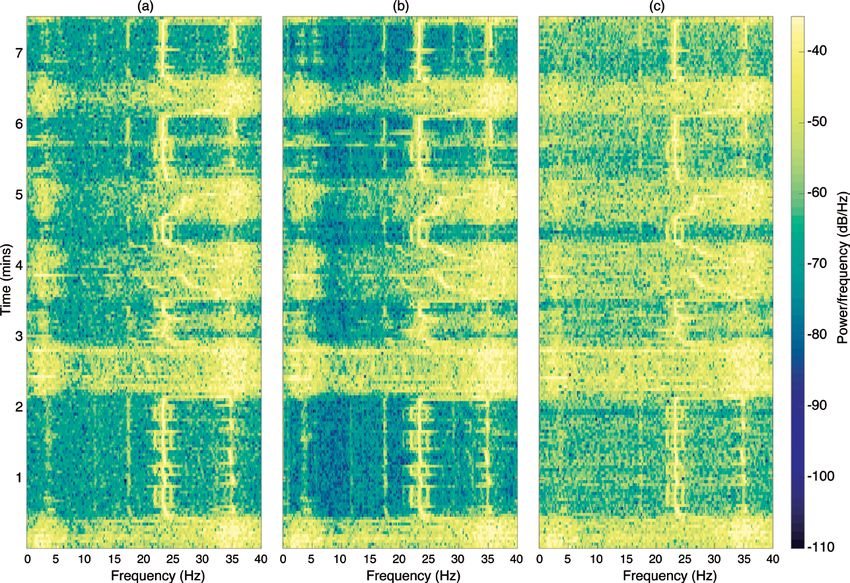
Fig. 6. Short-time Fourier transform (STFT) of mobile sensor data collected within vehicle 1, traveling southbound over the Harvard Bridge
during heavy traffic (trip #11): (a) reference sensor (Mide Slam Stick C); (b) smartphone 1 (iPhone 5S); and (c) smartphone 2 (iPhone 6).
584 Proceedings of the IEEE | Vol. 106, No. 4, April 2018Matara z zo et al. : Crowdsensing Framework for Monitoring Bridge Vibrations Using Moving Smar tphones
Table 2 Summary of Vehicle Trips Over the Harvard Bridge The method used to evaluate dominate frequencies and
aggregate results is described graphically in Fig. 7. Local max-
ima of the PSD estimates were detected and evaluated using
a generic peak-picking method. In this study, the prominence
of a peak was evaluated as the power level at the peak of inter-
est minus the lowest power level of the adjacent local minima.
With this relative measure, contributions from nearby peaks
resulted in a data set about three times longer than usual. can be removed. These values were aggregated and divided into
Vertical trends in Fig. 6 indicate consistently dominant 12 categories based on variable combinations (smartphone 1,
frequencies in the signal over time, which are expected to smartphone 2, both smartphones, reference sensor, vehicle 1,
reveal characteristics of the dynamic vehicle-bridge system. vehicle 2, and both vehicles). Finally, the values in each cat-
Overall, Fig. 6 shows similar frequency trends among the egory were normalized to have a maximum value of 100.
different sensors. The smartphone sensors were able to cap- The normalized cumulative prominences (hereafter
ture temporal frequency patterns which matched those of “peak scores” for simplicity) are shown versus frequency in
the reference sensor, further supporting the performance Fig. 8. For each category, detection thresholds are defined
of the smartphone accelerometers. This plot suggests that based on the 95-percentile of the peak score distribution
the information retrieved through individual vehicle scan- (Fig. 7, panel 4); the thresholds are indicated as red dashed
ning may not be significantly limited by the capabilities of horizontal lines in the plots. Simultaneously, the Harvard
accelerometers available in smartphones, i.e., qualitatively, Bridge modal frequencies—determined using fixed sen-
smartphones can capture accurate frequency content. sor data—are included as colored vertical bars, each with
To gain further insight on the prominence of particu- a width of ±3%. The P and R values in the top-left corner
lar frequencies in the mobile sensor data, power spectral display the precision and recall metrics for each data cat-
density (PSD) estimates were computed for the vertical egory [90]. Precision is the ratio of true positives to the total
acceleration channels using Welch’s method of averaged number of positives; it measures the relevancy of the signifi-
periodograms [89]. These plots describe the signal’s power cant peak scores (i.e., the positives). Precision values below
levels at each frequency over the entire trip rather than 50 indicate a larger portion of false positives. Recall is the
specific instants. The basic hypothesis here is that bridge ratio of true positives to the sum of true positives and false
resonant frequencies will have a persistent presence in the negatives; it measures the completeness of the relevant peak
vehicle trips, despite data heterogeneity. scores (those at the bridge frequencies). For example, recall
(1) Acceleration Data (2) PSD Estimation
0.4 -25
0.3
-30
Power/frequency (dB/Hz)
0.2
Acceleration (g)
0.1
-35
0
-40
-0.1
-0.2
-45
-0.3
-0.4 -50
0 10 20 30 40 50 60 0 1 2 3 4 5 6 7 8 9 10
Time (sec) Frequency (Hz)
(3) Peak Detection and Evaluation (4) Aggregation and Classification
-26
1
-28
0.9
-30
CDF
Power/frequency (dB/Hz)
0.8
-32
0.7
-34
0.6
-36 0 10 20 30 40 50 60
Peak Score
-38 100
Peak Score
-40 80
60
-42
40
-44
20
-46
0 1 2 3 4 5 0
0 1 2 3 4
Frequency (Hz) Frequency (Hz)
Fig. 7. Spectral peak evaluation process utilized for the mobile sensor data. Acceleration data (1) is processed to estimate the PSD (2).
Peaks in the PSD estimates are detected (3) and evaluated using a ªpeak scoreº (a metric that can be defined per application). The peak
scores are aggregated (4) and statistically significant values can be identified using empirical cumulative distribution functions.
Vol. 106, No. 4, April 2018 | Proceedings of the IEEE 585Matara z zo et al. : Crowdsensing Framework for Monitoring Bridge Vibrations Using Moving Smar tphones
Fig. 8. Normalized cumulative peak prominences (referred to here as ªpeak scoresº) at each frequency for sensor data collected in a
vehicle traveling over the Harvard Bridge. In each data subset, the peak scores above the horizontal dashed line are in the upper five
percentiles. Three bridge frequencies identified from the fixed sensor data (2.05 Hz, 2.66 Hz, and 2,88 Hz) are highlighted as colored
vertical bands, each enclosing ±3%. The data are divided into 12 subsets: (a) smartphone 1 and vehicle 1; (b) smartphone 1 and vehicle 2;
(c) smartphone 1 and both vehicles; (d) smartphone 2 and vehicle 1; (e) smartphone 2 and vehicle 2; (f) smartphone 2 and both vehicles;
(g) both smartphones and vehicle 1; (h) both smartphones and vehicle 2; (i) both smartphones and both vehicles; (j) reference sensor and
vehicle 1; (k) reference sensor and vehicle 2; and (l) reference sensor and both vehicles.
values of 100 correspond to the detection of three true posi- Further suppression of this frequency is observed when
tives (one at each bridge frequency). both the smartphones and vehicles are combined [Fig. 8(i)].
Overall, the peak scores from the aggregated smart- These results show that the bridge’s modal frequencies have
phone data are consistent with those from the reference a notable presence in the moving smartphone data.
sensor. Out of all the categories, those pertaining to the ref- There were some significant peak scores that only per-
erence sensor had the highest precision values, i.e., fewest sisted in each vehicle category and could not be explained by
false positives, which is expected. In all 12 categories, there the bridge’s dynamic properties. These peaks occurred near
were significant peak scores at two out of three bridge fre- 0.70 Hz, 1.84 Hz, and 3.43 Hz (and elsewhere) in vehicle 1
quencies (first and third), resulting in recall values greater data (first column of plots) and around 2.42 Hz and 3.15 Hz
than 66. For the exception of one case [Fig. 8(b)], all data in vehicle 2 data (second column of plots); it is possible these
categories contained significant peak scores for all three frequencies represent aspects of the moving vehicle dynam-
bridge frequencies (recall values equal to 100). ics. If the effects of different vehicles and smartphones are
Most notably, when the smartphone categories were random and independent, these results suggest two points: 1)
aggregated (third row of plots), the precision improved. For frequencies unrelated to the vehicle–bridge system may van-
example, for vehicle 1, the combined results from smart- ish, in an average sense, as the aggregated data sets become
phones 1 and 2 [Fig. 8(g)] were just as good as those from the more diverse; and 2) collective smartphone accelerometer
reference sensor [Fig. 8(j)]. In addition, combining smart- data can generate information comparable to a higher qual-
phones was observed to be effective in suppressing false ity accelerometer (precision in this example).
positives. For instance, for vehicle 2, there is a false positive
at 1.55 Hz for the individual smartphone cases [Fig. 8(b) and
(e)] while the peak score at this frequency is insignificant E. Considerations for Future Work
for the reference sensor [Fig. 8(k)]. Yet, when the smart- The previous section demonstrated how an intrinsic
phone data are combined [Fig. 8(h)], the peak score falls structural feature can be extracted from a specific class
just below the threshold, and thus becomes a true negative. of smartphone data that are readily available in urban
586 Proceedings of the IEEE | Vol. 106, No. 4, April 2018Matara z zo et al. : Crowdsensing Framework for Monitoring Bridge Vibrations Using Moving Smar tphones
environments. Modal properties do not necessarily provide throughout infrastructure management. Structural evalua-
a measure of structural condition; yet, condition evalua- tions and decision making are based solely on subjective and
tions can benefit from incorporating modal property infor- infrequently collected information, sets of visual inspections
mation. Furthermore, crowdsourcing such data presents of bridges, which are constrained by municipality budgets,
an opportunity to estimate the modal properties of poten- can miss early signs of damage, and can lead to inaccurate
tially thousands of bridges, cost-effectively, which would prognoses. If local municipalities could access enormous data
be useful to engineers, and over time, can support condi- sets from smartphone vehicle scans and the bridge informa-
tion assessments. While these results are encouraging, it tion potential concealed within, infrastructure maintenance
is important to reiterate that the limits of this simple data- problems could be reshaped into those rooted in engineering
driven approach have not yet been fully tested. In general, and computer science, for which there is preexisting motiva-
PSD estimates are affected by sensor noise, sampling rate, tion for engineers, researchers, and businesses to solve.
data length, and spectral smoothing. The key benefits here Aggregating results from lower quality sensors can collec-
are the cost-effectiveness of smartphone data and the added tively deliver rich content [85], [86], [100], and in this case,
value in aggregating the results from numerous trips. the public has already purchased the sensors (their smart-
Vehicle scanning data are influenced by dynamic phones), and will deploy them sufficiently during their daily
vehicle–bridge interaction; variables encompassing the routines. Municipalities may need to vest the responsibilities
vehicle system, vehicle route, road profile, and bridge system and initial costs for data management, such as initiating data
define the complexity of the interaction effects as well as procurement programs via smartphone apps and configuring
the presence of bridge vibrations within the recorded signal. data repositories. Yet, this presents an opportunity for a local
Over the past two decades, studies related to the interaction government to collaborate with academic institutions and/
problem have established the governing differential equa- or industry partners who have mutual interests and comple-
tions, constructed helpful simplified models, and conducted menting strengths. Furthermore, a mobile smartphone bridge
experiments (real and synthetic) [58]–[61]. For instance, monitoring program could be supported by acceleration and
studies on single-span bridges have concluded that vehicle GPS data that are being collected as part of an existing civic
scanning data include special signals at vehicle vibration engagement program, e.g., Street Bump or Boston’s Safest
frequencies and a driving frequency, which are independent Driver. Regardless, the effort is an investment: the potential
of the bridge system. In addition, it is known that certain volume and spatiotemporal resolution of subsequent struc-
aspects of the interaction are subdued in the cases of slow tural health informatics could help engineers and govern-
vehicle speeds, stiff vehicle suspensions, and smooth road ment entities make more informed decisions on bridge man-
surfaces [91], [92]. These interaction effects were not con- agement, which are intended to reduce maintenance costs
sidered explicitly in this approach, although based on the and increase a bridge’s service by extending its lifespan.
literature, it is expected that in the application, slow vehicle There are two key advantageous characteristics of crowd-
speeds during peak traffic hours contributed to the method’s sourced bridge vibration data streams: 1) high volume; and
success. 2) high velocity. Details of these attributes are dependent
It is suggested that data acquisition and preprocessing on individual participation, which can be difficult to predict
methods could include supplementary information (meta- with high accuracy; generally speaking, they govern the size
data) to preselect (or otherwise identify) scientifically of the big data. Yet, given the high annual average daily traf-
preferable circumstances and mitigate experimental uncer- fic levels for urban bridges, even low penetration rates can
tainty. In future work, additional smartphone sensors such generate thousands of data sets daily.
as GPS, magnetometer, or gyroscope can be incorporated to Another important characteristic of the crowdsourced
enhance the results, e.g., reconfigure the smartphone coor- data is heterogeneity [101]. Vehicle scanning measure-
dinate system [77], compile measurements at particular ments of the same bridge will differ substantially among
locations [93], estimate structural mode shapes [62], etc. users, thereby adding a layer of complexity on the interac-
There is also a need to study the synchronization problem tion effects. Vehicle properties, smartphone model, location
posed by multiple moving sensors with independent and within the vehicle, and other variables, are all contributing
potentially irregular sampling properties [78], [94], [95]. factors. User metadata can help explain or account for the
Finally, as vehicular networks emerge for urban sensing, influences of some of these variables. Some information
the design of intercommunication systems should consider such as vehicle make and model, number of passengers, tire
costs related to data processing and transmission [96]–[99]. pressure, etc., could potentially be entered into an interface
by the user. These metadata could generate direct feedback
I V. CROW DSOU RCI NG BR ID GE to the user, e.g., suggest a tailored smartphone setup for
V IBR AT ION DATA optimal data quality, and/or be stored for analytical con-
text. Alternatively, certain properties may be estimated to
A. Long-Term Goals and Data Stream Characteristics an extent using data recorded in normal driving conditions
An overarching goal behind collecting mass smart- (nonbridge trips). Overall, data diversity becomes a useful
phone data is to reform the nature of the challenges faced feature as the number of data sets available becomes very
Vol. 106, No. 4, April 2018 | Proceedings of the IEEE 587Matara z zo et al. : Crowdsensing Framework for Monitoring Bridge Vibrations Using Moving Smar tphones
large. If these variables are random and independent, it is evaluations, and artificial intelligence [105] or deep learning
expected that the most persistent frequencies in the collected techniques may be implemented to extract further latent
data would be those representative of bridge dynamics. insights. That is, the bridge management system can develop
an ability to learn, similar to capabilities of speech recogni-
B. Toward an Automated Bridge Management tion algorithms [106], [107] or self-driving vehicles.
System These tools are most effective when they supplement
existing maintenance protocols; their added value is that they
A bridge management system receiving daily streams
empower more frequent and data-substantiated structural
of vehicle scanning data has four functions, which may be
evaluations at a relatively low cost. While there are bound to
automated:
be highly technical aspects embedded in such an automated
1) extraction of bridge condition information from bridge management system, visual inspections by profes-
incoming mobile sensing data; sional engineers are irreplaceable. Furthermore, structural
2) organization of data archives and prior statistics; condition results must be conveyed in a manner that is clearly
3) condition evaluations based on vehicle-scanning interpretable by those who have the authority and expertise
informatics, structural plans, and visual inspection needed to make judgements, such as public works offices, city
records; officials, stakeholders, etc. An automated bridge management
4) dissemination of reports to authorities and coordina- system is an interactive platform that acts as an interface
tion of corresponding actions. between the digital and physical worlds by integrating visual
Analyses of data from an initial gathering period, e.g., a inspection data, e.g., photos, and presenting analytics visu-
few months, up to one year, are needed to establish the base- ally. Previous research has shown that state departments of
line (reference) conditions of a bridge. Subsequently, bridge transportation have interest in incorporating interactive digi-
informatics computed from incoming data can be compared tal platforms into existing bridge management systems [108].
with those observed in the past, under similar circumstances. The design and deliverables of a prospective automated
One goal is to determine whether the most recent analytics bridge management system are illustrated in Fig. 9. On the
indicate a structural state that is different from the refer- right of the dashboard screen, high-level information related
ence condition. Statistical methods for classification, clus- to overall bridge health, upcoming maintenance actions, and
tering, or control processes [46], [102], etc., can be applied recent data streams are provided. On the left, the analytics
to identify substantial changes or abnormal trends in struc- are mapped to an interactive bridge model, which facilitates
tural features while accounting for uncertainty [103], [104]. the understanding of structural behavior at a component
As historical information on structural condition accumu- level for nonexperts as well as highly localized information
lates in the database, a confidence is earned in data-driven for inspectors. Fig. 9 demonstrates one instance, out of all
Fig. 9. Depiction of a digital dashboard of a bridge management system, which is fueled by streams of mobile sensor data. Current structural
conditions can be displayed in a manner that is informative to professional engineers and city officials. Baseline structural performance
metrics are established over an initial data gathering period�their precision improves as data accumulates. Statistically significant changes
in informatics can serve as early indicators of structural damage, at which point a detailed inspection may be warranted.
588 Proceedings of the IEEE | Vol. 106, No. 4, April 2018Matara z zo et al. : Crowdsensing Framework for Monitoring Bridge Vibrations Using Moving Smar tphones
the possible forms and functions, of such bridge manage- significant indicators of the first three modal frequencies
ment systems, which are to be customized according to of the bridge. This result confirmed that bridge modal fre-
the specific needs of the appropriate public works offices, quencies can be detected from this class of mobile smart-
engineers, and officials in the city. phone data. In particular, when aggregated, the smartphone
results improved in precision and, in one case, rivaled those
V. SU M M A RY A N D CONCLUSION of the reference sensor. The outcome is an opportunity for
local governments to collaborate with entities having com-
A coincidence of circumstances in consumer technology, plementing strengths, to encourage mass collection of data
ageing infrastructure, government innovation, and struc- containing bridge vibrations, which can contribute to more
tural health monitoring (SHM) research has established effective management and informed decision making. Over
an opportunity to monitor bridge vibrations using crowd- a longer period of time, continued programs can keep these
sourced smartphone data. Cities worldwide are enduring
urban assets in circulation throughout their design lives,
widespread infrastructure epidemics at a time when they
reduce their maintenance costs, and potentially increase
are experiencing rapid technological developments and
their service by extending their lifespans.
paradigm shifts in human mobility. Standard bridge evalu-
ation methods rely on visual inspections, which face limi-
Acknowledgment
tations in frequency and subjectivity that ultimately affect
The authors would like to thank Allianz, American
the structural assessments on which maintenance plans are
Air Liquide, the Amsterdam Institute for Advanced
based. The operational (everyday) behavior of a bridge must
be observed over an extended period, e.g., years, to suffi- Metropolitan Solutions, Ericsson, the Fraunhofer Institute,
ciently track its health and avoid unexpected rehabilitation. Liberty Mutual Institute, Philips, the Kuwait-MIT Center
SHM sensor networks utilize dedicated devices to record for Natural Resources and the Environment, Singapore-
field measurements, which are analyzed using mathemati- MIT Alliance for Research and Technology (SMART),
cal tools to determine the true conditions of a structural sys- UBER, UniCredit, Volkswagen Electronics Research
tem. Mobile sensor networks are conducive to monitoring Laboratory, and all the members of the MIT Senseable
urban bridges vibrations regularly, with benefits that have City Lab Consortium for supporting this research.
been demonstrated in recent SHM research. Research funding is partially provided by the National
The Mayor’s Office of New Urban Mechanics in the City Science Foundation through Grant No. CMMI-1351537 by
of Boston initiated two smartphone-based civic engagement Hazard Mitigation and Structural Engineering program,
programs which demonstrated smartphone capabilities for and by a grant from the Commonwealth of Pennsylvania,
crowdsourcing sensory data, and explored how big data Department of Community and Economic Development,
can be an asset to addressing complex urban issues. Prior through the Pennsylvania Infrastructure Technology
research with smartphone accelerometers suggested that Alliance (PITA). The authors would like to credit
resulting information may not be significantly limited by P. Schmitt for the photographs in Fig. 4 and thank R. Ma for
the capabilities of cheaper sensors. In an application on the his assistance with Figs. 3, 4, and 9. The authors would also
Harvard Bridge, it was shown that smartphone data, col- like to thank U. Fugiglando, M. M. Akhlaghi, and Z. Zheng
lected within a moving vehicle, contained consistent and for their help with data acquisition.
R EFER ENCES [5] J. P. Lynch, C. R. Farrar, and J. E. Michaels, [10] R. Tachet et al., “Revisiting street
“Structural health monitoring: intersections using slot-based systems,” PLoS
[1] American Society of Civil Engineers.
Technological advances to practical ONE, vol. 11, no. 3, p. e0149607, 2016.
(2017). “Bridges,” 2017 Infrastructure
implementations,” Proc. IEEE, vol. 104, no. 8, [11] F. Calabrese, M. Colonna, P. Lovisolo,
Report Card. Accessed: Mar. 10, 2017.
pp. 1508–1512, Aug. 2016. D. Parata, and C. Ratti, “Real-time urban
[Online]. Available: http://www.
infrastructurereportcard.org/wp-content/ [6] D. S. Kassel, Managing Public Sector Projects: monitoring using cell phones: A case
uploads/2017/01/Bridges-Final.pdf A Strategic Framework for Success in an Era of study in Rome,” IEEE Trans. Intell. Transp.
Downsized Government, 1st ed. Boca Raton, Syst., vol. 12, no. 1, pp. 141–151,
[2] 2013 Status of the Nation’s Highways, Bridges
FL, USA: CRC Press, 2010. Mar. 2011.
and Transit: Conditions and Performance,
U.S. Department of Transportation Federal [7] United Nations. (2014). World’s Population [12] S. Paldino, D. Kondor, I. Bojic, S. Sobolevsky,
Highway Administration and Federal Transit Increasingly Urban With More Than Half Living M. C. Gonzalez, and C. Ratti, “Uncovering
Administration, 2014. in Urban Areas. Accessed: Mar. 1, 2017. urban temporal patterns from geo-tagged
[Online]. Available: http://www.un.org/en/ photography dataset,” PLoS ONE, vol. 11,
[3] M. Nakashima, O. Lavan, M. Kurata, and
development/desa/news/population/world- no. 12, pp. 1–14, 2016.
Y. Luo, “Earthquake engineering research
urbanization-prospects-2014.html [13] P. Wang, T. Hunter, A. M. Bayen,
needs in light of lessons learned from the
2011 Tohoku earthquake,” Earthquake Eng. [8] H. Wang, F. Calabrese, G. Di Lorenzo, and K. Schechtner, and M. C. González,
Eng. Vibrat., vol. 13, pp. 141–149, Aug. 2014. C. Ratti, “Transportation mode inference “Understanding road usage patterns in urban
from anonymized and aggregated mobile areas,” Sci. Rep., vol. 2, p. 1001, 2012.
[4] The Collaboration for NDT Education.
phone call detail records,” in Proc. ITSC, [14] L. Alexander, S. Jiang, M. Murga, and
(2014). NDT Education Resource Center, Bridge
2010, pp. 318–323. M. C. González, “Origin-destination trips by
Inspection. Accessed: Mar. 8, 2017. [Online].
Available: https://www.nde-ed.org/ [9] R. Tachet et al., “Scaling law of urban ride purpose and time of day inferred from
AboutNDT/SelectedApplications/Bridge_ sharing,” Nature Sci. Rep., vol. 7, p. 42868, mobile phone data,” Transp. Res. C, Emerg.
Inspection/Bridge_Inspection.htm Mar. 2017. Technol., vol. 58, pp. 240–250, Sep. 2015.
Vol. 106, No. 4, April 2018 | Proceedings of the IEEE 589You can also read