September 2019 Investor Presentation - Investor Relations

Page created by Darren Farmer
 
CONTINUE READING
September 2019 Investor Presentation - Investor Relations
September 2019 Investor Presentation
September 2019 Investor Presentation - Investor Relations
Cautionary Statements And Risk Factors That May Affect
Future Results
These presentations include forward-looking statements within the meaning of the federal
securities laws. Actual results could differ materially from such forward-looking statements.
The factors that could cause actual results to differ are discussed in the Appendix herein
and in NextEra Energy’s and NextEra Energy Partners’ SEC filings.

Non-GAAP Financial Information
These presentations refer to certain financial measures that were not prepared in
accordance with U.S. generally accepted accounting principles. Reconciliations of those
non-GAAP financial measures to the most directly comparable GAAP financial measures
can be found in the Appendix herein.

Other
See Appendix for definition of Adjusted Earnings, Adjusted EBITDA and CAFD
expectations.

2
September 2019 Investor Presentation - Investor Relations
NextEra Energy is comprised of strong businesses
supported by a common platform

                                                                  • ~$105 B market capitalization(1)
                                                                  • ~52 GW in operation(2)
                                                                  • ~$111 B in total assets(3)

                                 • The largest electric utility
                                   in the United States by
                                   retail MWh sales
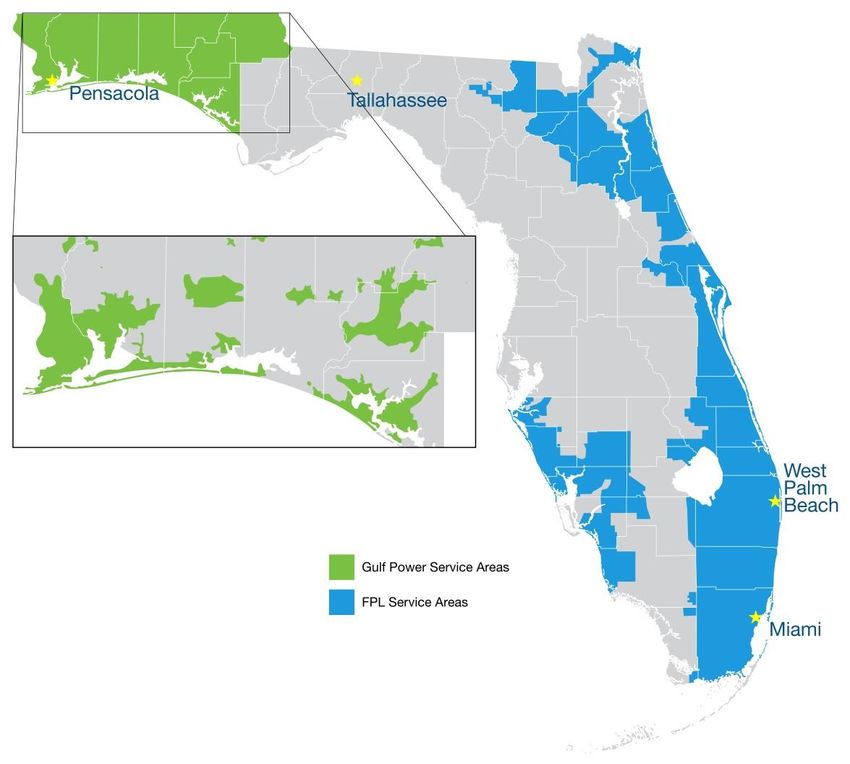
                                 • Provides electric service                                • The world leader in
                                   to over 460,000 customers                                  electricity generated
                                   in northwest Florida                                       from the wind and sun

                                     Engineering & Construction
                                            Supply Chain
                                  Wind, Solar, and Fossil Generation
                                         Nuclear Generation
    1) As of August 20, 2019; Source: FactSet
    2) Megawatts shown includes assets operated by Energy Resources owned by NextEra Energy Partners as of
       June 30, 2019
    3) As of June 30, 2019
3
September 2019 Investor Presentation - Investor Relations
We have a long-term track record of delivering value to
            shareholders

            Adjusted Earnings Per Share                                                 Total Shareholder Return(1)
                                                                             $7.70
                                                                                                14%
                                                                                     15%                           90%     82%
                                                                                                                   80%
                                                                                     10%                           70%
                                                                                                       4%          60%
                                                                                      5%                           50%
$2.48                                                                                                                              37%
                                                                                      0%                           40%                   30%
                                                                                                                   30%
                                                                                     -5%                           20%
                                                                                                             -4%   10%
 '03 '04 '05 '06 '07 '08 '09 '10 '11 '12 '13 '14 '15 '16 '17 '18                     -10%                           0%
                                                                                                  One Year                     Three Year

                Dividends Per Share
                                                                             $4.44              134%                           380%
                                                                                     140%                          400%
                                                                                     120%
                                                                                                                   320%
                                                                                     100%                                                 243%
                                                                                      80%              66%         240%
                                                                                                                                   170%
                                                                                      60%                    50%
                                                                                                                   160%
$1.20                                                                                 40%
                                                                                                                   80%
                                                                                      20%
                                                                                       0%                        0%
                                                                                                 Five Year                       Ten Year
'03 '04 '05 '06 '07 '08 '09 '10 '11 '12 '13 '14 '15 '16 '17 '18
                                                                                            ■    NEE ■ S&P 500 Utility Index   ■   S&P 500

             No management team in the industry is more aligned with shareholders

        4    1) Source: FactSet; includes dividend reinvestment as of 12/31/2018
September 2019 Investor Presentation - Investor Relations
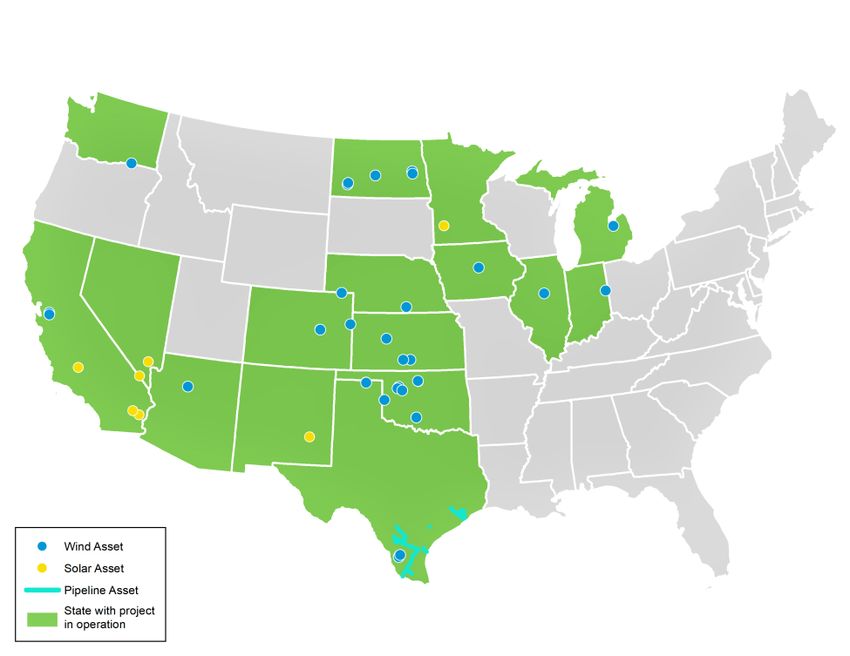
In 2018, NextEra Energy maintained its status as the largest
     generator of wind and solar energy in the world

     World’s Top Generators
of Wind and Solar Energy in 2018(1)                                                 Global Wind Installations(2)
                             (TWh)                                                                           (GW)
50      47                                                                 250
                                                                                     211
40              39      39                                                 200

30                               30     28                                 150
                                                25      23
20                                                              18         100             97

                                                                                                  60
10                                                                           50                         35
                                                                                                              23 21      15 15 15 13
 0                                                                             0
       NEE A             B       C       D       E       F      G
                          Solar          Wind

       Energy Resources has more wind capacity in its portfolio than all but
                         seven countries in the world
      1) Based on third-party research data and corporate disclosures; NextEra Energy actuals; includes NextEra Energy
         Partners assets and other minority-owned assets at ownership share %
      2) Global Wind Energy Council data as of December 2018; NextEra Energy wind capacity owned and/or operated
 5       by NextEra Energy Resources
September 2019 Investor Presentation - Investor Relations
NextEra Energy was the first to receive a “Best In Class”
    assessment from S&P’s new evaluation on ESG preparedness

                                       2019 S&P ESG Evaluation(1)
    •     “…high performance and innovative culture demonstrates
          excellent commitment to long-term sustainability”
    •     Factors in report distinguishing NextEra Energy from peers:
             Environmental                                         Social                                  Governance
    •    Emphasis on                               •    High customer                            •    Strong checks and
         decarbonizing                                  satisfaction driven by                        balances including
         generation fleet                               technological                                 an effective and
    •    99% of water recycled                          innovations, reliability                      rotating lead
         and 80% from non-                              and low bills                                 independent director
         potable sources                           •    Strong safety                            •    Independent and
    •    Preventative measures                          management plan                               proficient board
         to minimize impact on                     •    More proactive than
         wildlife                                       peers in addressing
                                                        diversity

    In our view, no one in any industry has done more than NextEra Energy to
                              address CO2 emissions

        1) Source: “Environmental, Social, and Governance (ESG) Evaluation: NextEra Energy Inc.” report published by
6          S&P Global Ratings on June 17, 2019
We are well positioned to continue our track record of growth
                     Wholesale                            FPL              FPL
        Gas          & Service        FPL Coal           Energy           Under-
       Utility        Territory      Retirements        Services        grounding
                     Expansion

                   FPL
                                  FPL            FPL T&D        FPL New
                 Battery                      Infrastructure
                                  Solar                        Generation               Expect
                 Storage
                                                                                     $50 B - $55 B
                                                                                      of capital
                                                            FPL
      Capital          Gulf                              Generation         Asset    deployment
     Recycling        Power           Growth            Modernization       M&A
                                                                                      from 2019
                                                                                    through 2022;
                                                                                    ~$12 B - $14 B
                                                                                       per year
                                          Battery      Distributed Competitive
       New Wind        New Solar
                                          Storage      Generation Transmission

                                                       Customer
                          Gas              Gas
                                                        Supply
                       Pipelines     Infrastructure
                                                       & Trading

           We believe we have the industry’s leading growth
                             prospects
7
We expect the industry’s disruptive factors will further
    expand and accelerate over the coming years

                           Disruptive Industry Changes Today
                                                                                  Potential Cost per MWh Post-2023(1)
                           AI /                                                                          ($/MWh)
                         Machine
                         Learning                                                Near-Firm Wind                               $20 - $30
         Big Data                       Renewables /
                                          Storage                                Near-Firm Solar                                      $30 - $40
                                                                                      Natural Gas                         $30 - $40
                                                                                    Existing Coal                             $35 - $50
                                                    ESG &
Smart                                             Renewable                     Existing Nuclear                              $35 - $50
 Grid                                               Policy
                                                   Tailwinds                                                     Storage Adder
                                                                              U.S. Electricity Production by Fuel Type(2)
     Shale                                       Cost
      Gas                                    Restructuring

                                                                                           2018                                2030E
             Shareholder        Generation
              Activism         Restructuring

                                                                         Wind & Solar           Natural Gas         Coal & Nuclear         Other

     1) Represents projected cost per MWh for new build wind, solar, and natural gas, excluding PTC and ITC; projected
        per MWh operating cost including fuel for existing nuclear and coal; based on NextEra Energy internal estimates
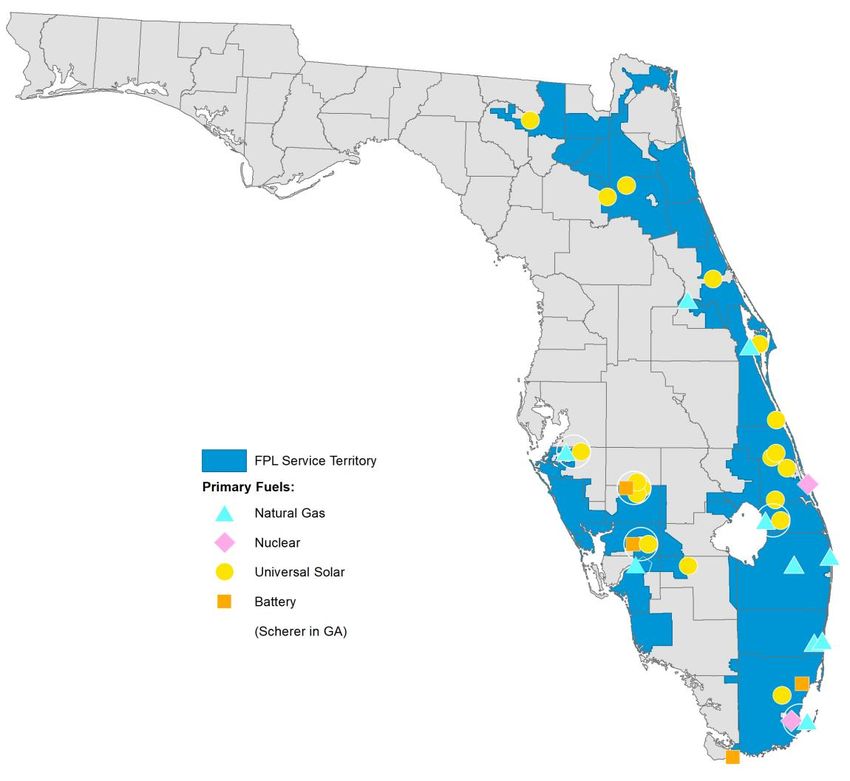
8    2) 2018 source: U.S. EIA; 2030 estimate source: National Renewable Energy Laboratory (NREL)
Florida Power & Light is recognized as one of the best utility
    franchises in the U.S.

                                Florida Power & Light Company
    • One of the largest electric
      utilities in the U.S.
    • Vertically integrated, retail
      rate-regulated
    • 5+ MM customer accounts
    • ~27 GW in operation
    • ~$12 B in operating
      revenues
    • ~$55 B in total assets

9    Note: All data is as of June 30, 2019, except operating revenues which are for full-year 2018
FPL has significant investment opportunities across its
 system that are expected to generate customer savings and
 further enhance reliability
                       FPL 2019 – 2022 Capital Expenditures
                                                                                       Projected                      Recovery
 Opportunity                                             Status
                                                                                     Investment(1)                   Mechanism
 Dania Beach Clean Energy                 Final regulatory approval granted
                                                                                        ~$900 MM(2)          Base rates
 Center                                   in Q4 2018; expected COD in 2022
                                          In construction and on track to be
 2020 SoBRA                                                                              ~$390 MM            Solar Base Rate Adjustment
                                          completed by 2Q 2020
                                          Twenty sites projected to be                                       Base rates w/ participant
 SolarTogether                                                                             ~$1.8 B
                                          completed in 2020 and 2021                                         contributions as offset (3)
                                          Site control; early stage
 Additional solar investments                                                          ~$1.0 - $1.5 B        Base rates
                                          development
 Battery storage                          Various battery storage projects               ~$420 MM            Base rates

 500 kV transmission project(4)           Ongoing                                          ~$1.4 B           Base rates

 Transmission & distribution                                                                                 Storm protection plan cost
                                          Investments from 2019 – 2022                 ~$3.0 - $4.0 B
 storm hardening                                                                                             recovery clause / base rates (5)
 All other transmission &
                                          Investments from 2019 – 2022                 ~$7.0 - $8.0 B        Base rates
 distribution
 Maintenance of existing assets,
                                          Ongoing                                      ~$5.5 - $6.5 B        Base rates
 nuclear fuel, and other

                     Total projected capital deployment of $23 B to $25 B
                                   from 2019 through 2022
   1)   Includes amount invested in 2019 through 2022, unless otherwise noted
   2)   Reflects total investment for Dania Beach Clean Energy Center including investment made pre-2019
   3)   Proposed tariff subject to approval by the Florida Public Service Commission
10 4)
   5)
        Replacement of 500 kV foundations and structures across the service territory
        Regulations regarding storm protection plan cost recovery clause, including recoverable investments, not yetfinalized
Growth in regulatory capital employed is expected to drive
 FPL’s net income growth through 2022
         FPL Regulatory                                         2019-2022
        Capital Employed(1)                                Capital Expenditures
$B
$50                                       $47.0 - $49.0

$40
           $33.7
                                                                              $23 B -
$30                                                                           $25 B

$20

$10
                                                          T&D Storm Hardening             All Other T&D
 $0                                                       Solar                           Other Generation
                                                          Other, Including Nuclear Fuel
            2018                              2022E

   FPL expects regulatory capital employed to grow at a CAGR of roughly
                       9% from 2018 through 2022

11 1) Excludes accumulated deferred income taxes
At FPL, we will continue to focus on the long-term strategy
 that has delivered our best-in-class customer value
 proposition
                                  FPL Customer Value Focus
              Operational                                                                   Service
           Cost Effectiveness(1)                                                           Reliability(2)
                      $/Retail MWh                                                              minutes
                                      ~$11.10 –
             $11.78                    $11.75(4)                                     ~55
Good                       ~5%
                         Reduction                                      Good
                                                                                                ~10%
                                                                                              Improvement
                          in real$                                                                            ~50

              2018                      2021E                                       2018                    2021E
                 1000-kWh
              Residential Bill(3)                                                  CO2 Emissions Rate
                                                                                               CO2 Lbs./MWh
                                       ~$95 –
             ~$99                      $100(4)                                      ~670
                           ~5%
                                                                                                ~10%
                         Reduction
                                                                                               Reduction
                          in real$
The acquisition of Gulf Power expands our Florida footprint
     and regulated operations

                                                                Gulf Power
•    Acquisition closed 1/1/2019
•    Located in Northwest Florida
•    ~460,000 customers
•    ~2,300 MW of generation in
     operation
         – 1,600 MW coal
         – 600 MW natural gas
•    $1.5 B in operating revenues
•    $5.4 B total assets

    13   Note: All data is as of June 30, 2019, except operating revenues which are for full-year 2018
Significant opportunities exist to improve the Gulf Power
       customer value proposition
           Operational Cost Effectiveness(1)                                                    Service Reliability(2)
                                                                                                               minutes
                                                                                                                                 ~130
   $100
                                                   Adjusted Regressed                       ~101
                                                   Top Quartile
                 Gulf Pow er 2018                  Top Decile                                                            ~93
                  = $29.38/MWh

                                                                               Good                      ~55
$/Retail
 MWh

                                                      FPL 2018 =
             Log/Log                                  $11.78/MWh
    $10                                                                                     Gulf          FPL         FL        National
     1,000,000         10,000,000       100,000,000       1,000,000,000                    Power                    Average     Average

             Generation Mix Comparison(3)                                                     CO2 Emissions Rate(4)
                                      MWh                                                                    Lbs/MWh
                                                                                              1,679
                                                   22%
                        45%

                                                                                                                                 968
                        31%                        73%                                                           671

                        24%

                  Gulf Power                       FPL                                     Gulf Power            FPL           Industry
            Natural Gas Nuclear         Coal     Solar Purchased Power                                                         Average
        1) FERC Form 1 non-fuel O&M; industry 2017, Gulf Power/FPL 2018; excludes pensions and other employee
           benefits; includes holding companies with >100,000 customers and utility owned generation
        2) System Average Interruption Duration Index for 2018; FL average data from FPL, TECO, DEF and Gulf; National
           average from PA ReliabilityOne™ database and EIA Form 861 Data, 2017 data year
     14 3) As of December 31, 2018
        4) Industry average from the Department of Energy’s Energy Information Administration
Despite growing regulatory capital employed at roughly half
 the rate of FPL over the past 10 years, Gulf Power’s bill has
 increased significantly while FPL’s has declined
                        2008 vs. 2018 Historical Comparison
Regulatory Capital Employed(1)                                                 1,000-kWh Residential Bill(2)
                                                   $33.7 B                                ~$137

                                                                              ~$106                                   ~$106
                                                                                                                                  ~$99

         ~5%                                  ~10%
         CAGR                                   CAGR
                                                                                   ~30%                                       ~6%
                                                                                   Increase                              Reduction
                                       $13.2 B

               $3.0 B
     $1.8 B

      Gulf       Gulf                    FPL         FPL                       Gulf        Gulf                        FPL        FPL
     Power      Power                    2008        2018                     Power       Power                        2008       2018
      2008       2018                                                          2008        2018
                                                                             Base Rate O&M                        Other Base Rate
                                                                             Fuel                                 Environmental Cost Recovery
                                                                             Other

      1) 13-month average; includes retail rate base, wholesale rate base, clause-related investments and AFUDC
         projects; excludes accumulated deferred income taxes
15    2) Based on a typical 1,000 kWh monthly residential bill and internal calculations
We have identified several opportunities to improve the
 customer value proposition through smart capital
 investments
                   Gulf Power 2019 – 2022 Capital Initiatives
Opportunity                                           Status                        Projected                           Recovery
                                                                                  Investment(1)                        Mechanism
North Florida Resiliency                 Development in process; target               ~$400 MM                          Base rates
Connection                                      in-service 2021
Plant Crist conversion to                Development in process; target               ~$175 MM                          Base rates
natural gas and gas lateral                     in-service 2020
New Plant Crist combustion                   Projected for 2021 COD                   ~$500 MM                          Base rates
turbines
Plant Smith combustion                      Construction in process;                   ~$50 MM                          Base rates
turbine upgrades                           expected 2019 completion
2020 solar investments                    Three sites projected for 2020              ~$300 MM                          Base rates
                                                       COD
2019 customer systems                      Implementation in process                   ~$70 MM                          Base rates
Transmission & distribution                                                                                 Storm protection plan cost
storm hardening                           Investments from 2019 – 2022            ~$100 - $200 MM
                                                                                                           recovery clause / base rates(2)
 All other transmission &
                                          Investments from 2019 – 2022            ~$650 - $800 MM                       Base rates
 distribution
Environmental clause                                  Ongoing                         ~$200 MM              Environmental cost recovery
investments                                                                                                          clause
Maintenance of existing assets                        Ongoing                     ~$400 - $600 MM                       Base rates
and other

                      Total projected capital deployment of $2.9 B to $3.3 B
                                     from 2019 through 2022
     1) Projected investment includes AFUDC
     2) Regulations regarding storm protection plan cost recovery clause, including recoverable investments, not yet
16      finalized
We expect Gulf Power customers will benefit from the
 NextEra Energy playbook, as will our shareholders

              The NextEra Energy Playbook at Gulf Power
Operational Cost Effectiveness(1)                                            Regulatory Capital Employed
                   $/Retail MWh

              ~$29                                                                              $4.6 B -
                              ~50%                                                    ~16%      $4.8 B_
                            Reduction                                                    CAGR

                                                                                 $3.0 B
Good                                $14 - $15

               2018                    2021E                                      2018          2021E

17 1) FERC Form 1, non-fuel O&M; excludes pensions and other employee benefits
We expect Gulf Power customers will benefit from the
 NextEra Energy playbook, as will our shareholders

                  The NextEra Energy Playbook at Gulf Power
                  Service Reliability(1)                                                                CO2 Emissions Rate
                                  minutes                                                                          CO2 Lbs. / MWh
                                                                                                          ~1,680
                   ~101_

Good                              ~20%                                                                                   ~40%
                                Reduction                                                                              Reduction          ~1,060
                                                     ~80_

                    2018                           2021E                                                   2018                            2021E

          1000-kWh Residential Bill(2)                                                                            Net Income
                                                                                                                                          $240 MM –
             ~$137                                                                                                                        $260 MM
                                     ~$134
                                                                                                        $160 MM           ~16%
                          ~9%                                Mid-                                                         CAGR
                       Reduction                            $120s
                         in real              ~20%
                        2018 $               Reduction
                                               in real
                                              2018 $

               2018                  2021E              Mid-2020s                                          2018                            2021E
                                                         Target

     1)   System Average Interruption Duration Index
     2)   Based on a typical 1,000 kWh monthly residential bill; 2018 excludes benefit of accelerated flow back of unprotected deferred
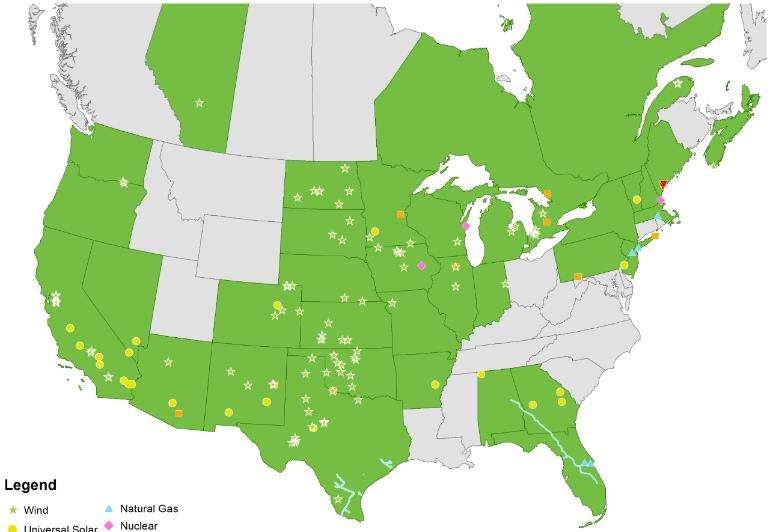
18        income taxes of ~$9 per month; 2021 excludes $8 per month surcharge related to Hurricane Michael
Energy Resources is the leading North American clean
 energy company

                                            Energy Resources
•    World leader in electricity generated
     from the wind and sun
•    ~24 GW(1) of generation in operation
      – ~15 GW wind
      – ~3 GW solar
                                                                                                                         Wind      Natural Gas
      – ~3 GW nuclear                                                                                                    Solar     Nuclear

      – ~3 GW natural gas/oil                                                                                            Storage   Other
                                                                                                                                   Pipeline

•    11.7 GW of renewables in                      backlog(2)                         Generation Capacity(1)
•    ~8 Bcf of natural gas pipeline
     capacity operating or under                                                                    Wind
     development(3)                                                                                 64%

•    ~$1.5 B(4) in adjusted earnings                                                                             Solar
                                                                                                                  11%
•    ~$45 B in total assets
                                                                                                  Natural Nuclear
                                                                                                   Gas     13%
                                                                                                    9%
     1) MW capacity owned and/or operated by Energy Resources
     2) Includes signed contracts as of July 24, 2019                                                      Oil
     3) Includes 4 Bcf Texas Pipelines operated by Energy Resources for NextEra Energy Partners
     4) Full-year 2018                                                                                     3%
19   Note: All other data as of June 30, 2019
We believe Energy Resources’ renewables development
 opportunities have never been stronger
                             Low Cost               Battery
                                                     Battery
                            Renewables              Storage
                                                     Storage

                                                                  Nuclear/Coal-
                                                                   Nuclear/Coal-
             Technology                                          to-Renewables
                                                                  to-Renewables
            Improvements          Buy            Build              Switching
                                                                     Switching
                                Cheaper         Cheaper

      Federal Tax      Development       ~80 GW           Operate         Increased
                                                                           Increased
      Incentives          Skills          U.S.            Cheaper          State RPS
                                                                          State  RPS
                                       Renewable
                                        Demand
                                      through 2022

                           Innovate                    Finance
          Low
           LowU.S.
              U.S.                                                       Solar &
                            Better                     Cheaper       FERC   Orders
        Renewables
         Renewables                                                   Storage Under
         Penetration
        Penetration                      Identify                      845 & 841
                                                                      Existing Wind
                                        Customer
                                        Solutions
                          Wind
                           Wind                       C&IC&I
                                                          Demand
                        Repowering
                        Repowering                      for ESG
                                                       Demand
                                                       Platforms

     Energy Resources’ execution track record, people and
      culture are key drivers to our development success
20
Technology improvements and capital cost declines have
       significantly improved wind and solar economics

                                            Wind & Solar Technology
                     Levelized Cost of                                                             Levelized Cost of
                   Electricity from Wind                                                         Electricity from Solar
               (Including Production Tax Credits)                                              (Including Investment Tax Credits)
$/MWh                                                                         $/MWh
  $70                                                                          $160
                                                                                      $140-$150
        $55-$65                                                                $140
 $60

                                                                               $120
 $50
                                                                               $100             $95-$105
 $40              $36-$42
                                                                                $80                        $73-$83
 $30
                            $21-$27                                             $60
 $20                                  $16-$22                                                                        $39-$47
                                                $15-$20             $11-$18     $40                                            $34-$41
                                                          $10-$15                                                                        $25-$35 $24-$30
 $10                                                                            $20

  $0                                                                             $0
                                                                                                                                               (4)     (4)
        2010(1) 2012 (1) 2014(1) 2016 (1) 2018(2) 2020E(4) 2022E(4)                     2010 (3) 2012 (3) 2014(3) 2016 (2) 2018(2) 2020E 2022E

      1) Source: U.S. Department of Energy, Wind Technologies Market Report
      2) Source: Bloomberg New Energy Finance
      3) Source: IHS Markit. The use of this content was authorized in advance. Any further use or redistribution of this
         content is strictly prohibited without written permission by IHS Markit. All rights reserved
   21 4) Energy Resources’ estimate
Wind is expected to be the cheapest source of electric
     generation even after production tax credits phase down

                          Expected Drivers of Future Wind
                    Levelized Cost of Energy (LCOE) Reductions
•        Increased generation as a result of                                             Unsubsidized Wind LCOE Roadmap(1)
         larger turbines                                                                                              $/MWh

          – Viability of larger post-2023 rotor                                  $30 - $35
            diameters confirmed by OEMs
          – Influence technology design and be
            early adopters
•        Capital cost savings                                                                     ~$20                                             $20 - $25
          – Larger turbine size results in fewer
            turbines and lower balance of system
            (BoS) costs
          – Benefits from manufacturing scale
          – Additional BoS cost saving initiatives                                             ~$10 - $15
•        Continued O&M cost reductions
          – Advanced analytics expected to drive
            meaningful cost reductions                                              2020
                                                                                    LCOE
                                                                                              Increased
                                                                                              Generation
                                                                                                            Capex
                                                                                                           Savings
                                                                                                                       Other
                                                                                                                       Capex
                                                                                                                                 O&M
                                                                                                                                 Cost
                                                                                                                                          Financing Post-2023
                                                                                                                                         Efficiencies LCOE
•        Financing efficiencies                                                                  Per
                                                                                               Turbine
                                                                                                             from
                                                                                                            Larger
                                                                                                                      Savings Reductions

          – No need for more expensive tax                                                                 Turbines

            equity when tax credits phase down                                                                  PPA Value       PTC Value (2)

           1) Energy Resources’ estimate
    22     2) Pre-tax value of production tax credit levelized over the life of the project
Solar is expected to be the cheapest source of electric
     generation other than wind after investment tax credit steps
     down
                          Expected Drivers of Future Solar
                    Levelized Cost of Energy (LCOE) Reductions
•   Continued module cost declines                                                                  Solar LCOE Roadmap(1)
                                                                                                                   $/MWh
•   Continued balance of system (BoS)
    savings from improved technology                                             $42 - $52
    and engineering innovation
         – ~30% decline expected by 2022
•   Drivers                                                                                      ~$17
         – Innovative racking systems and                                                                                                         $30 - $35
           installation methods                                                                                                          ~$4
         – Design optimization
         – Increased module power rating                                                      ~$25 - $35
           reduces BoS costs for associated site                                                                                     ~$25 - $30
           prep, racking and cabling
•   Continued O&M cost reductions
         – Goal of operating almost all solar fleet                                 2020      Module       Capex     Other       O&M      Financing Post-2023
                                                                                    LCOE       Cost       Savings    Capex       Cost    Efficiencies LCOE
           remotely                                                                           Decline       from    Savings   Reductions

•   Financing efficiencies                                                                              Higher Watt
                                                                                                         Modules

         – No need for more expensive tax equity                                                              PPA Value        ITC Value (2)
           when ITC phases down
           1) Energy Resources’ estimate
    23     2) Pre-tax value of investment tax credit levelized over the life of the project
Increased manufacturing capacity has resulted in energy
    storage cost declines and the ability to create low-cost
    near-firm wind and solar
                                               Energy Storage Costs
               Battery Pack                                                                            4-Hour
         Cost Relative to Capacity(1)                                                         Battery Storage Adder(2)
 $/kWh                                                             GWh      $/MWh
$1,400                                                              350      $80 $71-$81

                                                                              $70
$1,200                                                              300
                                                                              $60
$1,000                                                              250
                                                                                              $45-$55
                                                                              $50
 $800                                                               200                                 $38-$48
                                                                              $40
 $600                                                               150
                                                                              $30
                                                                                                                $19-$29
 $400                                                               100
                                                                              $20
                                                                                                                            $9-$16 $8-$14
 $200                                                               50        $10                                                           $4-$9

   $0                                                               0          $0
          2010 2011 2012 2013 2014 2015 2016 2017 2018 2019                           2010      2012     2014        2016   2018   2020E 2022E
              Battery Pack Cost           Installed Capacity

          1) Source: Bloomberg New Energy Finance
          2) Energy Resources’ estimate; assumes: 4-hour battery storage at 25% of nameplate solar capacity; total
   24        battery system costs calculated as two times Bloomberg New Energy Finance battery pack cost
Continued declines in battery costs are expected to result
     in the ability to generate near-firm wind and solar at low
     costs even after tax credits phase down
                                    Expected Drivers of Future
                                  Energy Storage Cost Reductions
                                                                                             Storage Adder Roadmap(1)
                                                                                                                $/MWh
•   Continued battery pack cost
    declines and efficiency
    improvements                                                            $11 - $17

         – Automotive investment will continue to
           drive innovation and reduce costs
                                                                                            ~$3
•   Continued balance of system (BoS)
                                                                                                                                               $5 - $9
    savings from improved technology
    and engineering innovation
                                                                                                                                     ~$1
                                                                                          ~$8 - $14
         – Innovations on enclosures, DC-DC
           converters, and integration with solar
           equipment                                                                                                           ~$4 - $8

•   Improved financing efficiencies
                                                                               2020      Battery  BoS Cost      Improved    O&M      Financing Post-2023
                                                                              Storage   Pack Cost Decline        Energy     Cost    Efficiencies Storage
                                                                               Adder     Decline                 Density Reductions               Adder

                                                                                                         PPA Value         ITC Value (2)

           1) Energy Resources’ estimate; assumes 25% of facility’s generating capacity for a 4-hour duration
    25     2) Pre-tax value of investment tax credit levelized over the life of the project
Low cost, near-firm renewables are expected to create
 significant long-term demand

                              Wind & Solar Market Potential(1)
                   Average Annual                                                             Average Annual
                   Wind Additions                                    Market                   Solar Additions
                                                                    Growing
                                                                    ~15%
                                                                  annually on                                      ~18 – 20
                                                                   average                                         GW/Year

                                             ~12 – 15
                                             GW/Year
                                                                                     ~10 GW/Year
          ~10 GW/Year

            2019 - 2022                    2023 - 2030                                2019 - 2022                 2023 - 2030

    We believe we are in the best renewables development environment in
         our history and expect to maintain our leadership position

   1) 2019 – 2022 source: average of National Renewable Energy Laboratory (NREL), MAKE, Bloomberg New
      Energy Finance, IHS Markit and U.S. Energy Information Administration capacity addition estimates; 2023 –
26    2030 source: NREL capacity addition estimates
Energy Resources’ competitive advantages position us to
   continue to capitalize on what we believe is the best
   renewables development environment in our history
                   Energy Resources Development Program(1)
                                         (Signed Contracts as of July 24, 2019)

                                 2019 – 2020          2019 – 2020            2021 – 2022          2021 – 2022      2019 – 2022
                                   Signed               Current                Signed               Current          Current
                                  Contracts           Expectations            Contracts          Expectations     Expectations
Wind                                  3,938           3,000 – 4,000+               392            2,000 – 3,800    5,000 – 7,800
Solar(2)                              1,485            1,000 – 2,500              2,358           2,800 – 4,800    3,800 – 7,300
Energy Storage(2)                      50                 50 – 150                 460             650 – 1,250     700 – 1,400
Wind Repowering                       2,130                >2,000                    0                      0         >2,000
Total                                 7,603            6,050 – 8,650              3,210           5,450 – 9,850   11,500 – 18,500

Build-Own-Transfer                     774                                         110

    At more than 11,700 MW, our current renewables backlog is the largest in
                    Energy Resources’ development history

  27    1) MW capacity expected to be owned and/or operated by Energy Resources
        2) Excludes 680 MW of solar and 208 MW of storage (total of 888 MW) signed for post-2022 delivery
New wind and solar investments are expected to drive
 capital expenditures through 2022

                  Projected Capital Expenditure Summary(1)
          $8.0
                          $6.6 – $7.0                 $6.6 – $7.2                                               $6.6 – $7.2
          $7.0
                                                                                   $5.7 – $6.2
          $6.0
          $5.0
$B
          $4.0
          $3.0
          $2.0
          $1.0
          $0.0
                             2019E                        2020E                       2021E                           2022E
               Renewables            Gas Pipelines          NEET (2) Gas Infrastructure                Maintenance & Other

                       Energy Resources expects to invest $25 B to $28 B
                                  over the next four years

   1) Includes Energy Resources’ capital expenditures from consolidated investments as well as its share of capital
      expenditures from equity method investments; includes nuclear fuel
28 2) NextEra Energy Transmission reported in Corporate & Other
We remain well positioned to continue our strong adjusted
   EPS growth
                            NextEra Energy’s
                Adjusted Earnings Per Share Expectations(1)
                                                                            •     For 2019 through 2021, expect
                                                            $10.00 -
                                                                                  6% - 8% growth off a 2018 base
                                              $9.40 -
                                                            $10.75                of $7.70, plus the expected
                               $8.70 -        $9.95                               accretion from Florida
                $8.00 -        $9.20                                              acquisitions
                $8.50
  $7.70
                                                                                    – The Florida acquisitions are
                                                                                      expected to be $0.15 and $0.20
                                                                                      accretive in 2020 and 2021,
                                                                                      respectively
                                                                            •     For 2022, expect 6% - 8%
                                                                                  growth off 2021 adjusted EPS
                                                                            •     Remain committed to
                                                                                  maintaining the strength of our
  2018          2019E         2020E          2021E         2022E                  balance sheet
             Expected accretion from FL acquisitions(1)

In 2019, will be disappointed to not be at the top end of 6% - 8% growth rate off
  2018 base of $7.70, which, if achieved, would result in adjusted EPS of $8.32

  29   1) Includes Gulf Power, Florida City Gas, and the Stanton and Oleander natural gas power plants
We expect to continue to grow our dividends per share
        12% - 14% per year through at least 2020, an above average
        rate compared to our peers

             NextEra Energy Dividend Per Share Expectations
                                                                                    •     In 2018, extended expected
                                                                          $4.44           growth in DPS of 12% - 14%
                                                                                          per year through at least
                                                                                          2020, off a 2017 base
                                                                                    •     Achieved ~13% year-over-
                                                                                          year DPS growth in 2018
                                                                                    •     2019 payout ratio expected
                                                                                          to be ~60%(1)
$1.20
                                                                                    •     Conservative payout ratio is
                                                                                          expected to allow for
                                                                                          continued DPS growth in
                                                                                          excess of adjusted EPS
'03 '04 '05 '06 '07 '08 '09 '10 '11 '12 '13 '14 '15 '16 '17 '18
                                                                                          growth
                   We expect to revisit our post-2020 dividend policy during the
                                        first quarter of 2020

       1) Assumes adjusted earnings per share at NextEra Energy to be in the range of $8.00 to $8.50, and at or near the
          upper end of our previously disclosed 6% to 8% CAGR, off a 2018 base
    30 Note: Dividend declarations are subject to the discretion of the Board of Directors of NextEra Energy
NextEra Energy presents a compelling investment opportunity

                           NextEra Energy Value Proposition
     Drill-down of S&P 500 Companies                                                       Annual Total Return Potential
                                                                                                  11% - 12%
                          362                           Investment grade (1)                                             10%

                          220                 Market capitalization > $20 B
                                                                                                            (4)
                                                                                                     NEE           Median S&P 500(2)

                          139           Adj. EPS CAGR > 8% past 5 years                                 DPS Growth(3)
                                                                                                      12%

                           75      ‘18 – ‘21E Annual Total Return(2) > 10%                                               5%

                           30                ‘18 – ‘21E DPS CAGR(3) > 10%                            NEE           Median S&P 500
                                                                                                                  Beta
                                                                                                                         1.0
                            1                       Beta past 5 years < .50
                                                                                                      0.4

                                                                                                     NEE           Median S&P 500

     1) S&P credit rating as of 12/31/2018
     2) Consensus 2018 – 2021 adjusted EPS compound annual growth rate plus 8/20/2019 dividend yield
     3) Based on consensus estimate 2018 – 2021 compound annual growth rate
     4) NextEra’s 2018 – 2021 adjusted EPS compound annual growth rate guidance plus 8/20/2019 dividend yield
31   Source: FactSet as of 8/20/2019
32
In the five years since the IPO, NextEra Energy Partners has
    built a best-in-class diversified clean energy company

                             NextEra Energy Partners’ Portfolio(1)
•    Stable cash flows supported by:
         – Long-term contracts with credit-
           worthy counterparties
         – Geographic and asset diversity
•    ~5,330 MW of renewables
         – ~4,575 MW wind
         – ~750 MW solar
•    ~4 Bcf total natural gas pipeline
     capacity
         – Seven natural gas pipelines
         – ~542 miles                                                        Wind assets
                                                                             Solar assets
         – ~3 Bcf of contracted capacity                                     Pipeline assets

                      Solid distribution growth through accretive acquisitions

          1) Current portfolio as of June 30, 2019
    33
NEP’s value proposition is built upon four core strengths

                      NextEra Energy Partners’ Core Strengths
               High-Quality Portfolio(1)                                          Financial Strength and Flexibility
                                                                                                             Issuer Credit
                             Diversified             ~5.3 GW                      Ability to                   Rating (3)        Year-end 2018
   16-Yr                    Portfolio w ith            Renew ables
                                                         Capacity
                                                                              opportunistically          Ba1/BB/BB+               ~1.2x
  Rem aining                     48                                              access the
                                                                                                         supports 4x-5x           Coverage
 Contract Life (2)
                           counterparties              ~4 Bcf                  capital markets
                                                                                                         Holdco debt / project     Ratio(4)
                                                     Pipeline Capacity                                          CAFD

     Tax-Advantaged Structure(5)                                                        Opportunities For Growth
                            ≥8 years                Treated as C-Corp                                         Clean energy
                                                                                                                assets at
≥15 years                 Potential return of       for U.S federal tax         Organic                  Energy
 Not expected to
                           capital treatm ent         purposes with
                                                                              prospects for Texas                                3rd Party
 pay significant
                          for distributions to
                              the extent of
                                                    Form 1099                    Pipelines and          Resources,                acquisitions
U.S. federal taxes                                    for investors              Repow erings                including future
                             investor’s tax                                                                    development
                                  basis                   (vs K1)

          1) Current portfolio as of June 30, 2019
          2) Weighted on calendar year 2020 Cash Available for Distribution (CAFD) expectations for current portfolio
          3) Moody’s, Standard & Poor’s, and Fitch ratings, respectively
          4) Assumes calendar year 2019 expectations for portfolio as of 12/31/18, divided by the product of annualized
             LP distributions of $1.86 and 157 MM outstanding units, plus distributions made to the Series A Preferred Units
          5) As of December 31, 2018; should not be construed as tax advice
   34
NEP continues to focus on investing in long-term contracted
    clean energy assets with strong creditworthy counterparties
    and attractive cash flows
                                             Growth Strategy

                Wind
                 Wind                        Solar
                                                                      Organic
                             Long-Term                                Growth
                              Contract
                                             Clean
                Strong                       Energy
               Operations                  Technology
                                                                    Acquisitions
 Competitive                 Attractive                   Battery
                              Asset to                    Storage
                                                                    from Energy
Transmission
                                NEP                                  Resources
               Limited or                  Creditworthy
               Monetized                    Customer
               Tax Credits
                               Stable
                             Regulatory                              3rd Party
                             Environment                            Acquisitions
                  Other
                                             Natural
                  Clean
                 Energy                        Gas
                                            Pipelines
                 Assets

          Any clean energy asset that fits these criteria may be suitable for
                               acquisition by NEP

    35
Acquisitions from Energy Resources provide clear visibility to
     continued growth at NEP

                              Energy Resources’ Renewable
                               Portfolio Since NEP’s IPO(1)
GW                                                                                                     ~22 GW -
30                                                                                     ~7 GW            29 GW

25                                                                          ~10 GW
20
                                 ~7 GW                ~5 GW
15
10        ~10 GW

5
0
           NEER's            MW Placed in         MW Sold to NEP Current Backlog      Additional    Current Portfolio
                                                                                 (2)
        Renewables             Service              since IPO    (ex. Repowering) Potential 2019- including Backlog
      Portfolio after IPO                                                            2022 Growth(3)    & Growth

           Energy Resources’ portfolio alone provides one potential path to
                     12% - 15% growth per year through 2024
       1) Current portfolio as of June 30, 2019
       2) Includes renewables backlog of 11.7 GW less 2.1 GW of repowering backlog
       3) Assuming top end of remaining 2019 – 2022 development expectations
 36
NEP is well positioned to benefit from the significant wind
    and solar growth that is expected over the coming years
                        NEP & Long-Term Renewables Demand
          U.S. Renewable Energy
          Capacity through 2030                                                 U.S. Renewables Penetration
                                                            ~500 GW

                                                                                                                     ~40%

                                                                                                         ~15%
                                                                                                          CAGR
                                                                                                         in MWh
                                                                                                        generation
                                             ~200 GW

                              ~100 GW
                                                                                        8%
                ~22 GW
                – 29 GW
  ~5 GW
Current NEP       NEER         Other         Expected       Expected                   2018                          2030
 Portfolio(1)    Portfolio    Existing         2022           2030
                including     Capacity (3)   Installed      Installed
                 Backlog                     Capacity (4)   Capacity (4)
                & Growth(2)

                NEP is well positioned to capture a meaningful share of future
                                     renewables growth
         1) Current portfolio as of June 30, 2019
         2) Includes renewables backlog of 11.7 GW less 2.1 GW of repowering backlog plus top end of remaining
            2019 – 2022 development expectations
         3) Source: IHS Markit
    37   4) Source: Additional installed capacity from National Renewable Energy Laboratory (NREL)
NEP’s balance sheet and financing flexibility are expected
    to create a sustainable base for future growth

                                  Financial Flexibility
             Corporate Credit
                                                    Convertible   PAYGO Tax
•
                                                                                    High-Yield
     NEP corporate credit ratings:                     Equity       Equity             Debt
                                                      Portfolio
                                                                                                 Revolving
                                                     Financing
         – S&P: BB, stable                                                                         Credit
                                                                                                  Facility
                                             Convertible
                                              Preferred               Financing
         – Moody’s: Ba1, stable                                       Flexibility                      Bank
                                                                                                       Term
                                                                                                       Loans
         – Fitch: BB+, stable                 Convertible
                                                 Debt
                                                                           Project
                                                                                         Term Loan B
•    Credit profile is expected to                           Equity      Financing/
                                                                        Refinancing
     support HoldCo debt up to 5.0x
     project distributions

         Access to low-cost financing is a key competitive advantage for NEP

    38
Convertible equity portfolio financings (CEPF) leverage
    private infrastructure capital as an attractive equity issuance
    tool
     Leveraging Private Clean Energy Infrastructure Capital
            NEP Objectives                  CEPF Attributes

 Efficient access to capital to
  fund accretive acquisitions
                                      Significant infrastructure fund
                                      commitments drives demand

 Avoid equity issuance discount
  or loss of unit price upside
                                      At buy-out, equity issued at then-
                                      current market price
    Low initial cash financing cost   Lowest initial effective coupons of
   to reduce future asset needs      NEP’s financings
                                      Attractive target returns expected to
 Low lifetime financing cost         produce lowest equity-like cost of
                                      capital
    Layer in common equity over       Funds’ desire for return upside and
   time                              liquidity allows buyouts to be
                                      funded at least 70% in NEP units
     Favorable rating agency          Equity credit treatment from all
    treatment                        rating agencies

    39
The future release of cash flow from PG&E-related assets
 combined with the organic growth opportunities could provide
 NEP roughly one and a half years of CAFD and DPU growth

                     NEP Portfolio – Embedded CAFD Growth
                                                                     +22%
                                                                                      $95 - $105         ($25 - $30)
                                                                                                                        $510 - $580

                                                 $15 - $20         ($10 - $15)
$ MM                          $25 - $30
          $410 - $480

        2019Run
       2019  Run-Rate
                 Rate Repowerings                 Texas            Financing        PG&E CAFD
                                                                                    Release of          Incremental     CAFD Post-
          CAFD(No
         CAFD   (No                              Pipelines           Costs (2)
                                                                           (1)     PG&E-Related             IDRs         Organic
            PG&E)
       PG&E-Related)                              Growth                              CAFD                               Growth

           The CAFD growth embedded in NEP’s existing portfolio provides
                      an attractive organic growth opportunity

        1) Net cash outlays for repowerings plus capital expenditures for Texas Pipelines expansion offset by release
  40       of trapped PG&E-related cash, funded at 5% interest rate
NEP is extending its distribution growth expectations through
2024, which is best-in-class

          NextEra Energy Partners Financial Expectations
 Annualized LP Distributions(1)                                                 Adjusted EBITDA and CAFD(3)

                                                     Annual                          $1,200 MM-
                                                   12% - 15%                         $1,375 MM
                                                    Growth(2)

                     $2.14                                                                                  $485 MM -
     $1.86                                                                                                  $555 MM         $410 MM -
                                                                                                                            $480 MM

     Q4 2018       Q4 2019E                        Q4 2024E                           12/31/2019           12/31/2019       12/31/2019
                                                                                       Run Rate             Run Rate         Run Rate
                                                                                     Adj. EBITDA         CAFD w/ PG&E-    CAFD w/o PG&E-
                                                                                                             Related(4)       Related

      1) Represents expected fourth quarter annualized distributions payable in February of the following year
      2) From a base of our fourth quarter 2018 distribution per common unit at an annualized rate of $1.86
      3) Run Rate reflects calendar year 2020 expectations for forecasted portfolio as of 12/31/19; includes current
         portfolio; Adjusted EBITDA expectations include full contributions from projects related to PG&E as revenue is
         expected to continue to be recognized; see Appendix for additional detail
41    4) Assuming favorable resolution of the current events of default for our PG&E-related assets
NextEra Energy Partners presents a compelling investment
    opportunity

                  NextEra Energy Partners Value Proposition
Drill-down of Russell 1000 Companies & NEP                                                 Total Return Potential
                                                                                                        ~4%          16% - 19%
                           702                       Debt / EBITDA(1) < 5x

                                                                                       12% - 15%
                           128                        Dividend yield > 3%

                            12          DPS growth > 100% past 4 years

                             3             ‘18 – ‘21E DPS CAGR(2) > 12%

                                                     Growth expectations
                             1                              through 2024               Distribution   Distribution     Annual
                                                                                     Growth Through      Yield (3)   Total Return
                                                                                      At Least 2024

    Opportunity to earn an after-tax total return of 16% - 19% per year through
                                   at least 2024
        1) S&P’s preliminary 2018 metric based on NextEra Energy Partners’ calculation used for NEP
        2) Based on consensus estimates
        3) Based on NextEra Energy Partners distribution yield as of 8/20/2019
   42   Source: FactSet as of 8/20/2019
Appendix

43
44
Contracted Wind and Solar Development Program(1)
                                    (Signed Contracts as of July 24, 2019)
Wind                                     Location           MW                Solar                                   Location           MW
2019 – 2020:                                                                  2019 – 2020:
Burke                                       ND                  200           Blythe III                                 CA                125
Emmons-Logan                                ND                  300           New England                              Various              49
Crowned Ridge I                             SD                  300           Wilmot                                     AZ                100
Sky River                                   CA                   62           Blythe IV                                  CA                125
Dodge County                                MN                  170           Quitman                                    GA                150
Borderlands                                 NM                  100
                                                                              Shaw Creek                                 SC                 75
Roundhouse                                  WY                  225
                                                                              Chicot                                     AR                100
Soldier Creek                               KS                  300
Blue Summit III                             TX                  201           Dougherty                                  GA                120
White Hills                                 AZ                   50           Grazing Yak                                CO                 35
Buffalo Ridge                               MN                  109           Florida                                    FL                224
Pegasus                                     MI                  151           Saint                                      AZ                100
Sholes                                      NE                  160           Two Creeks (BOT)                           WI                150
Cerro Gordo                                 IA                   40           Distributed Generation                   Various             132
Skeleton Creek                              OK                  250                                           Total 2019 – 2020 Solar:   1,485
Jordan Creek                                IN                  400           2021 – 2022:
Bronco Plains                               CO                  300           Point Beach                                WI                100
Cedar Springs                               WY                  200           Route 66                                  NM                  50
Wheatridge                                  OR                  200           Dodge Flat                                 NV                200
Wheatridge (BOT)                            OR                  100
                                                                              Fish Springs Ranch                         NV                100
Contracted, not yet announced                                   120
                                                                              Arlington                                  CA                131
                                  Total 2019 – 2020 Wind:     3,938
                                                                              High River                                 NY                 90
2021 – 2022:
                                                                              East Point                                 NY                 50
Eight Point                                 NY                 102            Bellefonte                                 AL                150
Contracted, not yet announced                                  290            Elora                                      TN                150
                                  Total 2021 – 2022 Wind:      392            Wheatridge                                 OR                 50
                                                                              New England                              Various             194
                                                                              Excelsior                                  NY                280
                                                                              Trelina                                    NY                 80
                                                                              Watkins Glen                               NY                 50
                                                                              Arlington                                  CA                233
                                                                              Contracted, not yet announced                                450
                                                                                                              Total 2021 – 2022 Solar:   2,358
                                                                              Post – 2022:
                                                                              Proxima                                    CA                50
                                                                              Skeleton Creek                             OK               250
                                                                              Chariot                                    NH                50
                                                                              Contracted, not yet announced                               330
                                                                                                              Total Post – 2022 Solar:    680

       1) 2019+ COD and current backlog of projects with signed long-term contracts, all projects are subject to
 45       development and construction risk
Energy Storage Development Program(1)
                                          (Signed Contracts as of July 24, 2019)
Project                                Location      MW        Duration        Project                                  Location   MW    Duration
2019 – 2020:                                                                   Post – 2022:
Montauk                                   NY           5          8.0          Proxima                                    CA        5      4.0
Wilmot                                    AZ          30          4.0          Contracted, not yet announced                       203
Rush Springs                              OK          10          2.0                                                    Total:    208
Minuteman                                 MA           5          2.0
                                         Total:       50
2021 – 2022:
Dodge Flat                                NV          50          4.0
Fish Springs Ranch                        NV          25          4.0
Arlington                                 CA         110          4.0
Wheatridge                                OR          30          4.0
Excelsior                                 NY          20          4.0
Contracted, not yet announced                        225
                                         Total:      460

            1) 2019+ COD and current backlog of projects with signed long-term contracts, all projects are subject to
     46        development and construction risks
U.S. Federal tax incentives for completed renewables projects
have been extended into the next decade

                     Extended U.S. Federal Tax Credits
            Wind Production                          Solar Investment
            Tax Credit (PTC)                         Tax Credit (ITC)
        Start of                                 Start of
      Construction     COD        Wind         Construction       COD             Solar
         Date         Deadline    PTC             Date           Deadline          ITC
     During 2016     12/31/2020   100%        During 2019       12/31/2023        30%
     During 2017     12/31/2021   80%         During 2020       12/31/2023        26%
     During 2018     12/31/2022   60%         During 2021       12/31/2023        22%
     During 2019     12/31/2023   40%         Before 2022     1/1/2024 or After   10%

•    Solar ITC guidance published by IRS in 2018 is consistent with
     previous wind PTC guidance
     – Safe harbor is deemed satisfied if taxpayer incurs 5% of the construction
       costs and property is placed in service within four calendar years
     – ITC guidance covers storage that is at least 75% charged by the solar
       ITC facility

47
NextEra Energy’s credit metrics remain on track

                          Credit Metrics
                            A-        Downgrade   Target
        S&P                Range      Threshold    2019
        FFO/Debt          13%-23%       21%       >21%

        Debt/EBITDA       3.5x-4.5x               18%
        CFO-Div/Debt      9%-17%                  >12%

                             A        Downgrade   Target
        Fitch             Midpoint    Threshold    2019
        Debt/FFO            3.5x        4.25x     5.0x

48
Reconciliation of Earnings Per Share Attributable to
                NextEra Energy, Inc. to Adjusted Earnings Per Share

     1) Amounts have been retrospectively adjusted for accounting standard update related to leases
     2) Beginning in 2018, reflects the implementation of an accounting standards update related to financial instruments
     3) Net of approximately $0.08 of income tax benefit at FPL in 2017
49
Definitional information
NextEra Energy, Inc. Adjusted Earnings Expectations
This presentation refers to adjusted earnings per share expectations. Adjusted earnings expectations exclude the cumulative effect
of adopting new accounting standards, the effects of non-qualifying hedges and unrealized gains and losses on equity securities
held in NextEra Energy Resources’ nuclear decommissioning funds and OTTI, none of which can be determined at this time.
Adjusted earnings expectations also exclude the effects of transitional impacts of tax reform, including the impact on differ ential
membership interests, NextEra Energy Partners, LP net investment gains, the operating results from the Spain solar project, a nd
acquisition related expenses. In addition, adjusted earnings expectations assume, among other things: normal weather and
operating conditions; continued recovery of the national and the Florida economy; supportive commodity markets; current forwa rd
curves; public policy support for wind and solar development and construction; market demand and transmission expansion to
support wind and solar development; market demand for pipeline capacity; access to capital at reasonable cost and terms; no
divestitures, other than to NextEra Energy Partners, LP, or acquisitions; no adverse litigation decisions; and no changes to
governmental tax policy or incentives. Expected adjusted earnings amounts cannot be reconciled to expected net income becaus e
net income includes the effect of certain items which cannot be determined at this time.

NextEra Energy Resources, LLC. Adjusted EBITDA
Adjusted EBITDA includes NextEra Energy Resources consolidated investments, excluding Spain, its share of NEP and forecasted
investments, as well as its share of equity method investments. Adjusted EBITDA represents projected (a) revenue less (b) fue l
expense, less (c) project operating expenses, less (d) corporate G&A, plus (e) other income, less (f) other deductions. Adju sted
EBITDA excludes the impact of non-qualifying hedges, other than temporary impairments, certain differential membership costs,
and net gains associated with NEP’s deconsolidation beginning in 2018. Projected revenue as used in the calculations of Adjus ted
EBITDA represents the sum of projected (a) operating revenue plus a pre -tax allocation of (b) production tax credits, plus (c)
investment tax credits and plus (d) earnings impact from convertible investment tax credits.

NextEra Energy Resources, LLC. Adjusted EBITDA by Asset Category
Adjusted EBITDA by Asset Category includes NextEra Energy Resources consolidated investments, excluding Spain, its share of
NEP and forecasted investments, as well as its share of equity method investments. Adjusted EBITDA by Asset Category
represents projected (a) revenue less (b) fuel expense, less (c) project operating expenses, less (d) a portion of corporate G&A
deemed to be associated with project operations, plus (e) other income, less (f) other deductions. Adjusted EBITDA by Asset
Category excludes the impact of non-qualifying hedges, other than temporary impairments, corporate G&A not allocated to project
operations, and certain differential membership costs. Projected revenue as used in the calculations of Adjusted EBITDA by As set
Category represents the sum of projected (a) operating revenue plus a pre -tax allocation of (b) production tax credits, plus (c)
investment tax credits and plus (d) earnings impact from convertible investment tax credits.

50
Cautionary Statement And Risk Factors That May Affect
Future Results
This presentation contains “forward-looking statements” within the meaning of the safe harbor provisions of the Private Securities
Litigation Reform Act of 1995. Forward-looking statements are not statements of historical facts, but instead represent the cur rent
expectations of NextEra Energy, Inc. (together with its subsidiaries, NextEra Energy) regarding future operating results and other future
events, many of which, by their nature, are inherently uncertain and outside of NextEra Energy's control. Forward -looking statements in
this presentation include, among others, statements concerning adjusted earnings per share expectations and future operating
performance, statements concerning future dividends, and results of acquisitions. In some cases, you can identify the forward -looking
statements by words or phrases such as “will,” “may result,” “expect,” “anticipate,” “believe,” “intend,” “plan,” “seek,” “po tential,”
“projection,” “forecast,” “predict,” “goals,” “target,” “outlook,” “should,” “would” or similar words or expressions. You sh ould not place
undue reliance on these forward-looking statements, which are not a guarantee of future performance. The future results of Next Era
Energy and its business and financial condition are subject to risks and uncertainties that could cause actual results to dif fer materially
from those expressed or implied in the forward-looking statements, or may require it to limit or eliminate certain operations. These risks
and uncertainties include, but are not limited to, the following: effects of extensive regulation of NextEra Energy's busine ss operations;
inability of NextEra Energy to recover in a timely manner any significant amount of costs, a return on certain assets or a re asonable
return on invested capital through base rates, cost recovery clauses, other regulatory mechanisms or otherwise; impact of pol itical,
regulatory and economic factors on regulatory decisions important to NextEra Energy; disallowance of cost recovery based on a finding
of imprudent use of derivative instruments; effect of any reductions or modifications to, or elimination of, governmental inc entives or
policies that support utility scale renewable energy projects or the imposition of additional tax laws, policies or assessmen ts on
renewable energy; impact of new or revised laws, regulations, interpretations or ballot or regulatory initiatives on NextEra Energy; capital
expenditures, increased operating costs and various liabilities attributable to environmental laws, regulations and other sta ndards
applicable to NextEra Energy; effects on NextEra Energy of federal or state laws or regulations mandating new or additional l imits on the
production of greenhouse gas emissions; exposure of NextEra Energy to significant and increasing compliance costs and substan tial
monetary penalties and other sanctions as a result of extensive federal regulation of its operations and businesses; effect o n NextEra
Energy of changes in tax laws, guidance or policies as well as in judgments and estimates used to determine tax-related asset and
liability amounts; impact on NextEra Energy of adverse results of litigation; effect on NextEra Energy of failure to proceed with projects
under development or inability to complete the construction of (or capital improvements to) electric generation, transmission and
distribution facilities, gas infrastructure facilities or other facilities on schedule or within budget; impact on developmen t and operating
activities of NextEra Energy resulting from risks related to project siting, financing, construction, permitting, governmental approvals and
the negotiation of project development agreements; risks involved in the operation and maintenance of electric generation, tr ansmission
and distribution facilities, gas infrastructure facilities, retail gas distribution system in Florida and other facilities; e ffect on NextEra Energy
of a lack of growth or slower growth in the number of customers or in customer usage; impact on NextEra Energy of severe weat her and
other weather conditions; threats of terrorism and catastrophic events that could result from terrorism, cyber attacks or other attempts to
disrupt NextEra Energy's business or the businesses of third parties; inability to obtain adequate insurance coverage for pro tection of
NextEra Energy against significant losses and risk that insurance coverage does not provide protection against all significan t losses; a
prolonged period of low gas and oil prices could impact NextEra Energy’s gas infrastructure business and cause NextEra Energy to delay
or cancel certain gas infrastructure projects and could result in certain projects becoming impaired; risk of increased opera ting costs
resulting from unfavorable supply costs necessary to provide full energy and capacity requirement services; inability or fail ure to manage
properly or hedge effectively the commodity risk within its portfolio; effect of reductions in the liquidity of energy market s on NextEra
Energy's ability to manage operational risks;

51
Cautionary Statement And Risk Factors That May Affect
Future Results (cont.)
effectiveness of NextEra Energy's risk management tools associated with its hedging and trading procedures to protect against
significant losses, including the effect of unforeseen price variances from historical behavior; impact of unavailability or disruption of
power transmission or commodity transportation facilities on sale and delivery of power or natural gas; exposure of NextEra Energy to
credit and performance risk from customers, hedging counterparties and vendors; failure of counterparties to perform under derivative
contracts or of requirement for NextEra Energy to post margin cash collateral under derivative contracts; failure or breach of NextEra
Energy's information technology systems; risks to NextEra Energy's retail businesses from compromise of sensitive customer data;
losses from volatility in the market values of derivative instruments and limited liquidity in OTC markets; impact of negative publicity;
inability to maintain, negotiate or renegotiate acceptable franchise agreements; occurrence of work strikes or stoppages and
increasing personnel costs; NextEra Energy's ability to successfully identify, complete and integrate acquisitions, includingthe effect
of increased competition for acquisitions; the inability to realize the anticipated benefits of the Gulf Power Company acquisition;
environmental, health and financial risks associated with ownership and operation of nuclear generation facilities; liability of NextEra
Energy for significant retrospective assessments and/or retrospective insurance premiums in the event of an incident at certain
nuclear generation facilities; increased operating and capital expenditures and/or reduced revenues at nuclear generation facilities
resulting from orders or new regulations of the Nuclear Regulatory Commission; inability to operate any of NextEra Energy’s owned
nuclear generation units through the end of their respective operating licenses or through expected shutdown; effect of disruptions,
uncertainty or volatility in the credit and capital markets or actions by third parties in connection with project-specific or other financing
arrangements on NextEra Energy's ability to fund its liquidity and capital needs and meet its growth objectives; inability to maintain
current credit ratings; impairment of liquidity from inability of credit providers to fund their credit commitments or to maintain their
current credit ratings; poor market performance and other economic factors that could affect NextEra Energy's defined benefit pension
plan's funded status; poor market performance and other risks to the asset values of nuclear decommissioning funds; changes in
market value and other risks to certain of NextEra Energy's investments; effect of inability of NextEra Energy subsidiaries to pay
upstream dividends or repay funds to NextEra Energy or of NextEra Energy's performance under guarantees of subsidiary obligations
on NextEra Energy's ability to meet its financial obligations and to pay dividends on its common stock; the fact that the amount and
timing of dividends payable on NextEra Energy's common stock, as well as the dividend policy approved by NextEra Energy's board
of directors from time to time, and changes to that policy, are within the sole discretion of NextEra Energy's board of directors and, if
declared and paid, dividends may be in amounts that are less than might be expected by shareholders; NEP’s inability to access
sources of capital on commercially reasonable terms could have an effect on its ability to consummate future acquisitions and on the
value of NextEra Energy’s limited partner interest in NextEra Energy Operating Partners, LP; and effects of disruptions, uncertainty or
volatility in the credit and capital markets on the market price of NextEra Energy's common stock. NextEra Energy discusses these
and other risks and uncertainties in its annual report on Form 10-K for the year ended December 31, 2018 and other SEC filings, and
this presentation should be read in conjunction with such SEC filings made through the date of this presentation. The forward-looking
statements made in this presentation are made only as of the date of this presentation and NextEra Energy undertakes no obligation
to update any forward-looking statements.

52
53
NEP - PG&E Related Projects
                                                                               12/31/18 Run   12/31/19 Run                                12/31/18     Financing
                                                        PPA      Price          Rate CAFD      Rate CAFD                                 Financing      Maturity
                                                                         (1)
Project                     Customer   MW      COD      Term   ($/MWh)            ($MM)          ($MM)               Financing            Balance         Date
                                                                                                                                                 (2)
Genesis Solar                PG&E      250     Mar-14    25      $214           $41 - $45      $41 - $45     Genesis Solar LLC             $402           2038
                                                                                                             Genesis Solar Funding LLC     $254           2038

                                         (3)                                                                                                  (2)(4)
Desert Sunlight 300          PG&E      150     Dec-14    25      $156           $25 - $27      $28 - $30     Desert Sunlight 300 LLC      $266         2026 & 2036

                      (5)                (3)                                                                                                  (2)(4)
Desert Sunlight 250           SCE      125     Dec-14    20      $150           $20 - $22      $24 - $26     Desert Sunlight 250 LLC      $227         2026 & 2036

Shafter Solar                PG&E       20     May-15    20      $94               ~$1            ~$1        Shafter Solar LLC             $26            2033

       1) Based on FERC Electric Quarterly Report data for the last four consecutive quarters (Q4 2017 through Q3
          2018), rounded to nearest $/MWh
       2) Project debt is partially guaranteed by the U.S. Department of Energy (80% of principal and interest payments)
       3) Net MW; NEP is 49.9% owner of Desert Sunlight 300 and Desert Sunlight 250
       4) Represents NEP’s pro-rata share of outstanding loan balance
       5) Due to provisions in the financings, an event of default under Desert Sunlight 300 financing can prevent
          distributions from Desert Sunlight 250
  54
Expected Cash Available for Distribution(1)
                                   (December 31, 2019 Run Rate CAFD)
$1,325-$1,500 ($20-$30)
                                 ($90-$100)
                                              $1,200-$1,375 ($210-$260)

                                                                            ($430-$510)

                                                                                          ($30-$35)
                                                                                                       ($5-$15)    $485-$555     ($95-$105)
                                                                                                                                               $410-$480

     Project-Level   Corporate   IDR Fees       Adjusted       Debt           Pre-Tax      Non-Cash Maintenance    Estimated       Trapped
                                                                                                                                 Unavailable     Estimated
                                                       (2)
       Adjusted      Expenses                   EBITDA        Service (3)   Tax Credits (4) Income (5) Capital      Pre-Tax         Cash
                                                                                                                                  Cash  for       Pre-Tax
       EBITDA                                                                                                        CAFD        Distribution(6) CAFD w/o
                                                                                                                    w/PG&E                         PG&E(7)
        1) See Appendix for definition of Adjusted EBITDA and CAFD expectations; Project-Level Adjusted EBITDA
           represents Adjusted EBITDA before IDR Fees and Corporate Expenses
        2) Includes full contributions from projects related to PG&E as revenue is expected to continue to be recognized
        3) Debt service includes principal and interest payments on existing and projected third party debt, distributions net
           of contributions to/from tax equity investors, BlackRock’s and KKR’s expected share of distributable cash flow
           from convertible equity portfolio financings; excludes distributions to preferred equity investors
        4) Pre-tax tax credits include investment tax credits, production tax credits earned by NEP, and production tax
           credits allocated to tax equity investors
        5) Primarily reflects amortization of CITC
        6) Related to PG&E related assets Genesis, Desert Sunlight 250/300, Shafter
55      7) CAFD excludes proceeds from financings and changes in working capital
Definitional information
NextEra Energy Partners, LP. Adjusted EBITDA and CAFD Expectations
This presentation refers to adjusted EBITDA and CAFD expectations. NEP’s adjusted EBITDA expectations represent projected (a)
revenue less (b) fuel expense, less (c) project operating expenses, less (d) corporate G&A, plus (e) other income less (f) ot her
deductions including IDR fees. Projected revenue as used in the calculations of projected EBITDA represents the sum of projec ted
(a) operating revenues plus (b) a pre-tax allocation of production tax credits, plus (c) a pre-tax allocation of investment tax credits
plus (d) earnings impact from convertible investment tax credits and plus (e) the reimbursement for lost revenue received pursuant
to a contract with NextEra Energy Resources.

CAFD is defined as cash available for distribution and represents adjusted EBITDA less (1) a pre -tax allocation of production tax
credits, less (2) a pre-tax allocation of investment tax credits, less (3) earnings impact from convertible investment tax credits, less
(4) debt service, less (4) maintenance capital, less (5) income tax payments less, (6) other non-cash items included in adjusted
EBITDA if any. CAFD excludes changes in working capital and distributions to preferred equity investors.

NextEra Energy Partners' expectations of 12/31/19 run rate adjusted EBITDA and CAFD reflect the consummation of forecasted
acquisitions. These measures have not been reconciled to GAAP net income because NextEra Energy Partners did not prepare
estimates of the effect of these acquisitions on certain GAAP line items that would be necessary to provide a forward -looking
estimate of GAAP net income, and the information necessary to provide such a forward -looking estimate is not available without
unreasonable effort.

 56
You can also read