September 2019 Strategy & 2Q19 Results - El Puerto de ...

Page created by Sue Espinoza
 
CONTINUE READING
September 2019 Strategy & 2Q19 Results - El Puerto de ...
September 2019
Strategy & 2Q19 Results
September 2019 Strategy & 2Q19 Results - El Puerto de ...
Safe Harbor

This presentation has been prepared by El Puerto de Liverpool, S.A.B. de C.V. (together with its subsidiaries, “Liverpool”), is strictly confidential, is not intended for general
distribution and may only be used for informational purposes. This presentation may contain proprietary, trade-secret, and commercially sensitive information and neither this
presentation nor the information contained herein may be copied, disclosed or provided, in whole or in part, to third parties for any purpose. By receiving this presentation, you
become bound by the above referred confidentiality obligation and agree that you will, and will cause your representatives and advisors to, use the information contained herein only
to evaluate a credit rating for Liverpool and for no other purpose. Failure to comply with such confidentiality obligation may result in civil, administrative or criminal liabilities. The
distribution of this presentation in other jurisdictions may also be restricted by law and persons into whose possession this presentation comes should inform themselves about and
observe any such restrictions.

Although the information presented in this document has been obtained from sources that Liverpool believes to be reliable, Liverpool does not make any representation as to its
accuracy, validity, timeliness or completeness for any purpose. The information set forth herein does not purport to be complete and Liverpool is not responsible for errors and/or
omissions with respect to the information contained herein. Certain of the information contained in this presentation represents or is based upon forward-looking statements or
information. These forward-looking statements may relate to Liverpool’s financial condition, results of operations, plans, objectives, future performance and business, including, but
not limited to, statements with respect to outlooks and growth prospects, liquidity, capital resources and capital expenditure, growth in demand for our products, economic outlook
and industry trends, development of our markets, competition in areas of our business; and plans to launch new products and services, and the effect of legal proceedings and new
laws, rules and regulations and accounting standards on Liverpool’s financial condition and results of operations. All statements contained in this presentation that are not clearly
historical in nature are forward-looking, and the words “anticipate,” “believe,” “continues,” “expect,” “estimate,” “intend,” “project” and similar expressions and future
or conditional verbs such as “will,” “would,” “should,” “could,” “might,” “can,” “may” or similar expressions are generally intended to identify forward-looking
statements. The information in this presentation, including but not limited to forward-looking statements, applies only as of the date of this presentation and is not intended to give
any assurance as to future results. Liverpool and its advisors expressly disclaim any obligation or undertaking to update or revise the information, including any financial data and
forward-looking statements, and will not publicly release any revisions they may make to this presentation that may result from events or circumstances arising after the date of this
presentation.

Any projections included herein have been prepared based on Liverpool’s views as of the date of this presentation of future events and financial performance and various
estimations and assumptions, including estimations and assumptions about future events, may prove to be incorrect or may change over time. The projections have been prepared
and are set out for illustrative purposes only, and do not constitute a forecast. While the projections are based on assumptions that Liverpool believes are reasonable under the
circumstances, they are subject to uncertainties, changes (including changes in economic, operational, political, legal, and other circumstances) and other risks, all of which are
beyond Liverpool’s control and any of which may cause the relevant actual, financial and other results to be materially different from the results expressed or implied by such
projections. No assurance, representation or warranty is made by any person that any of the projections will be achieved and no recipient should rely on the projections. None of
Liverpool, its affiliates, Citigroup Global Markets Inc., Merrill Lynch, Pierce, Fenner & Smith Incorporated or any of their respective directors, officers, employees, partners,
shareholders, advisers and agents makes any assurance, representation or warranty as to the accuracy of the projections. Nothing contained in this presentation may be relied upon
as a guarantee, promise or forecast or a representation as to the future. Liverpool undertakes no obligation to update the projections or any of the information contained in this
presentation. (1.0)

                                                                                                                                                                                              2
September 2019 Strategy & 2Q19 Results - El Puerto de ...
OMNI-EXPERIENCE ENTITY

 121 stores (Nationwide presence)

                                                                         126 boutiques (Presence in
                                                                         +65% of country)

                                                    - Digital Sales
                                    Omni-experience - Click & Collect
 138 stores (Nationwide presence)                   - Liverpool Pocket
                                                    - Seller´s App
                                                    - Extended Catalog
                                                                          - Private label cards *
                                                                          - VISA cards
                                                                          - 5.2M card holders
27 Shopping malls (Presence
across 17 states)

*For   Liverpool & Suburbia.
                                                                                                      3
September 2019 Strategy & 2Q19 Results - El Puerto de ...
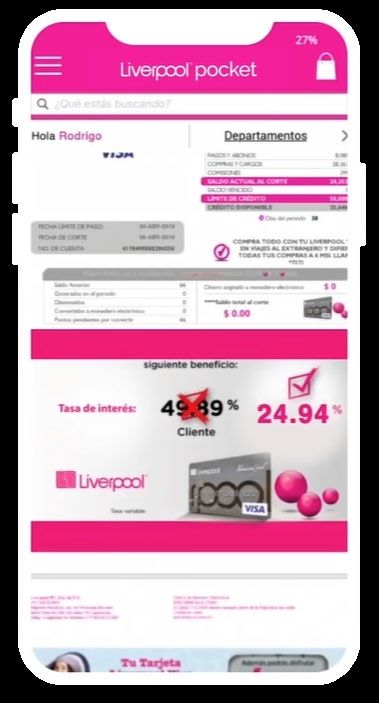
STRATEGIC PRIORITIES

                                   Omni-experience
                      Digital
                  Transformation

                                       Customer Experience

  Profitability                        Suburbia´s
Improvement                            Growth

                                                                 4
September 2019 Strategy & 2Q19 Results - El Puerto de ...
DIGITAL CHANNEL PRIORITIES

            Logistics: Shipments
                                            Marketplace Launch &
              Consolidation &
                                              Liverpool Pocket
               Delivery Time            - Marketplace: 5% of commercial offering
            Improved delivery time   - Liverpool Pocket: 67% increase in downloads
              & New DC for 2021

                                                          Continue Development
      New Payment                                           of Click & Collect
        Methods                                            Half of e-commerce sales

                                          IT Platform
               Extended Catalog         World class web
                                         page (P.W.A.)

As of June 30th 2019                                                                 5
September 2019 Strategy & 2Q19 Results - El Puerto de ...
CUSTOMER EXPERIENCE & BIG DATA PRIORITIES

          Clients, channels,                                  Customer         Holistic customer view
          products payment         Segmentation
                                                              360° View
          methods, etc.

                                                                                         -Descriptive analytics
-Customer identification     Business                                     Advanced       -Predictive models
-Unique customer           Intelligence                                   Analytics      -Prescriptive models
                                                                                         -Cognitive models (AI)

     -Comprehensive knowledge         Customer               Customer      -Personalized communication (CRM)
     of customer behavior            Knowledge                Service      -Increase RFM
     -Experiences design & value
     generation

                                                                                                               6
September 2019 Strategy & 2Q19 Results - El Puerto de ...
Maintain successful     SUBURBIA´S PRIORITIES
                                 business model

                                                      Accelerated expansion
         Omni-experience
                                                        to reach 250 total
             launch
             World class                                  units by 2022
        Suburbia.com platform

 Development of
our own credit card                                          Create CRM
Launched in July 2018                                        capabilities

          Best in class IT                            Talent development
         (SAP S/4 Hana)                                      model
          Implementation
            completed

                                                                                7
September 2019 Strategy & 2Q19 Results - El Puerto de ...
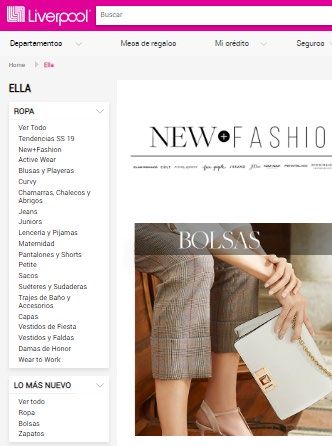
In USA:                                                                                                                     RETAIL EVOLUTION: USA & MEXICO
     Up to 1970s
                              Category Killers
                                                            New Breed of
                                                            Supermarkets
                                                                                       Price Clubs
                                                                                                           Fast Fashion
                                                                                                                                  Discount Stores
                                                                                                                                                            Overexpansion
                                                                                                                                                                                 E-commerce
Department
Stores Growth
Replaced mom and
pop’s with a
convenient and self
service shopping
place.                                               - Offer a wide variety
                         Department stores           of consumer goods.
                         closed some of these
                         departments.                - Some of them follow
                                                     the EDLP (everyday                                - Based on Quick
                                                                                  Offer convenient     Response method.
                                                     low price) policy.                                                       Usually offering surplus
                                                                                  prices on selected                                                     Physical department
                                                                                  items.               - The supply chain     merchandise from           stores declined in
                                                                                                       is the backbone of     mayor retailers or from                           As well as the
                                                                                                                                                         sales and traffic      overexpansion, one
                                                                                                       these business.        their parent brand at      while B&M openings
                                                                                                                              discount prices.                                  of the main reason
                                                                                                                                                         were increasing .      of the B&M fall.

                   In the USA, department
                 stores failed on adapting to
                    new customer needs.
                                                                              In Mexico:

                                                                                                                                                                         Mexico has
                                                                                                                                                                       endured these
                                                                                                                                                                       evolution steps

                                                  Apply for Mexico                      Shopping malls and                  Departmental stores remain
                                                                                     department stores quickly               as a destination point for
                                                                                     adapted to the new trends                      consumers.
                                                 Doesn´t apply for Mexico
                                                                                                                                                                                                     8
September 2019 Strategy & 2Q19 Results - El Puerto de ...
OMNI-EXPERIENCE RIGHT TO WIN

                    Retail Assortment,        Store Network
                    Extended Catalog          -Click & Collect (half of e-commerce sales)
                                              -Extended Catalog (Seller´s App)
                       & Market Place         -Store fulfillment (+80% of orders)
                                              -Customer Service
                                              -Mobile POS (+10K units in store)
                                              -Returns

 Logistics Infrastructure                                  Liverpool Cards
                   121 Stores                              - Payment Solutions
              2 National DCs                               - Online and B&M
         1 Central Warehouse                               - Preferred Payment Method (+65%)
Arco Norte under construction

                 Liverpool Pocket
        Downloads (67% increase YoY)           Highly Recognized
        Most important digital channel          Liverpool Brand

                                                                                            9
September 2019 Strategy & 2Q19 Results - El Puerto de ...
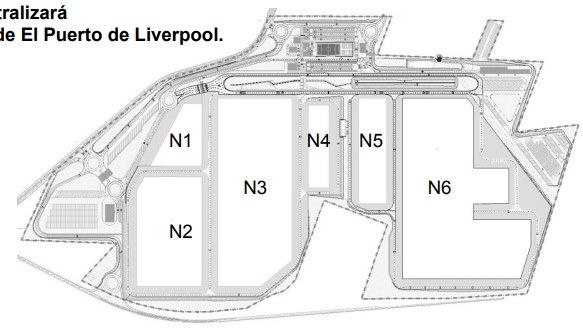
LIVERPOOL DIGITAL ACHIEVEMENTS
As of June 30th 2019:
                                                               LIVERPOOL POCKET
                                                               67% increase in downloads

                                          EXTENDED CATALOG
                                               Items 3.4x vs. YA

                             CLICK & COLLECT
                            Half of e-commerce sales

             DIGITAL SALES
              8.3% of total sales
                                                                                                               CUSTOMER 360° (BIG DATA)
                                                                                                          Technological infrastructure on customer data.
                                                                                                            Algorithms to create focused promotions.
                                                                                                                    Customer personalization.
                                                                                                                   Data on over 6M customers.

                                                                                                    Liverpool.com.mx
                                                                                                 50% increase in website visits.
                                                                                                  Top three in bounce rate &
                                                                                                      visit average time.
                                                                        MARKETPLACE
                                                                     5% of commercial offering

                                                       E-COMMERCE SALES
                                                        30.2% increase 2019 YTD

                                                                                                                                                    10
LIVERPOOL POCKET
                                                                 Our most important digital channel
104% sales growth

                                                        10% of total customers
                                                        Representing 25% of total Liverpool sales

                    Inventory Availability
                    by Store
                                                                               Credit Card Payments
                    Access to Market Place                                     through the App
                    & Extended Catalog
                                                                               Account Balance
                    Click & Collect option
                                                                               Account Monthly Statement
                    Online Support
                                                                                Safe Transactions
                    Follow Up

                    Order Tracking

                    Delivery Promise
                    (94% delivered on or before time)

                                                                                                           11
CUSTOMER EXPERIENCE & BIG DATA
                                                           Hyper-personalization

            SMS/Push
                SMS /                                 Unique Customer Program
                Push                                  In order to get to improve our customer knowledge.
                                   Mail

App                                                   Analytics Models
                                                      Allow us to make a next offer that
                                                      generates value to our customers.

                                                      Communication Platform
                                                      Will allow us to personalize this offers.
                                          Web
      Contact
      Center

                        Seller’s
                          App                   2018 – Unique Customer Program
                           SMS /
                           Push                 2019 – Next Offer & Action Model Design
                                                2020- Personalized Communication Enabled

                                                                                                           12
CURRENT LOGISTICS PLATFORM
                                                                                                    80% of home
                                                                                                      deliveries
                                                                                                     from store

          94% delivered                                                  Department Stores
           on or before
               time

                            Supplier

           14% reduction
             in average
            delivery time                                                     Delivery
                                                                                             Customer
                                                   Distribution Center

             Savings by        121 Stores
             using store                        + 165 M                    +4.6 M                 95% SKU´s
                             1 Central WHS    Products delivered          Annual home
             network to      2 National DCs      by our DCs 1              deliveries 2           Centrally received
               deliver

1   On a 12 month base
2   Packages & Big ticket
                                                                                                                       13
LOGISTICS PLATFORM
CONTINUED GROWTH
ARCO NORTE PROJECT

                                                                        900 mts

                 BEST-IN-CLASS
            TECHNOLOGY & PROCESSES

                                                                                         1800 mts

                      Consolidation of our
                          DCs operations.                                              175 hectares
                                                   $8.5MM MXP                          1.2M sqmt
                     Optimization of our              Estimated CAPEX
                       Omni-experience                  (2019-2021)
                      logistics strategy.

                                                  $16.8MM MXP
                                                    Estimated Total CAPEX         Hard Lines        2021
       LARGEST                                           Master Plan              Soft Lines        2022
  LOGISTICS CENTER
  IN LATIN AMERICA

                                                     Sustainability
                                             Flexibility       Scalability
                                                                                                           14
STORE ECOSYSTEM: EXPANDING EXPERIENCES

    Click & Collect                  Seller´s App                      Kiosks      Experiencia Gift Registry &
                                                                                   Gourmet &     BX beauty
                  Liverpool Pocket                  Extended Catalog
                                                                                Liverpool Viajes
                                                                                                                 15
CAPEX (Ps $ in millions)

                                                                                 Logistics
 Capex                                                        % Revenue

    10K                                                                   20%
                                                                                              Stores &
                                                                                             Shopping
     9K
                                                                                                Mall
     8K
                                     $8,418   $8,592                      15%                Expansion
     7K                     $7,958
     6K
                                                                                 Store
     5K                                                                   10%
                                                                                Openings
     4K   $4,970
                   $4,873
     3K
                                                                          5%
     2K                                                $3,944    $3,403
     1K
      0                                                                   0%                 Maintenance
          2014     2015     2016     2017     2018     2Q18     2Q19

                                                                                     IT
                                                                                Investment

                                                                                                           16
FINANCIAL HIGHLIGHTS
                                                                                                  2018

                      Total Income *                       10.9%
                                                                             NIIF 9
                      Gross Margin *                       39.8%             Recognized in 2018

                      Net Income *                         18.5%             NIIF 16
                                                                             Recognized in 1Q19
                       SG&A *                              10.3%

                                       EBITDA *                     10.3%

                                       EBITDA Margin               14.9% 1

                                       Total Debt                  16.6%

                                       Net Debt / EBITDA           0.73x

*   YoY   (1)   Flat vs. YA                                                                              17
LIVERPOOL AT A GLANCE

                                   REVENUES                                              RETAIL SALES 2
                                   2Q2019 $35,663M                                       2Q19 8.7% increase
                                   YTD    $63,133M                                       YTD  8.1% increase

                                                                                                                CARD HOLDERS
                                                                                                                More than 5.3M
                                   SSS 1                                                 EBITDA
                                   2Q19 6.8% increase                                    2Q2019 $5,212M
                                   YTD 5.6% increase                                     YTD    $7,718M

                                                                                                                CREDIT CARD3
                                                                                                                46% of total retail sales

                                   EBITDA MARGIN                                         CAPEX
                                   2Q19 14.6% increase                                   $3,403M
                                   YTD 12.2% increase                                    YTD
                                                                                                                NPL´s
                                                                                                                5.6%
                                                                                                                2Q2019

                                   OPERATING CF                                          STORE OPENINGS
                                   $820M                                                 2 Liverpool Stores
                                   YTD                                                   3 Suburbia Stores
                                                                                         through 2019

1 Liverpool + Suburbia + Digital                         *Figures in Million MXP
2 Liverpool + Suburbia
3 Liverpool only.
                                                         **All figures without IFRS 16                                                      17
RETAIL SALES
     2Q19                                                             ANTAD Departamental Stores 2Q19
                15%                                                             15%

                10%                                                             10%

                 5%                                                              5%

                        8.7%      7.1%     5.0%                                        4.8%   6.9%
                 0%                                                              0%

                       Retail   SSS      SSS                                           SSS Department
                       Sales Liverpool Suburbia                                              Stores
                                                                                               SSS
     2019 YTD                                                         ANTAD Departamental Stores 2019 YTD
                15%                                                             15%

                10%                                                             10%

                 5%                                                              5%

                        8.1%      6.1%     2.5%     5.1%                               3.6%    5.3%
                 0%                                          1.0%
                                                                                 0%

                       Retail      SSS      SSS   Average Traffic                      SSS Department
                       Sales    Liverpool Suburbia Ticket Liverpool                          Stores
Liverpool & Suburbia                              Liverpool                                    SSS
                                                                                                                       19
SAME STORES SALES GROWTH
        Annual Growth:                          2017              2018              2019
                  Liverpool                     5.8%              6.5%                  6.1%

                   Suburbia                     4.6% (1)          10.6%                 2.5%                                         Consistent
                                                                                                                                    growth above
                     TOTAL                                        7.1%                  5.6%                                           ANTAD

        Quarter Growth:
       20%
                                                                                                                                                                 Liverpool

      15%                                                                                                                                                        Suburbia

                                                                                                                                                                 ANTAD

      10%
                                                                                17.1%

                                                                                                11.4%          11.5%
        5%
                                                       6.8%                              7.4%                                                      7.1%
                             6.1%                                                                       6.3%           6.4% 6.6%
                                    4.7%                                 5.9%                                                      4.9%                   5.0%
               4.1%                        5.1% 3.2%          7.3%
        0%
                                                                                                                                          (0.5%)

       -5%
                  1Q17        2Q17          3Q17           4Q17           1Q18             2Q18          3Q18           4Q19         1Q19           2Q19

(1) Starting in April ´17
                                                                                                                                                                             20
CREDIT CARD DIVISION
NPLs                                                                                 Change vs. YA
                                                                                                                                     2Q2019

6%                                                                                                   20%
5%
                                                                                                     15%
4%

3%                                                      5.7%      5.8%                       5.6%    10%
                   5.0%      5.6%            5.1%                                   5.2%
          4.5%                      4.5%                                 4.5%                                                  Preferred
2%
                                                                                                                            payment method
                                                                                                      5%
1%                                                                                                                            online and in
                                                                                                                                  B&M
0%                                                                                                    0%

                                                                                                     -2.5%
         1Q17     2Q17       3Q17   4Q17     1Q18      2Q18      3Q18    4Q19      1Q19     2Q19

                                                                                                                              NPL´s within
                                             2nd Quarter                                      YTD                           company targets
            Millions                2019        2018           Dif. %            2019        2018          Dif. %
     Initial balance of reserve      4,014          3,086       30.1%           3,982       3,086            29.1%

         (+) New Reserves            1,431          1,280       11.8%           2,236       2,029            10.2%

           (-) Write off             (809)          (726)       11.4%           (1,583)    (1,475)           7.3%

     Ending balance of reserve      4,636       3,640           27.3%           4,636       3,640            27.3%
                                                                                                                                              21
DEBT STRUCTURE & MATURITY PROFILE
  Million Pesos (as of June 30th 2019)
  Total Debt: Mx$28,394.1 (not including IFRS16)                                       By Instrument:                                            By interest type:
  (Includes derivative instruments acquired for hedging                                                            34.9%
  purposes)                                                                                                                 Local Bonds                                                Fixed
  Average interest rate: 7.97%
  Average life: 6.5 years                                                                                                   144A Reg S
                                                        14,546 (2)                                 65.1%                                                                      100.0%

                                                                                                                           By currency:           34.9%
                                        3,948 (1)                                                                                                      Pesos

             3,000          3,400                                    3,500                                                                              Synthetic Pesos (3)
                                                                                                                                  65.1%
      2019   2020    2021   2022    2023    2024    2025    2026     2027

                        Local Bonds        144A Reg S

                                                                                           Leverage
                            2.0

                            1.5                                                                                                                                Debt/EBITDA
                                                                                                                                                               Net Debt/EBITDA
                            1.0                                                                      1.8x
                                                                                    1.6x                                           1.6x
                                                                                                                    1.4x                         1.4x
                                    1.2x 1.1x                                                                                             1.1x
                            0.5                     1.0x             0.9x                                   0.9x
                                                                                                                           0.7x                         0.8x
                                                           0.6x              0.4x          0.06x
                             0
                                     2013           2014               2015           2016            2017            2018           2Q18         2Q19

(1)   LIVEPOL24 144A Reg S US$300 million, fixed exchange rate 13.15 MxPs/USD
(2)   LIVEPOL26 144A Reg S US$750 million, fixed exchange rate 19.39 MxPs/USD                                                                                                                  22
(3)   Fully hedged in Pesos: principal + interest
Appendix

•   Financial statements
•   Main financial indicators
•   Growth history

                                       23
INCOME STATEMENT
           2Q2019

                24
INCOME STATEMENT
         2019 YTD

                25
BALANCE SHEET
      2Q2019

            26
CASH FLOW

        27
FINANCIAL PERFORMANCE TRENDS

Revenues                                                                                                             EBITDA and EBITDA margin
                                                          $135,535
(Ps $ in millions)
                                             $122,168                                                                (Ps $ in millions)
                                                                                                                                                                         $20,237
                                                                                                         21,000
                                  $100,442                                                                                                                     $18,350                                 36.0%
                        $91,293                                                                                                                      $16,051
              $81,214                                                                                                                      $14,870                                                     31.0%
 $74,504                                                                                                 16,000
                                                                                    $63,133                         $12,536    $13,024
                         10%                                              $57,896                                                                                                                      26.0%
                                                                                                         11,000                                                                                        21.0%
                                                                           8%                                       16.9%      16.1%        16.3%    16.0%                           $7,224   $7,718
   7%                               8%                      7%                                                                                                 15.0%     14.9%
                6%                             6%                                     6%                                                                                                               16.0%
                                                                                                          6,000
                                                                                                                                                                                    12.5%              11.0%
                                                                                                                                                                                              12.2%
   2013        2014      2015      2016       2017          2018      2018 Σ2Q      2019 Σ2Q              1,000                                                                                        6.0%
                                   Same store sales growth                                                           2013       2014         2015     2016      2017      2018     2018 Σ2Q 2019 Σ2Q

                                                     Operating Cash flow                                                                 Cash flow
                                                     (Ps $ in millions)                                              $12,453                          40.0%
                                                                                               $11,691    $11,650                        %Revenue
                                                12,000                                                                                                35.0%

                                                10,000                                                                                                30.0%
                                                                                    $8,652
                                                                                                                                                      25.0%
                                                 8,000
                                                             $6,506                                                             4.8%                  20.0%
                                                                                                                                             4.1%
                                                 6,000                                         11.6%                                                  15.0%
                                                              8.7%         $4,821    9.5%                  9.5%       9.2%
                                                                                                                                $2,802      $2,582    10.0%
                                                 4,000
                                                                            5.9%                                                                      5.0%
                                                 2,000                                                                                                0.0%
                                                              2013          2014     2015       2016        2017      2018     2018 Σ2Q 2019 Σ2Q

                                              Liverpool has been a consistent performer, delivering solid results throughout the years                                                                         28
COMPELLING STORY OF DISCIPLINED
                                                                                                                                                                  GROWTH FOR THE LAST 170 YEARS
  140
               Historically, Liverpool has reinvested its profits to expand its operations (Number of Stores)(1)                                                                                                            136               137   8
                                                                                                                                                                                                                131               131
                                                                                                                                                                                                                                        128
               1847 – J.B. Ebrard arrives to Mexico             1982 – Inaugurates its first stores         1998 – Acquisition of Salinas y               2017 – Liverpool buys 100% of
                        City from France                             outside of Mexico City               Rocha, allowing Liverpool to increase          Suburbia with its 122 stores (April)                         123
                                                                                                               its portfolio by 11 stores                                                                                                           7
  120                                                                                                                                                                                                   114
                                                                                                                                                                                                112
                                                                                                              2013 – Reaches 100 department                                  104       106
                1934 – First Liverpool department               1988 – Acquisition of Fábricas de
                 store inaugurated in Mexico City              Francia, incorporating 5 more stores                      stores                                    99                                                                               6
  100
                                                                                                                                                         90
                                                                                                                                                  85                                                                                                5
                1962 – Second Liverpool opens in               1997 – Acquisition of Las Galas, a
   80               Insurgentes, Mexico City                  department store chain with 7 outlets
                                                                                                                                      70
                                                                                                                                                                                                                                                    4
                                                                                                                            61
               1965 – Launches IPO in the Mexican
   60                     Stock Market
                                                                                                                   56
                                                                                                         51
                                                                                                                                                                                                                                                    3
                                                                                                43
   40           1980 – Liverpool begins to operate                                      36
                the Perisur mall, being its first real                                            1.7x              1.8x                                                                                                                            2
                         estate operation                                   26          1.4x                                           1.4x
                                                                                                         1.0x                                                                 1.1x
   20                                                            15                                                          0.9x                                   0.9x                                         0.9x                    0.8x
                                                                                                                                                         0.6x                            0.6x                                0.7x                   1
                                                         8                                                                                        0.5x                                           0.4x
                                 2          4                                                                                                                                                           0.06x
          0           1
    0                                                                                                                                                                                                                                               0

                                                                            Liverpool Stores                   Suburbia Stores                    Net Debt/EBITDA

                Profitable growth and significant value creation through the development of a dense network of stores across Mexico and selected acquisitions.

Source: Company website and annual reports.
(1)     Includes Liverpool and Fábricas de Francia formats. Does not include Suburbia                                                                                                                                                                   29
Stock Information
    Bolsa Mexicana de
  Valores (BMV): LIVEPOL

      Contact Information
 emgrinang@liverpool.com.mx
IR: www.elpuertodeliverpool.mx
     www.liverpool.com.mx
NOTES

    31
NOTES

    32
You can also read