Severe Weather in a Changing Climate - IAG
←
→
Page content transcription
If your browser does not render page correctly, please read the page content below
1 November 2019

 Severe Weather in a
 Changing Climate
 Cindy Bruyère, Greg Holland, Andreas Prein, James Done
 Capacity Center for Climate and Weather Extremes,
 National Center for Atmospheric Research, USA

 Bruce Buckley, Peter Chan, Mark Leplastrier, Andrew Dyer
 IAG

 November 2019
FOREWORD

Climate change is already well underway and is considered by many to be the greatest risk currently
facing humanity. Every year we are confronted globally with extreme weather events, that become
natural disasters. Our communities in Australia are exposed to just about every hazard this world can
throw at them, from earthquakes to storms and cyclones, to bushfires and devastating floods.
We cannot prevent these events happening, but we know more can be done to better prepare
communities and make them more resilient and stronger.
Protecting communities requires greater investment in resilience and mitigation planning – be it from
governments, businesses, community organisations or individuals – which will reduce the physical,
economic and social recovery costs that follow a disaster.
This report reviews and interprets the latest climate science to understand how climate change is
impacting the severity and frequency of weather events like tropical cyclones, hailstorms and rainfall,
and what is likely to happen in the future. The report also examines the changing physical risks from
severe weather patterns, considering past, present and future climates.
Climate change will require broadscale collaboration and co-ordination across all sectors of the
community. Climate change is too big for one organisation to solve and it is our hope this report will
provide a foundation to drive more conversation, so the necessary change can happen.

SEVERE WEATHER IN A CHANGING CLIMATE                                                                      1
CONTENTS

 1. Executive Summary....................................................................................................................... 3

 2. Introduction ................................................................................................................................... 7

 3. State of the Climate ....................................................................................................................... 8

  3.1 Natural Climate Variability and Forced Climate Change .............................................................. 8

  3.2 State of Climate Assessment ...................................................................................................... 8

  3.3 Extreme Events Under Climate Change.................................................................................... 11

 4. Changes to Extremes for Different Warming Scenarios ............................................................... 13

  4.1 Tropical Cyclones ..................................................................................................................... 13

  4.2 Extreme Precipitation and Flooding .......................................................................................... 24

  4.3 Damaging Hail .......................................................................................................................... 31

  4.4 East Coast Lows ....................................................................................................................... 36

  4.5 Bushfire .................................................................................................................................... 43

  4.6 Sea Level Rise.......................................................................................................................... 47

 5. Conclusions................................................................................................................................. 51

 Bibliography .................................................................................................................................... 53

 Acknowledgements ......................................................................................................................... 64

 Contacts .......................................................................................................................................... 64

SEVERE WEATHER IN A CHANGING CLIMATE                                                                                                                 2

1. EXECUTIVE SUMMARY

This NCAR and IAG report examines current and future climate change impacts on the Australian
climate and weather extremes that produce significant property, personal and economic damage and
hardship.
The level of scientific knowledge and available tools has now reached the stage where it is possible to
make confident assessments on the impacts of climate change at larger scales and longer time
frames, with objective assessment of the associated levels of confidence.
But many personal, government and business decisions require information on climate and weather
extremes at more local scales, such as states, cities and towns.
This assessment therefore incorporates a review of the extensive related literature, detailed in Table
1, together with expert judgement on potential local impacts. The expert assessments on local
impacts are indicative rather than absolute, and are intended to provide a basis for current planning
and for further discussion and assessment, leading to more refined and accurate future assessments.

Key assessments are:
    1. The frequency of named tropical cyclones in the Australian region has declined in recent
       decades; the detail of how this will project into the future is unknown, although globally there is
       expected to be a further slight reduction in total numbers. However, the frequency of tropical
       cyclones making landfall throughout the western South Pacific region has increased. Over the
       past 30 years, the proportion of the most destructive tropical cyclones has increased at the
       expense of weaker systems, and this change is expected to continue.

         There has already been a southward shift of the regions where tropical cyclones reach peak
         intensity and this is expected to continue. Tropical cyclone risks are therefore expected to
         increase most rapidly in the south-east Queensland / north-east NSW regions, followed by the
         coastal districts south of Shark Bay in Western Australia.

         Marginal decreases in risk for wind impacts may occur in some other regions. Planning for
         inland penetration of tropical cyclones should be based on substantial increases in both
         rainfall rate and affected areas. Winds are also likely to decay more slowly, so increased wind-
         driven rainfall ingress should be expected both at the coast and inland. More intense storms
         combined with rising sea levels point to increasing storm surge impacts, and these may be
         very substantial in some regions.

    2. Intense short duration rainfall is expected to increase almost everywhere in Australia, resulting
       in more frequent flooding in urban areas and in small river catchments. Storm rainfall totals
       from both east coast lows and tropical systems are also expected to increase, leading to
       increasing flood risk in the larger river catchments. More work is required to fully understand
       and confidently assess these changes.

    3. Areas at risk of large (2.0-4.9cm in diameter) and giant (>5.0cm in diameter) hail should
       progressively shift southwards, with the largest increase in risk likely to be in the region inland
       from the Hunter River south through the central and southern New South Wales highlands and
       central to eastern Victoria. Fewer increases are assessed to affect the south-west of Western
       Australia while severe hail risk is expected to decrease in Queensland.

SEVERE WEATHER IN A CHANGING CLIMATE                                                                     3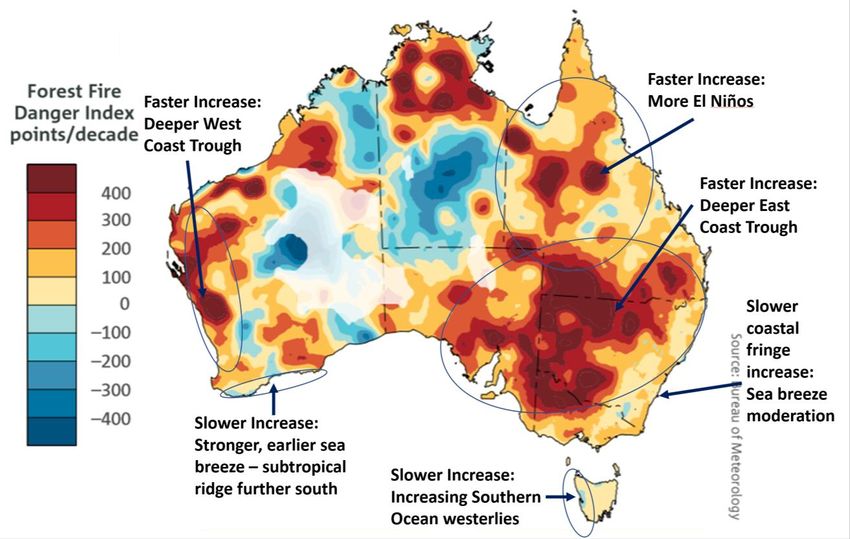
1. EXECUTIVE SUMMARY

    4. The multi-day impacts of east coast lows on the south-eastern seaboard of Australia are
       expected to increase because of wind-driven rainfall ingress, flash and riverine flooding. This
       effect will be compounded by rising impacts from storm surge, waves, and coastal erosion.
       Summer and autumn east coast low activity is expected to increase, while there will be a
       decrease in winter-spring systems. There is limited understanding of the rare extreme east
       coast lows that drive the majority of the impacts over land.

    5. Bushfire risk, as measured by the trends in fire danger indices, is likely to increase in almost
       all locations nationally, leading to more frequent and extreme events, and longer fire seasons.
       The rate of increase varies by location and will depend on weather system changes and site-
       specific factors at regional scales.

    6. Sea level rise is expected to accelerate around the Australian coastline but at differing rates. It
       is notable that past assessments of sea level rise are lower than those that recent
       observations show. Sea level rise will contribute substantially to escalating impacts from storm
       surge and the impacts on coastal natural systems, buildings and infrastructure. The
       greenhouse gases that are already present will cause sea level rises to continue well into the
       next century even if there are significant emission reductions globally through the coming
       decade.

SEVERE WEATHER IN A CHANGING CLIMATE                                                                      4
Table 1 Summary of the past and future impacts of climate change on metrics of key extreme events in Australia under three future temperature scenarios (changes from
pre-industrial period 1850-1900). Present climate represents the recent two decades. This is an expert assessment and includes an estimate of the confidence in the
changes from the benchmark values.
                                                                                                                                Climate Change Impact (confidence level)
                                  Metric              Benchmark
                                                                                                       Present Climate                 +1.5oC                       +2oC                          >+2oC

                                                                                                                                                                                          5-10% higher for each

                                                       1973-2007
                                                        between
                                                                                                        ~5% increase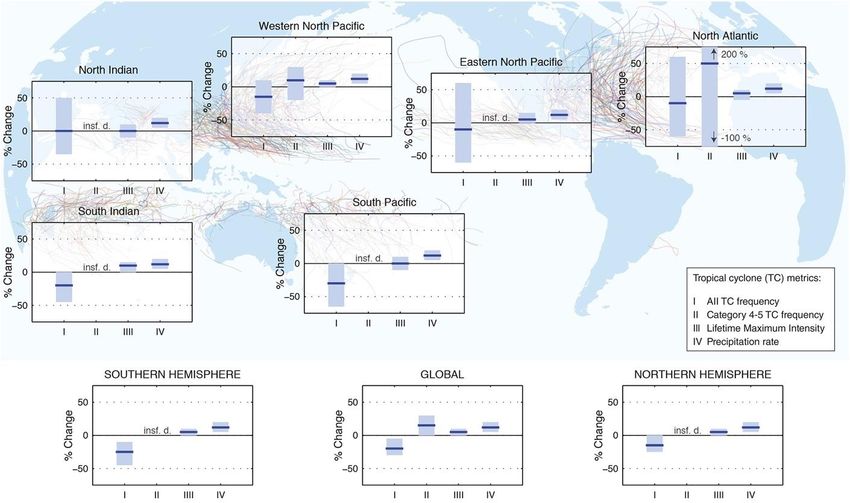
Climate Change Impact (confidence level)
Metric Benchmark
Present Climate +1.5oC +2oC >+2oC
1986-2005 1986-2005 Since 1860 Since 1880
~24cm - close to global
Level
~30cm* ~50cm* More than 1m
Rise
Sea
average
Sea level rise (Med-High) (Med-High) (Medium)
(High)
Increasing frequency of
Coast
Increased but includes a
Lows
East
intense east coast low
Frequency large natural variability No info No info
impacts
component (Medium)
(Low)
Regionally variable Potentially 40% increase
Annual maximum Regionally variable Regionally variable ~10%
13-15% for +4°C
1-day rainfall intensity generally slightly upward (Med-High)
Extreme Rainfall
(Med-High) (Medium)
Variable, generally slightly Variable, generally slightly Between 15-20% dependent Between 10-60% dependent
20-year return level of 1- upward upward on the region on the region
day rainfall
(Med-High) (Med-High) (Med-High) (Medium)
30-80% increase
Footprint of extreme
2001-
2013
No info No info No info (USA example)
convective rain system
(Med-Low)
Potential increase in
Increasing trend in south-
1979-2015
Large
southern regions, decreases
Hail
Frequency of hail >=2.5 east Australia No info No info elsewhere
cm diameter
(Med-Low)
(Low)
Increases >30% in southern
and eastern Australia (High)
15-65% increase in number Further increases or no
Bushfire
Increasing in all Australian
1973-2010
of extreme fire danger days changes in other regions
McArthur Forest Fire regions especially in the Further increases typically
(FFDI>50) for +1°C (Medium)
Danger Index south-east 50) for
+3°C (Medium)
* Estimates reflecting Intergovernmental Panel on Climate Change Fifth Assessment Report findings which could quite possibly be low end estimates and therefore underestimate the impact.
SEVERE WEATHER IN A CHANGING CLIMATE 6
2. INTRODUCTION

Climate change is happening so it is critical that we achieve a common understanding of the
increasing risk of the impacts of severe weather on the expanding built environment.
Global changes must be interpreted at a regional and local level to allow for informed discussion on
the scale of the impact so mitigation strategies can be better focused.
This report summarises the current state of knowledge on climate change impacts, severe weather
and climate extremes that are relevant to Australian property risk. It is based on current knowledge
documented in peer-reviewed literature highlighting the significant advances that have been made
since the Fifth Assessment Report (AR5) of the United Nations Intergovernmental Panel on Climate
Change (IPCC 2013).
This report includes evidence from:
•   observed changes to the historical climate (typically from pre-industrial or the mid-19th-century
    levels),

•   modelling experiments of past and future climate change, and

•   theoretical assessments based on fundamental understanding of the physics associated with the
    phenomenon.

Changes that are broadly in line with the 1.5°C and 2°C warming targets from the Paris Agreement
are explicitly addressed where possible. Potential changes for scenarios that exceed these goals
(>+2°C) are also discussed.

Section 3 of this report (State of the Climate) provides a brief introduction to the state of the climate
system and includes general definitions and concepts that are important for understanding the report.
Section 4 (Changes to extremes for different temperatures) contains the main results about changes
in property-risk-relevant extreme events in Australia. Because changes to specific weather extremes
(eg tropical cyclones (TCs)) are likely to be distributed unevenly across Australia, regional
interpretations are included to help improve understanding of potential community impacts.
As the regional interpretation is an input for specific scenarios for insurance loss modelling, the >+2°C
climate change scenario is nominally chosen to represent +3°C.
Expert judgement has been used in cases where there are conflicting research findings or a lack of
data for Australia, particularly in the regional level interpretation.

SEVERE WEATHER IN A CHANGING CLIMATE                                                                        7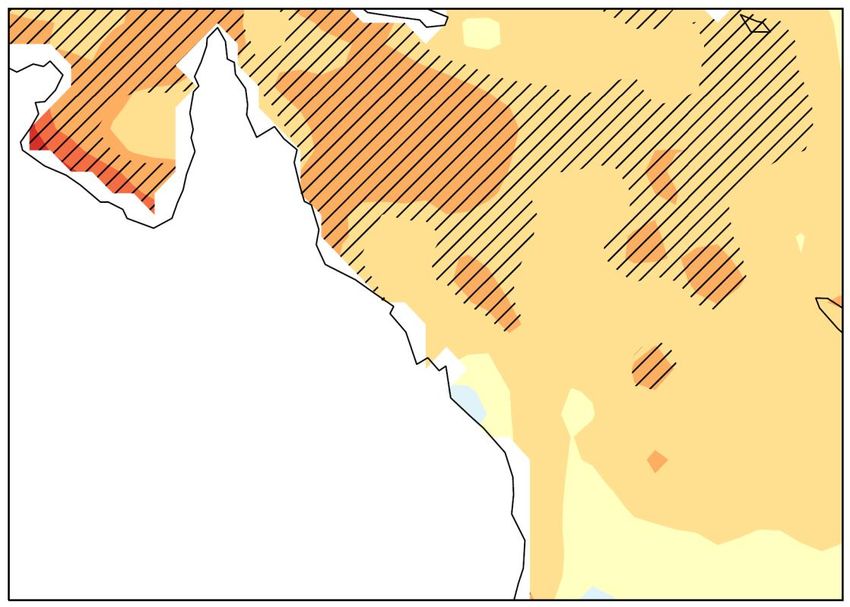
3. STATE OF THE CLIMATE

3.1 Natural Climate Variability and Forced Climate Change
Natural climate variability is an intrinsic characteristic of the climate system and is related to internal
and external natural processes across the full range of spatial and temporal time scales.
The internal processes are caused by heat exchanges between the ocean and the atmosphere (eg,
El Niño Southern Oscillation, Interdecadal Pacific Oscillation) or by chaotic behaviours that are
inherent in the climate system.
Natural external processes that cause variabilities include changes in the earth’s orbit around the sun,
changes in solar activity, or volcanic activity.
Anthropogenic forced climate change is caused by human effects on the climate system, including
greenhouse gas emissions, emissions of aerosols and land use changes. These changes would not
have occurred without human activities and are superimposed on top of natural climate variability.
The warming that has been recorded since the 1950s cannot be explained by considering natural
processes alone and human activities are extremely likely1 to have been the dominant cause of the
warming observed since the mid-20th century (IPCC 2013).

3.2 State of Climate Assessment

Fig. 1 Global observed mean temperature increase relative to pre-industrial conditions (modified from NASA 2017).
The two extremely strong El Niño years of 1998 and 2016 are highlighted (left). Decadal minimum and maximum
anomalies relative to pre-industrial conditions (bars), and the decadal median anomalies (line) (modified from EEA
2018) are shown (right).

Since the pre-industrial period (1850-1900), the average global mean temperature (averaged per
decade ending in 2017) has risen by 0.94°C (Fig. 1, right) due to increasing greenhouse gas
emissions and deforestation (NOAA 2017). The largest part of the warming has occurred since 1970.

1   IPCC definition indicating a 95-100% probability

SEVERE WEATHER IN A CHANGING CLIMATE                                                                          8
3. STATE OF THE CLIMATE

The effect of climate internal variability (see Section 3.1) is also evident in Fig. 1, especially in years
with strong El Niño events (eg 1998 and 2016: Fig. 1, left) which are associated with above average
warm temperatures. Global warming peaked in 2016 with temperatures ~1.3°C warmer than the
average temperatures in the pre-industrial area. The last four years (2015-2018) have been the
warmest on record, and 2019 is on track to make this five (NOAA 2019). Australian temperature has
increased by just over 1.0°C since 1910, at a similar rate as the global average (Bureau of
Meteorology and CSIRO 2018).
Mean temperatures in almost all land areas, including Australia, are expected to increase at slightly
higher rates than the global average (IPCC 2013, Seneviratne et al. 2016) whereas high-latitude
regions will experience much higher temperature increases.

             In the Paris Agreement of December 2015, the international community agreed on:
                 “Holding the increase in the global average temperature to well below 2 ℃ above
                pre-industrial levels and to pursue efforts to limit the temperature increase to 1.5 ℃
                above pre-industrial levels, recognising that this would significantly reduce the risks
                                           and impacts of climate change.”

No agreement has been reached as to when global warming might reach the 1.5/2°C (above pre-
industrial levels) Paris targets, although there is consensus that it is extremely unlikely2 to remain
below the targets. Global mean temperatures may reach or exceed 1.3 oC in 2019 (NOAA 2019).
Raftery et al. (2017) stated that there is a 90% likelihood that temperatures will rise between 2°C and
4.9°C by 2100. They estimated that there is a 5% chance that global temperatures will remain below
2°C, and only a 1% chance to remain below 1.5°C. King and Henley (2018) estimated that under
current emissions, global warming will reach 1.5°C around 2024 and 2°C around 2036. In a special
report3, IPCC said there is a very high risk that global temperature will exceed the lowest threshold
agreed in the Paris Agreement climate targets, and that overshooting may happen by the 2040s
(IPCC 2018).
Limiting global temperature to the Paris Agreement target of 1.5°C (above pre-industrial levels) can
only be achieved under ideal conditions with:
•      rapid and large-scale global political commitments to decarbonisation,
•      strongly accelerated growth in low carbon technology, and
•      the development of efficient and large-scale carbon capturing technology by mid-century
       (Sanderson et al. 2017).

Fig. 2 shows the rapid decrease in carbon emissions that must occur in the near future to limit global
warming to 1.5°C or 2°C. There is little evidence that major emitters are willing to adopt measures
that will achieve this level of decrease.

2   IPCC definition indicating a of 0-5% probability

3   In a note released in January 2018, the IPCC restates that draft texts of the report can change substantially and do not necessarily represent the IPCC’s final
     assessment of the state of knowledge.

SEVERE WEATHER IN A CHANGING CLIMATE                                                                                                                                  9
3. STATE OF THE CLIMATE
Fig. 2 Total carbon emissions trajectory
(fossil fuel, cement, and land use) for
scenarios leading to 1.5°C warming
(green), 2°C warming (purple), and the
representative concentration pathways
(RCP2.6) and RCP8.5 scenarios (grey
and pink lines). The black line shows
observations from 1850 to 2005. The
orange line indicates that temperature
overshoots 1.5°C but then drops back by
the end of the century (source
Sanderson et al. 2017).
A 2°C target is therefore unlikely to be achieved, and will therefore significantly increase the risk for
catastrophic events, even compared to 1.5°C warming. For example, King et al. (2017) investigated
the difference between a 1.5°C and 2°C global warming on Australian extremes. They showed that
events such as the record warm summer of 2012-2013 and associated bleaching of the Great Barrier
Reef in 2016 would be 87% more likely in a 2°C world compared to 60% for 1.5 oC (Fig. 3). Impacts on
precipitation extremes were less clear in their study.
Fig. 3 Changes in the likelihood of Australian extreme events in the current,
1.5°C and 2°C warmer world compared to a natural (pre-industrial) world
(modified from King et al. 2017).
SEVERE WEATHER IN A CHANGING CLIMATE 103. STATE OF THE CLIMATE Warming higher than 2°C rapidly increases the risk for global-scale disruptive events and for unforeseeable threshold changes in the climate system. These so-called tipping-point events are associated with positive feedbacks that cause accelerated and perhaps irreversible changes, regardless of human activities. One example is the collapse of the Greenland Ice Sheet. In recent years, this ice sheet has experienced rapid increases in summer melt, reaching all-time records in June 2019. If the melting continues to a full melt of the ice sheet, the resulting global average sea level rise would be ~7.4m. Paleoclimatic records show that Greenland was deglaciated for extended periods during the Pleistocene epoch (2.6 million years ago to 11,700 years ago; Schaefer et al. 2016) but our understanding of important processes that contribute to the melting do not (so far) allow an estimate of threshold temperatures that would result in a collapse of the ice sheet (van den Broeke et al. 2017). 3.3 Extreme Events Under Climate Change The frequency and intensity of weather and climate extremes will change at a much higher amplitude than more common events. This is because small changes in the mean climate lead to dramatic changes in the extremes. An example of this is shown in Fig. 4 for Northern Hemisphere maximum summer temperature anomalies within a baseline period (1951-1980) and a recent climate period (2004-2014). SEVERE WEATHER IN A CHANGING CLIMATE 11
3. STATE OF THE CLIMATE

       Fig. 4 Climate change has shifted the odds of extreme heat as shown for the Northern Hemisphere
       maximum summer temperature anomalies to climate normal average (1951-1980) (modified from
       WXshift: http://wxshift.com/climate-change/climate-indicators/extreme-heat (March 2018)).

Extreme heat events, defined as a
temperature anomaly of three standard
deviations above the mean, occurred
0.4% of the time in the baseline period
(which already included a global warming
component). In the recent period, the
occurrence increased by a factor of 20 to
8.1%. Many climate extremes undergo
similar changes (see Section 4 of this
report).
Not all climate extremes are equally well-
recorded through historical observations
and not all are well-simulated in state-of-
the-art climate models. Fig. 5 shows an
expert assessment of our current
knowledge of climate change impacts on
climate extremes (Vose et al. 2014).
A general rule is that the larger the extent
or time period of the extreme, the better it
is recorded. For example, especially
small-scale and short-period extremes
related to severe convection are not well-
observed. Similarly, our understanding of
the effects of climate change on small-                   Fig. 5 Expert assessment of the state of knowledge
scale extremes is often more limited than                 regarding changes in various climate extremes.
for larger-scale extremes, although there                 The horizontal axis shows how skilful historical
                                                          changes can be detected while the vertical axis
are exceptions, such as extreme TCs and
                                                          refers to our understanding of the physical
associated extreme winds and waves.                       processes that drive changes (source Vose et al.
                                                          2014).

SEVERE WEATHER IN A CHANGING CLIMATE                                                                       12
4. CHANGES TO EXTREMES FOR DIFFERENT WARMING SCENARIOS 4.1 Tropical Cyclones Background The world has entered a new era of global TCs in which economic and insured losses are doubling every 15 years (Kunreuther and Michel-Kerjan 2009, Smith and Katz 2013, Pielke Jr et al. 2008). Changes to exposure and vulnerability dominate the trend (Weinkle et al. 2012, Höppe and Pielke 2006, Stewart et al. 2003) but changes to the TCs themselves (Walsh et al. 2016a), together with sea level rise (Solomon et al. 2007) have compounding the effects. Indeed, Estrada et al. (2015) quantified the present climate change contribution to rising USA hurricane costs at US$136 million per year. This section summarises our understanding of historical and future TC changes and explores scaling for global temperature with a focus on Australia. Given that climate influences all stages of the TC life cycle, the entire TC life cycle is expected to be affected by climate change. Starting with TC formation, there is no theory linking TC formation to the mean state of the climate (Sharmila and Walsh 2017). A large empirical modelling effort has led to numerous genesis potential indices but these have substantial issues. For example, Bruyère et al. (2012) highlighted the extreme sensitivity of these indices to the region selected. Such indices also rarely account for non-stationarity in the TC-climate relationships, such as the increasing threshold onset temperature for formation with warming (Johnson and Xie 2010), thereby limiting their application to climate change studies. The theoretical basis for TC intensity is far more established. TC potential intensity is directly related to the sea surface temperature (SST; Emanuel 1991, Holland 1997) with a climate sensitivity of TC maximum wind speed of 5% per degree Celsius rise, shown in observational and modelling studies (Strazzo et al. 2015). Circulation acts as a modifier to these thermodynamic effects, operating through wind shear and vertical oceanic overturning. In addition to these advances in theoretical understanding and empirical modelling, numerical models apply physics to our understanding of TCs and climate. Global climate models commonly perform well in capturing the geographic distribution of TCs, their frequencies, and inter-basin differences (eg, Strachan et al. 2013), but there are notable variations between models (Shaevitz et al. 2014, Camargo 2013). Recent global models use 10-25km grid spacing, at which many key damaging TC parameters start to become resolved (eg Shaevitz et al. 2014, Bacmeister et al. 2016), including TC clustering and TC rainfall (Villarini et al. 2014). Yet Gentry and Lackmann (2010) found a grid size of the order of 1km is needed to capture the peak wind speeds of the most intense TCs. Looking to the future, it appears the dominant effect of increasing greenhouse gases on TCs will be through the increasing upper ocean temperatures (Zhao et al. 2013). The long-term impact of future predicted increases in ocean temperatures is hotly debated (eg Holland and Webster 2007). However, some consensus is emerging, summarised for the global basins by Christensen et al. (2013) and Knutson et al. (2019b), reproduced in Fig. 6. This consensus suggests that there will be higher TC intensities and TC rain rates but fewer TCs globally. Separating the climate influence on TCs into thermodynamic and dynamic contributions offers a useful framework for understanding future changes. Global climate model projections agree on a future climate that is warmer and more humid, but disagree on changes to environmental winds (Deser et al. 2012). This disagreement worsens for changes on regional scales. SEVERE WEATHER IN A CHANGING CLIMATE 13
4. CHANGES TO EXTREMES FOR DIFFERENT
WARMING SCENARIOS

Confidence in thermodynamically-driven changes to TCs, such as potential intensity and rainfall, is
therefore far higher than for circulation-driven changes such as wind shear and steering flow.
There is consensus on a thermodynamically-driven future increase in global and regional maximum
wind speeds and on the global incidence of high-intensity TCs (Villarini and Vecchi 2013, Murakami et
al. 2012, Hill and Lackmann 2011). In addition, Holland and Bruyère (2014) found a relationship
between anthropogenic warming and an increasing proportion of the strongest TCs, and a decreasing
proportion of weaker TCs. Lee et al. (2016) provided evidence that changes in the incidence of rapid
intensification could be driving these proportional shifts. Indeed, Emanuel (2017) suggested a future
increase in the incidence of rapidly intensifying TCs just offshore that would present a challenge for
future forecast and emergency preparation.

  Fig. 6 Consensus future projection of tropical storm characteristics under a 2°C global warming scenario
  (Knutson et al. 2019b).

In addition to these changes to frequency and intensity, other important changes to TC activity are
anticipated. There is consensus on a 5-20% thermodynamically-driven increase in TC rain rate within
100km of cyclone centre by the end of this century (Christensen et al. 2013, Walsh et al. 2016a,
Villarini et al. 2014, Knutson et al. 2019b). As moisture content increases with warming, so does
moisture convergence for a given mass convergence into the cyclone. The expected increase in wind
speeds may lead to further increases in moisture convergence beyond Clausius-Clapeyron scaling
(Knutson et al. 2010).
SEVERE WEATHER IN A CHANGING CLIMATE                                                                         14
4. CHANGES TO EXTREMES FOR DIFFERENT
WARMING SCENARIOS

Lifetime maximum wind speeds are now occurring at higher latitudes than in the past (Kossin et al.
2014), associated with a global expansion of the tropics. Should this continue, these high-latitude
locations will experience TC impacts. Rising seas will bring more frequent storm surge events, all
other factors being equal. Finally, there is a lack of climate theory for TC size but high-resolution
simulations by Sun et al. (2017) indicate a future expansion of the area subject to gale force winds.

Changes in Australia
Observed changes
Focusing on historical change in Australia and an analysis of historical TC records, Callaghan and
Power (2011) found a decrease in eastern Australian landfall frequency over recent decades but did
not reference the distribution of intensities. However, a more recent analysis found that the
significance of the trend is sensitive to the specific period analysed (Hartmann et al. 2013). Our
confidence in historical change is therefore limited by the lack of a long and consistent observational
record. Kuleshov et al. (2010) found no trend in the numbers of minor or moderate TCs in the
Australian region since 1981, but a significant increase in the numbers of strong (central pressure
below 945hPa) TCs. Malan et al. (2013) also found an historical increase in strong TC activity as
measured by the number of major (> Saffir-Simpson Category 3) storm days. Holland and Bruyère
(2014) found that globally anthropogenic warming has increased the proportion of the strongest TCs
and decreased the proportion of minor TCs. These changes are significant at the 99% level for both
the South Pacific and South Indian Ocean basins.
It is possible that TCs are living longer, with an associated increased likelihood of reaching their
maximum potential intensities. Kossin et al. (2014) found that the increasing latitude of lifetime
maximum intensity (LMI) over the past 30 years applies to both the South Indian and South Pacific
basins, primarily associated with a southward shift of the sub-tropical jet and associated reduction in
wind shear.
There is not a good understanding of historical change in other key TC characteristics such as size
and rainfall for the Australia region, primarily due to a lack of data. Lavender and Abbs (2013)
explored historical TC rainfall trends and found a signal of significant drying due to TCs over the east
coast of Australia. However, recent work by Bruyère et al. (2019a) found that major flooding
associated with TC Debbie-like cyclones was significantly enhanced as a result of oceanic warming.
Projected changes
A challenge for projecting South Pacific TCs is that their frequency appears to be more sensitive to
circulation change than other basins (Sharmila and Walsh 2017). As stated earlier, circulation
changes are not well understood. This is reflected in the lack of model agreement in future TC
frequency found by Camargo (2013). However, Hartmann et al. (2013) and Walsh (2015) found some
agreement on a future decrease in TC frequency in the South Pacific and South Indian basins, with
some studies suggesting that the Southern Hemisphere has the strongest signal for a frequency
decrease (Sugi et al. 2012, Tory et al. 2013, Murakami et al. 2012). Bell et al. (2013) suggested that
the decrease in TC frequency will continue with increasing CO 2 due to reduced ascent and increased
wind shear.

SEVERE WEATHER IN A CHANGING CLIMATE                                                                       15
4. CHANGES TO EXTREMES FOR DIFFERENT
WARMING SCENARIOS

For the South Pacific and South Indian basins, they found a 15% decrease in TC frequency with
1.5°C of warming under 2xCO2, increasing to 30% reduction with 3°C of warming under 4xCO 2. A
similar study by Held and Zhao (2011) agreed. Yet uncertainty remains, as evidenced by model
resolution dependence of the TC response to warming (Wehner et al. 2015) and the inability of
current generation models to resolve small, short-lived TCs (“midgets”) that are commonly found in
the Australian region.
A slight increase in the lifetime maximum wind speed appears robust across studies (Walsh et al.
2016b), Uncertainty remains, particularly on the role of tropical tropopause temperatures (Ramsay
2013). Holland and Bruyère (2014) suggested a continuation of proportional increases in the
strongest TCs in the future, but also suggested an upper limit to the proportion that they referred to as
‘saturation’, imposed by basin geography.
Should the lifetime maximum intensities continue to migrate poleward, as suggested by Kossin et al.
(2014) and Lavender and Walsh (2011), cities along sub-tropical eastern and western Australian
coasts will experience TCs more often than in the past, with extratropical transitioning storms also
extending their impacts to higher latitudes. This scenario may become more likely given the finding of
Lavender and Walsh (2011) that average TC lifetime extends by 12 to 24 hours with 2 to 3°C of
warming. Regarding landfall, Parker et al. (2018) found a 5 to 10% increase in eastern Australian
landfall wind speed under an end-of-century RCP8.5 scenario.
A future increase in TC rainfall rate appears robust across many studies, driven by the strong
thermodynamic change signals. The Parker et al. (2018) study found increases in landfall hourly TC
rain rates over eastern Australia of up to 27% by the end of this century.
Given that Australia is recognised as holding the world record storm surge of 13m, associated with
Cyclone Mahina in 1899 (Nott et al. 2014), an important question is how likely such events will be in
the future. New simulation technologies are being developed to assess rare surge events for any
coastal location (Bruyère et al. 2019a; Lin and Emanuel 2016). Lin and Emanuel (2016) generated
2,400 synthetic TC surge events for Cairns using wind fields from the TC model of Emanuel et al.
(2006) to drive a surge model. They found under current climate conditions the 0.01% (1 in 10,000
year) surge to be 5.7m, generated by a TC that was only slightly more intense than Cyclone Yasi but
with a slightly different track. Storm surge risk associated with TCs will increase (ie return periods will
contract by an order of magnitude) due to increasing sea levels associated with global warming (eg
Lin and Emanuel 2016, Woodruff et al. 2013).
Finally, an idealised modelling study by Lavender et al. (2018) suggested caution in extrapolating
empirical associations with temperature from past climate. They showed that relationships between
SST and TC intensity, size, rainfall and surge may be far from linear.

Regional Interpretations for Risk Assessment for Australia and New
Zealand
For several decades, the (re)insurance industry has used a catastrophe modelling approach for risk
assessment purposes. This framework simulates physically plausible peril events from the very
frequent to the very rare and therefore considers a much broader range of possible events than the
historical record.

SEVERE WEATHER IN A CHANGING CLIMATE                                                                      16
4. CHANGES TO EXTREMES FOR DIFFERENT
WARMING SCENARIOS

Recently the catastrophe modelling framework is also being used for wind risk assessment as an
alternative and more comprehensive approach for engineering considerations on the wind hazard
(https://www.ga.gov.au/about/projects/safety/tcha). This is a promising development to improve the
alignment between disparate risk modelling approaches.
This section combines the latest available global and basin-wide climate change science with
meteorological interpretation that is based upon the collective experience of the authors to derive the
regional changes to the frequency and intensity of TCs around the coastlines of Australia and New
Zealand.
The key factors and assumptions behind these regional changes are summarised below, followed by
an in-depth discussion on the south-east Queensland and north-east New South Wales region, which
is expected to have the largest changes in TC risk.
The key factors relevant to the changing climatology of TCs in Australia and New Zealand are:
    1. There is high natural variability at seasonal, annual, decadal and multi-decadal time scales at
       a regional scale and this creates significant challenges to identifying and quantifying trends in
       TC numbers and intensities. The changes that have been estimated therefore relate to the
       long-term change in risk, not the risk in any given year.

    2. The current climate change signal for the Australian land mass is equivalent to a warming of
       around 1.2°C since pre-industrial times (Bureau of Meteorology State of the Climate 2018). It
       is highly likely that the TC climatology of Australia and New Zealand has already changed due
       to this warming signal.

    3. There is likely a greater proportion of strong TCs (Saffir-Simpson Categories 4 and 5) in the
       most recent decades compared to the 1970s (Holland and Bruyère 2014). In pre-industrial
       times, approximately 10% of all TCs are estimated to have been Category 4 or 5. Currently,
       approximately 25% of all TCs reach this peak intensity. It is likely that this rising trend could
       continue before the upper limit or ‘saturation point’ is reached. Recently, Bruyère et al. (2019b)
       analysed trends in TCs in the region south of the equator between 135°E and 180°E using the
       NCAR Decadal Prediction Large Ensemble (DPLE: Yeager et al. 2018) dataset. They found a
       10% increase in the proportion of strong TCs between the decades centred on 1960 and
       2010, and a further 10% increase predicted for the decade centred on 2020. Importantly, from
       a property risk perspective, the less frequent but intense TCs drive the majority of the risk.

    4. There has been a poleward shift of the maximum lifetime intensity in the South Indian Ocean
       and South West Pacific Ocean basins (Kossin et al. 2014). Applied to the east coast of
       Australia these imply southward shifts in the overland impacts compared to the historical TC
       impacts. Current research work in progress with the NCAR DPLE dataset is expected to
       strengthen the science behind these initial estimates. For the west coast south from Shark
       Bay, the poleward shift is expected to be smaller than off the east coast due to the presence
       of cooler waters off the west coast that are projected to continue to the end of the present
       century, although warming slowly (see SST trend map in Fig. 7 based upon ERA-Interim V5.0
       data). Based on unverified research, increased strength and prevalence of heat lows in the
       Pilbara and Gascoyne regions may lead to increased incidence of dry air intrusion that could
       reduce TC intensity (see Fig. 8 on trends in summer cyclone density).

SEVERE WEATHER IN A CHANGING CLIMATE                                                                   17
4. CHANGES TO EXTREMES FOR DIFFERENT WARMING SCENARIOS Fig. 7 Trends in SST anomalies for the Coral Sea region showing the trends in SST for February in oC per decade for the period 1979 to 2018. (Source ERA-Interim V5.0) Fig. 8 Trend in summer cyclone density between 1950 and 2018 showing the increasing frequencies of cyclones in the form of heat lows for the west Pilbara to west Gascoyne region of Western Australia and tropical lows over the Arnhem Land region of the Northern Territory. (Source Bureau of Meteorology. http://www.bom.gov.au/climate/change/about/lps_trendmaps.shtml) SEVERE WEATHER IN A CHANGING CLIMATE 18
4. CHANGES TO EXTREMES FOR DIFFERENT
WARMING SCENARIOS

    5. TCs in the Australian and New Zealand region are likely to last longer due to the greater heat
       content of the oceans over which they travel. They are also likely to spend a greater
       proportion of their life cycle as higher category TCs (Bruyère et al. 2019b). This is particularly
       the case for the South West Pacific Ocean where a general southward shift of the sub-tropical
       jet stream could lead to a reduction in the vertical wind-shear over the Coral Sea to northern
       Tasman Sea region, but there is low confidence in the veracity of such circulation shifts. This
       increases the chance of TC impact in Australia, New Zealand or other South West Pacific
       islands. This trend of longer lasting and stronger TCs should continue as the world gets
       warmer.

    6. There is a lack of research concerning potential changes in TC impacts to the lower west
       coast of Western Australia. One interpretation of the available evidence is that this area is
       expected to become more vulnerable to transitioning TCs that originate from the central and
       south-east Indian Ocean – similar to those of TCs Marcelle (1973) and Idylle (1979). There is
       also the potential for a slight increase in TC Alby-like events due to a slow southward
       expansion of the favourable South Indian Ocean TC regions and gradual warming of the
       Leeuwin Ocean Current down the west coast. However, detailed research is required to test
       the validity of this assessment.

    7. The TC seasons are expected to gradually lengthen for the +2°C and >+2°C scenarios,
       although it is considered that there has already been an extension of the late season TC
       climate for the Coral Sea. For example, TC Zane (2013) was a minimal Australian Category 3
       cyclone that formed in late April and weakened in early May as it crossed the north
       Queensland coast; and TC Ann reached Australian Category 2 intensity in the Coral Sea in
       mid-May 2019.

    8. With warmer environments, TCs are expected to increase significantly rainfall and run-off
       quantities. An increase of around 7% in short-term extreme precipitation for each degree
       Celsius of warming is likely, due to the increased moisture capacity of the atmosphere
       indicated by the Clausius-Clapeyron relationship (Trenberth et al. 2003, Prein et al. 2017a).
       Rainfall volumes (Bruyère et al. 2019a, 2019b) and storm run-off extremes (Yin et al., 2018)
       have been shown to increase at rates significantly higher than the 7% suggested by Clausius-
       Clapeyron scaling alone due to increased intensity, longer life, expansion of the heavy rainfall
       area and increased inland penetration of future TCs.

    9. The potentially changing nature of the important sub-type of TCs referred to as midgets, which
       includes TC Tracy that devastated Darwin in 1974, remains an area of large uncertainty due to
       their small size and the inability of the current generation of climate models to adequately
       resolve them.

    10. For New Zealand, the southward extension of the latitudinal band favourable for TC
        development and intensification is expected to lead to an increased number of TC-related
        impacts across the nation. Most impacts are expected to be from tropical systems that are
        undergoing extratropical transition. The 2017-2018 season may be an early indication that this
        trend is already underway with a record three extratropical cyclones (ETCs) affecting the
        island nation.

SEVERE WEATHER IN A CHANGING CLIMATE                                                                    19
4. CHANGES TO EXTREMES FOR DIFFERENT
WARMING SCENARIOS
However, insufficient research means that there remains a high degree of uncertainty in ETC
trends. The work of Ramsay et al. (2018) and Knutson et al. (2019a, 2019b) serves as a good
launching pad for future, more tailored, studies on TCs and ETCs in the Australian and New
Zealand region.
11. The effect of clustering of severe weather events has not yet been investigated. A series of
events in close succession, including those below TC intensity, can cause greater damage
than individual events.
Fig. 9 summarises the expected regional changes to both the frequency of all TCs and the frequency
of the intense TCs (Australian Categories 3, 4 and 5) between the 1950s, after which time most of the
observed global warming has occurred, and the +3°C climate change scenario. It is important to note:
• some of the expected changes shown have already occurred with the warming to date;
• the change in TC frequency is likely to be very different between regions around the Australian
coastline;
• local changes may differ significantly compared to the broader basin-wide changes; and
• the changes described below only relate to the wind component of TCs and do not include
other important risk drivers – such as water ingress, flooding caused by more intense short
duration or storm-total rainfall, storm surge, wave impacts and coastal erosion – that are very
likely to worsen.
Fig. 9 summarises the expected regional changes to the frequency of all TCs, low intensity TCs (Australian
Categories 1 and 2) and intense TCs (Australian Categories 3, 4 and 5).
SEVERE WEATHER IN A CHANGING CLIMATE 204. CHANGES TO EXTREMES FOR DIFFERENT
WARMING SCENARIOS
Here are the expected changes by region:
• Central/south-east Queensland and north-east New South Wales
In the +3°C scenario and beyond, the southward shift of the LMI moves the highest risk area
from the north coast of Queensland southwards into the central coastal region. The southward
shift is causing the largest relative change (not absolute change) for the southern margins of
the TC-affected regions in south-east Queensland and north-east NSW. Although still likely to
be uncommon events, the very rare high category TCs are expected to have a slower decay
rate in intensity (ie have a higher intensity) in a warmer climate due to the increased SSTs off
the central and south-east coasts of Queensland which are capable of sustaining strong TCs.
• Far north Queensland, the Northern Territory and northern Western Australia
The southward shift of the LMI would tend to marginally reduce the currently high TC wind
risks in these regions, although there will remain a relatively high risk of impacts from intense
TCs. When increasing rainfall and storm surge-related factors are considered, the total TC-
related risk may not decline.
• South-west Western Australia
The waters off the west coast from Shark Bay southwards are cooler than those off the east
coast. The warming effects of climate change large enough to maintain severe TCs should be
slower to manifest themselves in this region. Nonetheless, it is very likely there will be ongoing
warming of the waters off the west coast of Australia which should lead to a commensurate
increase in the risk of higher intensity TCs than has been historically observed, although the
rate of increase in risk should be slower than for the east coast.
South-east Queensland / North-east New South Wales Case Study
Applying the climate change science and meteorological understanding of TC behaviour specifically
to the south-east Queensland to north-east NSW region reveals substantial changes in future climate
risk, even if the total number of high category TCs across the broader South West Pacific region does
not change substantially. The ability of the oceans and atmosphere across the southern Coral Sea
and northern Tasman Sea to sustain higher intensity TCs further south and for longer periods of time,
coupled with increasing storm-total rainfall and rising sea levels, leads to a faster increasing risk
compared to the regions further north.
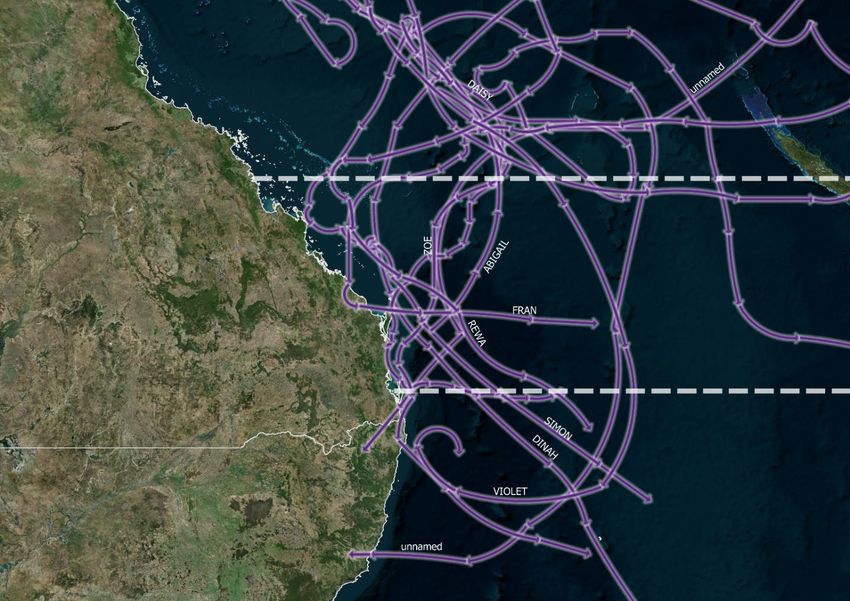
The ten most significant TCs that have affected the south-east Queensland to north-east NSW region
since 1954 (Table 2 and Fig. 10) reached an average peak intensity of around 950hPa at a mean
latitude of 21.5oS, with the average SST close to the time of maximum intensity being 27.3oC, from
the NOAA Extended SST Reanalysis version 4. They had an average central pressure of 977hPa
when they reached 27oS and the average SST at the time of these TC events was 26.0 oC off the
Brisbane coast.
In Fig. 7, the observed change in SSTs between the mid-1950s and the most recent five-year period
(2015-2019), in the peak TC month of February, shows SSTs at the mean latitude where these TCs
have historically reached maximum intensity have warmed by between 0.7-0.8oC.
SEVERE WEATHER IN A CHANGING CLIMATE 214. CHANGES TO EXTREMES FOR DIFFERENT
WARMING SCENARIOS
At the latitudes from Brisbane down to the north-east of New South Wales, the observed warming has
been around 1.0oC. The study on Maximum Potential Intensity by Holland (1997) stated that the rate
of increase of TC intensity is in the order of -30hPa per degree Celsius of warming when all other
conditions are favourable with SSTs between 26 oC and 28oC.
This would imply that the current state of warming seas off south-east Queensland and north-east
New South Wales would support TCs approximately one category stronger than the sea temperatures
of the 1950s.
Table 2 Selected details of the 10 most significant TCs since 1954 that have affected the south-east
Queensland to north-east New South Wales region, along with some relevant SST estimates from the NOAA
Extended SST Reanalysis version 4 dataset.
At Maximum Intensity At 27oS At Coastal
Impact
Cyclone Year Central Latitude Longitude SST (oC) SST (oC) Central Central
Name Pressure (oS) (oE) Pressure Pressure
(hPa)
(hPa) (hPa)
Coolangatta 1954 960 -27.24 153.75 26.45 26.45 960 962
Unnamed 1957 953 -15.8 150.8 28.55 25.45 960 990
Dinah 1967 945 -24.7 153.2 26.45 25.65 954
Daisy 1972 959 -23.6 154.4 27.25 25.85 996 994
Zoe 1974 968 -21.6 155.9 26.65 25.95 983 986
Simon 1980 950 -22.5 150.8 28.25 26.85 979
Abigail 1982 947 -21.5 162.4 27.35 26.85 990
Fran 1992 940 -18.1 164.6 27.65 26.05 990 992
Rewa 1993 920 -18.7 154.2 27.75 24.85 990
Violet 1995 960 -22.2 158.1 26.95 26.55 970
SEVERE WEATHER IN A CHANGING CLIMATE 224. CHANGES TO EXTREMES FOR DIFFERENT
WARMING SCENARIOS
21.5oS
Queensland 27.0oS
New South Wales
Fig. 10 Tracks of the ten most significant TCs to have affected the south-east Queensland and north-east New
South Wales region since 1954. The horizontal dashed lines show the mean latitude of maximum intensity for
this set of TCs (21.5oS) and the latitude of Brisbane (27.0oS).
Two recent TCs have demonstrated that very severe TCs can occur at the latitudes of south-east
Queensland. On 10 March 2009, Severe TC Hamish was observed to have a central pressure of
around 952hPa (Australian Category 4) at 24.7 oS just to the east of Fraser Island; and Severe TC
Oma was analysed at 973hPa (Australian Category 3) at 27 oS on the morning of 23 February 2019 in
the southern Coral Sea.
It must be noted that there is considerable uncertainty in the derivation of the regional insights noted
above and this highlights a pressing need for in-depth research to reduce these uncertainties. IAG
and NCAR have a current project underway to quantify the changing TC risk profiles across eastern
Australia, specifically south-east Queensland and north-east New South Wales, using the DPLE and
Large Ensemble Numerical Simulation (LENS) datasets.
SEVERE WEATHER IN A CHANGING CLIMATE 234. CHANGES TO EXTREMES FOR DIFFERENT WARMING SCENARIOS 4.2 Extreme Precipitation and Flooding Background The IPCC states in its AR5 report (IPCC 2013) that, based on historic observations, there are likely more land regions where the number of heavy precipitation events has increased than decreased. The recent detection of increasing trends in extreme precipitation and discharge in some catchments implies greater risk of flooding at a regional scale. This trend of increasing frequency and intensity of extreme precipitation events will very likely continue and intensify with rising temperatures in many regions. When viewed from an insurance perspective, the extremes that produce damage tend to be much rarer than those discussed in scientific literature, with trends in rainfall that occurs only once every 30 years roughly equating to the 99.999 th percentile for extremely damaging events. From an insurance perspective, events close to the 99th percentile typically produce only modest levels of damage. The rate at which extreme precipitation will intensify is theoretically related to the water-holding capacity of the atmosphere. Air can hold approximately 7% more water vapour for each degree Celsius of warming, which translates to a theoretical increase in short-term extreme precipitation by approximately the same rate (Trenberth et al. 2003, Prein et al. 2017a). These rates can, however, be strongly modified by changes in storm characteristics, such as size, translation speed or non-linear storm dynamics (Westra et al. 2014, Prein et al. 2017b). Extreme precipitation increases higher than 7% per degree Celsius of warming can occur for cold season extremes due to a transition from stratiform to convective rainfall for temperatures above ~10°C (Berg et al. 2013). Furthermore, the atmospheric circulation patterns that trigger heavy precipitation events are also likely to change, thereby either enhancing or partially offsetting thermodynamic effects. The changes in atmospheric circulation patterns are a major source of uncertainty, while thermodynamic changes are more certain (Shepherd 2014). It is important to realise that changes in extreme precipitation rates are decoupled from changes in mean precipitation. This means that extreme precipitation can intensify significantly with climate change in regions that experience drying on average (Giorgi et al. 2011, Ban et al. 2015, Prein et al. 2017a). Frequency changes in extreme precipitation are expected to show even higher rates than intensity changes where higher return level events experience a stronger increase (see Section 3.2). Fig.11 shows the increase of the 20th century 100-year flood at the end of the 21st century under a >+2oC scenario. In the Murray Basin (Fig.11), for example, the 100-year current climate flood is projected to occur every 5-25 years at the end of the century, which is a 400-2000% increase in frequency. Similar large projected increases have been reported for other regions (eg Prein et al. 2017a, 2017b). SEVERE WEATHER IN A CHANGING CLIMATE 24
4. CHANGES TO EXTREMES FOR DIFFERENT
WARMING SCENARIOS

    Fig. 11 Projected return period of the 20th century 100-year flood at the end of the 21st century under the
    RCP8.5 scenario at the outlets of 29 selected river basins. The colour of each basin indicates the multi-
    model median return period at basin outlets (source Hirabayashi et al. 2013).

Changes in Australia
Assessing climate change impacts on extreme precipitation in Australia and its regions is more
uncertain than the above generalised global estimates due to the large natural variability in Australian
rainfall on annual to decadal timescales.

Observed changes
Observed changes in heavy precipitation in Australia are consistent with global studies but the
existing climatology of severe convective storms across Australia is poor and complicates the
detection and attribution of historic changes in extreme rainfall.
The fraction of Australia that receives a high proportion of its annual rainfall (greater than 90% of daily
precipitation) from extreme events (greater than 90th percentile) has increased since the 1970s
(Gallant et al. 2013). The east coast has experienced a significant decrease in extreme rainfall events
since 1950 (Gallant et al. 2014) while parts of Victoria and the west coast have seen increases
(Fig. 12).

SEVERE WEATHER IN A CHANGING CLIMATE                                                                              25
4. CHANGES TO EXTREMES FOR DIFFERENT WARMING SCENARIOS Wasko et al. (2016) showed that total precipitation and the maximum precipitation intensity increases with temperature in Australian observational records, while the storm's spatial extent decreases. This indicates that flood severity increased over the observational record since extreme precipitation became more intense and spatially concentrated. Observed changes in precipitation measurements are consistent with changes in annual maximum streamflow (Ishak et al. 2013). Ishak et al. (2013) attributed most of the decreasing flood magnitudes to natural climate variability, indicating that forced climate change impacts on extreme precipitation are small compared to internal variability in the observational records. This is in line with other studies showing that extreme rainfall time series are strongly affected by climate variability, with El Niño Southern Oscillation (ENSO) being the dominant driver (King et al. 2013, King et al. 2014). Changes in ENSO due to climate change are uncertain and generally within the range of natural variability (Chen et al. 2017). The most robust change signal is an intensification of eastward-propagating warm sea surface anomalies that is a characteristic of very strong El Niño events (Cai et al. 2015). At the same time, extreme La Niña events are also projected to increase in frequency, resulting in more frequent ENSO- related catastrophic extreme events in warmer climates. However, these results are associated with considerable uncertainties. Fig. 12 Trend in daily rainfall intensity 1920–2016 (mm/year, source Bureau of Meteorology). SEVERE WEATHER IN A CHANGING CLIMATE 26
You can also read