Sf - Healthy Kansans 2020
←
→
Page content transcription
If your browser does not render page correctly, please read the page content below

Sf
                                                                               Social Factors
                                                                              Affecting Health

Social Factors Affecting Health
                                                      of physical environment. Due to these inequities,
               HP 2020 Goals                          differences are seen in the material conditions,
Create social and physical environments that          psychosocial support and behavioral options for
promote good health for all.                          different subgroups of the population making
Achieve health equity, eliminate disparities          them more or less vulnerable to poor health.
and improve the health of all groups.                 These social inequities also affect access to
            HP 2020 Objective                         timely and quality health care and its utilization,
                                                      which lead to inequities in the health promotion,
                          Target: Not applicable
                                                      disease prevention, treatment and recovery from
                          (HP2020 guideline for
                                                      illness and survival.4 These complex, integrated
                          this objective is to
                                                      and overlapping social structures and economic
                          track this measure for
Proportion of persons                                 systems effecting health of the population are
                          informational purpose
living in poverty.                                    referred to as social determinants of health.1
                          and that if warranted,
                          HP2020 will set a
                                                      To achieve health equity it is important to address
                          target during the
                                                      social determinants of health, which requires
                          decade).
                                                      advances in education, childcare, housing,
                                                      business, law, media, community planning,
Summary                                               transportation and agriculture.4,5,6 To address
                                                      social determinants of population health, the
In addition to genetic factors, health results        Department of Health and Human Services
from the choices that people are able to make         Secretary’s Advisory Committee on National
in response to the options that are available to      Health Promotion and Disease Prevention
them in their social and physical environments.1      Objectives for 2020 has recommended to use a
The current structure of our society leads to         health in all policies approach – a comprehensive
inequities that are seen in early childhood           approach where all parts of government work
conditions, availability of educational and           toward common goals to achieve improved
employment opportunities, quality of working          health for all and reduce health inequities.1 The
conditions, as well as in the structure and quality

                                                                                                       91
World Health Organization’s Commission on                structure and quality of the physical environment.
 Social Determinants of Health has also called on         Differences are seen in the material conditions,
 all governments to address social determinants           psychosocial support and behavioral options for
 of health by taking the following steps: “improve        different subgroups of the population, making
 the conditions of daily life,” “tackle the inequitable   them more or less vulnerable to poor health.
 distribution of power, money, and resources,”            These social inequities also affect access to
 and “measure and understand the problem and              timely and quality health care and its utilization,
 assess the impact of action.”4                           which lead to inequities in the health promotion,
                                                          disease prevention, treatment and recovery from
 The goal for eliminating the health disparities has      illness, and survival.4 These complex, integrated
 not been reached despite the public health efforts       and overlapping social structures and economic
 at the national and state level. Several Kansas          systems effecting health of the population are
 health indicators show the presence of health            referred to as social determinants of health.1 The
 disparities. This indicates a need for collaboration     World Health Organization (WHO) defines social
 with all essential partners to develop strategies        determinants of health as “the circumstances in
 to address the inequities related to social              which people are born, grow up, live, work, and
 determinants of health to improve the health of          age, as well as the systems put in place to deal
 all Kansans.                                             with illness. These circumstances are in turn
                                                          shaped by a wider set of forces: economics, social
 Definition and Introduction                              policies, and politics.”2,3 In addition to health care,
                                                          advances are needed in education, childcare,
 An extensive body of knowledge has established           housing, business, law, media, community
 that protection, maintenance and improvement             planning, transportation and agriculture.5
 of health require more than just controlling
 disease. In addition to genetic factors, health          To address social determinants of population
 results from the choices people are able to make         health, the Department of Health and Human
 in response to the options available to them.            Services Secretary’s Advisory Committee on
 The options are determined by the conditions             National Health Promotion and Disease Prevention
 in their social and physical environments.1              Objectives for 2020 has recommended to use a
 The circumstances for living a prosperous and            health in all policies approach – a comprehensive
 healthy life are unequally distributed between           approach where all parts of government work
 and within society. These societal inequities are        toward common goals to achieve improved
 seen in early childhood conditions, availability         health for all and reduce health inequities.1 The
 of educational and employment opportunities,             World Health Organization’s Commission on
 quality of working conditions as well as in the          Social Determinants of Health has also called on
                                                          all governments to address social determinants
                                                          of health by taking the following steps: “improve
                                                          the conditions of daily life,” “tackle the inequitable
                                                          distribution of power, money, and resources”
                                                          and “measure and understand the problem and
                                                          assess the impact of action.”4

                                                          The Healthy People 2020 has developed a “place-
                                                          based” organizing framework of the following five
                                                          key areas of social determinants of health: (1)
                                                          Social and Community Context, (2) Economic
                                                          Stability, (3) Education, (4) Neighborhood and
                                                          Built Environment, and (5) Health and Health
                                                          Care.5

92
Key Areas of Social Determinants of Health               cancer, heart disease, stroke, substance abuse,
                                                         infant mortality and low birth weight are seen
                                                         among African Americans, Hispanic Americans,
                                                         American Indians, Asian Americans, and Native
                                                         Hawaiians/Other Pacific Islanders. These racial
                                                         and ethnic groups represent 25 percent of the
                                                         nation’s population.10 Racial and ethnic health
                                                         disparities associated with the multiple indicators
                                                         of physical and mental health are believed to be
                                                         the result of complex interaction among genetic
                                                         variations, environmental factors, specific health
                                                         behaviors, and social factors including racial
                                                         discrimination.10,11

                                                         In Kansas population is comprised of 78 percent
                                                         non-Hispanic whites, 6 percent of non-Hispanic
                                                         African Americans, 11 percent of Hispanics, and
                                                         5 percent of all other non-Hispanic races.

                                                         Kansas data mirror national findings on racial/
 Source: Social Determinants of Health. Healthy People
                                                         ethnic health disparities. Kansas Native
 2020. U.S. Department of Health and Human Services.
                                                         Americans die sooner than others from diabetes
                                                         and report higher rates of risk behaviors related
Status of Relationship Between                           to injury and death. Kansas African Americans
                                                         have a higher infant mortality rate, die sooner
Health and Social Determinants of
                                                         than others from cancer, stroke and diabetes,
Health in Kansas:                                        and die more often from homicide. Kansas
                                                         Asians and Pacific Islanders may be reluctant
Social and Community Context                             to submit to certain health screening tests and
Race and Ethnicity, Perceptions of                       are, therefore, at risk for late detection of some
Discrimination and Equity:                               diseases. Kansas Hispanics have the lowest
                                                         rate of seeking early prenatal care and have the
Race and ethnicity are important socio-cultural
                                                         lowest educational attainment rates, a known
constructs that are linked to socio-economic
                                                         predictor for poor health outcomes later in life.12
factors. These constructs indicate the social
                                                         Higher age-adjusted percentages of Kansas
classification of people and can capture the
                                                         African Americans, American Indians/Alaskan
impact of racism.8 Racial discrimination leads to
                                                         Natives and Hispanics 18 years old and older
disparities in income, education, neighborhood
                                                         have diabetes as compared to white Kansans.13,14
poverty and access to health care.9 Scientific
                                                         The age-adjusted stroke death rates are higher
evidence has showed that racial and ethnic
                                                         among African Americans as compared to
minority groups experience poorer health
                                                         whites during the last several decades. Although
compared to the overall population of the
                                                         declining trends in stroke deaths are seen in both
United States.10 The differences in the health
                                                         racial groups, the death rate is higher for African
among racial and ethnic groups in the U.S.
                                                         American Kansans than for white Kansans each
have been observed consistently across a
                                                         year during the last several decades.15 Similarly,
large number of health indicators throughout
                                                         the age-adjusted prevalence of obesity is higher
the life span i.e., from birth through old age.9
                                                         among African Americans and other races as
Significant health disparities, including shorter
                                                         compared to whites.13,14
life expectancy and higher rates of diabetes,

                                                                                                          93
Race/Ethnicity in Kansas, 2000 and 2010
                                             2000                                2010                   Percent
        Race/Ethnicity
                                  Number            Percent           Number            Percent         Change
           White/Caucasian         2,233,997            83.1%          2,230,539            78.2%          -0.2%
            Hispanic/Latino          188,252             7.0%            300,042            10.5%          59.4%
     Black/African American          151,407             5.6%            165,700             5.7%           7.5%
                       Asian          46,301             7.1%             66,967             2.3%          52.7%
        Two or More Races             42,508             1.6%             64,891             2.3%          52.7%
           American Indian/
                                        22,322             0.8%            23,037             0.8%            3.2%
             Alaskan Native
           Native Hawaiian/
                                         1,154             0.0%              1,978            0.1%          71.4%
             Pacfic Islander
                 Other Race             2,477             0.1%              2,928             0.1%          18.2%
                       Total        2,688,418           100.0%          2,853,118           100.0%           6.1%
 Source: U.S. Census Bureau

 Age-Adjusted Prevalence of Diagnosed Diabetes Among Adults 18 Years Old and Older
                   by Race and Ethnic Groups, Kansas 2006-2010

 Source: 2006-2010 Kansas Behavioral Risk Factor Surveillance System, Bureau of Health Promotion, Kansas
 Department of Health and Environment. Prevalence estimates were age-adjusted to the U.S. 2000 Standard Population.

94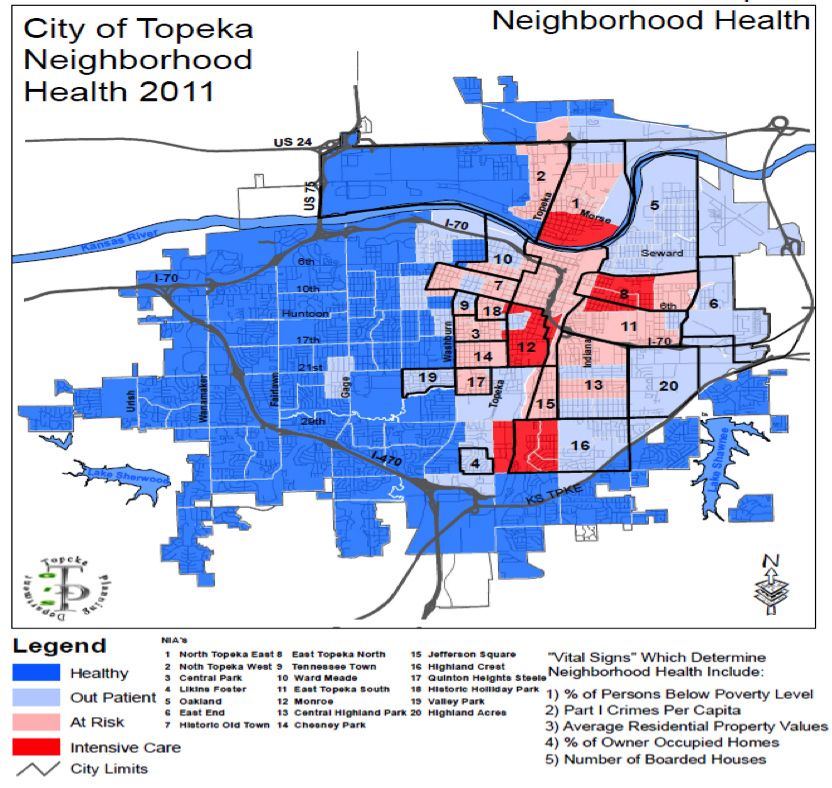
Age-Adjusted Stroke Mortality Rates by Race Groups, Kansas 2000-2008

Source: 2006-2008 Kansas Vital Statistics. Bureau of Public Health Informatics, KDHE. Rates were age-adjusted to the
U.S. 2000 Standard Population using the direct method.

        Age-Adjusted Prevalence of Obesity Among Adults 18 Years Old and Older
                      by Race/Ethnic Groups, Kansas 2009-2010.
                                         Percentage of Adults 18 Years
Racial/ Ethnic Group                      and Older Who are Obese                   95% Confidence Interval
                                                (Age-Adjusted)
Non-Hispanic White                                     29.2%                             27.7% to 30.8%
Non-Hispanic African American                          39.2%                             32.2% to 46.1%
Non-Hispanic Other/Multi-Race                          28.4%                             22.5% to 34.4%
Hispanic                                               34.9%                             28.6% to 41.1%
Obesity is defined as Body Mass Index 30 or higher

Source: 2009-2010 Kansas Behavioral Risk Factor Surveillance System, Bureau of Health Promotion, Kansas
Department of Health and Environment. Prevalence estimates for race and ethnicity were age-adjusted to the U.S. 2000
standard population.

                                                                                                                       95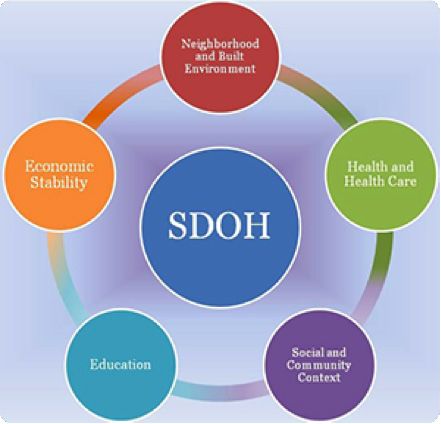
Economic Stability
  The two key components of economic stability are         In Kansas, 13.6 percent (377,530 people)
  poverty rate/household income and employment             of residents are living in poverty (below the
  status.                                                  poverty level).6 and about 18.4 percent of
                                                           children (131,258 children) are living in poverty.17
  Poverty and Household Income                             Disparities are seen in the percentage of people
                                                           living in poverty in racial and ethnic groups in
  The poverty rate is an economic indicator that
                                                           Kansas with higher percentages of American
  measures the percentage of people with income
                                                           Indians, African Americans and Hispanics living
  below the poverty threshold. For estimating the
                                                           in poverty as compared to whites.18
  percentage of people living in poverty, the U.S.
  Census Bureau compares annual income to a
                                                           An extensive body of evidence has shown that
  set of dollar values called poverty thresholds that
                                                           poor health is very strongly correlated with
  vary by family size, number of children and age
                                                           low income and poverty level. Poor people
  of householder. If a family’s before tax income
                                                           are less healthy than those who have more
  is less than the dollar value of their threshold,
                                                           money, whether the benchmark is mortality, the
  then that family and every individual in it are
                                                           prevalence of acute or chronic diseases, mental
  considered to be in poverty. For people not living
                                                           health or their associated risk behaviors and
  in families, poverty status is determined by
                                                           factors. Greater differences in health are seen
  comparing the individual’s income to his or her
                                                           when a greater gap exists between the richest
  poverty threshold.16
                                                           and poorest people.20,21
  About 15.3 percent Americans of all ages are
                                                           In Kansas, disparities are seen in the burden of
  living in poverty (below poverty level). Nationally,
                                                           diseases and their risk factors among income
  between 2000 and 2010, the percentage of people
                                                           groups. The prevalence of arthritis, coronary
  in poverty increased from 12.2 percent to 15.3
                                                           heart disease, stroke and diabetes is significantly
  percent, while the number of people in poverty
                                                           lower among Kansans 18 years old and older with
  increased from 33.3 million to 46.2 million.16
                                                           an annual household income of $50,000 or more
  Poverty is a critical indicator of the well-being
                                                           as compared to those with lower incomes.13, 14
  of our nation’s children. The national estimates
  show that 1 in 5 children (21.6% children, i.e.,
  131,258 children) is living in poverty.17

             Percentage of Kansans Living in Poverty by Race and Ethnic Groups, 2010
Percentage

                                             Race/Ethnic Groups
  Source: American Community Survey, U.S. Census Bureau.

96
Annual Household Income in Kansas
2008-2012 American Community Survey 5-Year Estimates.
Percentage
Annual Household Income Groups
Source: American Community Survey, U.S. Census Bureau.
Prevalence of Diagnosed Diabetes Among Adults 18 Years Old and Older
by Annual Household Income and Age, Kansas 2009-2010.
Source: 2009-2010 Kansas Behavioral Risk Factor Surveillance System, Bureau of Health Promotion, Kansas
Department of Health and Environment
97The prevalence of several behavioral health risk factors, including smoking and not meeting current
physical activity guidelines, is significantly higher among adults with annual household incomes less
than $15,000 as compared to those with higher incomes.13
Prevalence of Current Smoking Among Adults 18 Years Old and Older
by Annual Household Income, Kansas 2010
Source: 2010 Kansas Behavioral Risk Factor Surveillance System, Bureau of Health Promotion, KDHE.
Employment Status
Scientific evidence has shown that employment status affects health status. Unemployed adults
have poorer mental and physical health than employed adults.21,22 In addition to having poorer health,
unemployed adults are more likely to delay or not receive needed medical care and needed prescriptions
due to cost than their employed counterparts.21,22 Thus, the unemployed adults have both worse health
and less access to needed care and treatment than employed adults.21,22
In Kansas, a higher percentage of adults 18 years old and older who are out of work or are unable
to work have diabetes as compared to those who are employed for wages or self-employed.13 The
prevalence of several behavioral health risk factors, including smoking and not participating in any
physical activity, is significantly higher among adults 18 years old and older who are out of work or are
unable to work as compared to those who are employed for wages or self-employed.13
Prevalence of Diagnosed Diabetes Among Adults 18 Years Old and Older
by Employment Status, Kansas 2010
Percentage of Adults Ages
95% Confidence
Employment Status 18 Years and Older with
Interval
Diagnosed Diabetes
Employed for Wages/Self- Employed 5.3% 4.6%-6.0%
Out of Work 10.7% 6.7%-14.8%
Unable to Work 25% 20.2%-29.8%
Source: 2010 Kansas Behavioral Risk Factor Surveillance System, Bureau of Health Promotion, KDHE.
98Prevalence of Current Cigarette Smoking Among Adults 18 Years Old and Older
by Employment Status, Kansas 2010
Percentage of Adults Ages
95% Confidence
Employment Status 18 Years and Older Who are
Interval
Current Cigarette Smokers
Employed for Wages/Self- Employed 16.2% 14.6%-17.7%
Out of Work 34.8% 27.6%-42.1%
Unable to Work 41.3% 35.0%-47.5%
Source: 2010 Kansas Behavioral Risk Factor Surveillance System, Bureau of Health Promotion, KDHE.
Education
A strong body of evidence indicates that education level, one of the measures for assessing socio-
economic status, is an important predictor of health status. Low education levels are linked with poor
health, more stress and lower self-confidence, whereas higher education predicts good health.21, 23
Attainment of better education can increase incomes and empower individuals to more effectively
promote their own health.7 Education is one of the factors for early childhood development that has a
determining influence on subsequent life chances and health. Education and skills development during
early childhood helps improve occupational opportunities and reduce risk of obesity, malnutrition,
mental health problems, heart disease and criminality throughout one’s life span.4
In Kansas, 38 percent of adults 25 years old and older have no education beyond high school, 24.4
percent have attended but not completed college, 7.5 percent have an associate’s degree, 19.6 percent
have bachelor’s degree and 10.4 percent have graduate or professional degrees.24
Educational Attainment Among Kansans 25 Years Old and Older.
2008-2012 American Community Survey 5-Year Estimates
Percentage
Educational Attainment Level
Source: American Community Survey, U.S. Census Bureau.
99In Kansas, disparities are seen in the burden of diseases and their risk factors among education status
groups. The prevalence of arthritis, coronary heart disease, stroke and diabetes is significantly lower
among Kansans 18 years old and older who are college graduates as compared to those with less
education.13, 14
Prevalence of Diagnosed Diabetes Among Adults 18 Years Old and Older
by Level of Education and Age, Kansas 2009-2010
The prevalence of several behavioral health risk factors, including smoking and not meeting current
physical activity guidelines, is significantly higher among adults with less than high school education as
compared to those with higher education.13
Prevalence of Current Smoking Among Adults 18 Years Old and Older
by Level of Education, Kansas 2010
Level of Education
Source: 2010 Kansas Behavioral Risk Factor Surveillance System, Bureau of Health Promotion, KDHE.
100Neighborhood and Built Quality of Housing
Environment Poor quality housing contributes to health
The two key indicators reflecting characteristics problems. A shortage of affordable housing often
of neighborhood and built environment are crime/ relegates lower-income families to substandard
violence and quality of housing. housing in unsafe, overcrowded neighborhoods
with higher poverty rates and fewer resources for
Crime/Violence health promotion. Neighborhoods may promote
health by providing safe places for children and
Fear of crime has been associated with poorer adults to exercise, as well as access to grocery
mental health, reduced physical functioning and stores and fresh produce.25
lower quality of life.26 In Kansas in 2011, a total of
10,091 violent crime offenses including murder, Limited data on housing and health in Kansas
rape, robbery and aggravated assault/battery are currently available. The City of Topeka
(3.4 offenses per 1,000 persons) and 86,505 Neighborhood Health 2011 Map provides an
property crime offenses including burglary, theft example of mapping social determinants of
and motor vehicle theft (29.3 offenses per 1,000 health to identify at risk areas of a city. This
persons) were reported to law enforcement example combines data on crimes, poverty,
agencies.27 The highest rates of violent crimes property value, home ownership and boarded
were seen in Sedgwick (6.6 offenses per 1,000 houses. While this does not cover all the social
persons) and Wyandotte (6.1 offenses per 1,000 determinants of health, it does give a broad
persons) Counties. The highest rates of property picture of the condition of the neighborhoods.
crimes were seen in Wyandotte (54.0 offenses
per 1,000 persons) and Shawnee (50.0 offenses
per 1,000 persons) counties.27
Safe Streets Topeka/
Shawnee County. City
of Topeka Neighborhood
Health 2011 Map.
www.safestreets.org/
healthmap.html
101Health and Health Care
Access to health services including clinical, the illness, recovery from the illness as well as
preventive services and primary care are subsequent survival.4 It has been established
important aspects of the health and health through an extensive body of evidence that health
care area of the social determinants of health care services that prevent, diagnose, and treat
framework. disease and improve the physical and mental
well-being of individuals are essential to ensure
Health care services have not until recently been that those without disease remain healthy and
considered as a social determinant of health. those with disease or disability receive prompt
However, inequities in access to health care accurate diagnosis, appropriate treatment and
are changing this view. These inequities include improvement in quality of life. These services are
barriers faced by certain population groups at point required to be delivered in ways that are safe,
of care, such as the lack of cultural competence timely, patient centered, efficient and equitable.29
of health care providers as well as factors
related to their social and economic status.28,4 The two important indicators for the examining
The barriers determine differential access to the access to health services – health insurance
and utilization of health care, which results in coverage and access to primary care, are
inequitable promotion of health and wellbeing, described in detail in the chapter on Access to
disease prevention, provision of treatment for Health Services in this document (section 1.5).
102References
1. Healthy People 2020: An Opportunity to Address Societal Determinants of Health in the United States. Secretary’s Advisory Committee on National
Health Promotion and Disease Prevention Objectives for 2020 – Social Determinants of Health Report. Available at: http://www.healthypeople.
gov/2010/hp2020/advisory/SocietalDeterminantsHealth.htm. Accessed October 28, 2014.
2. World Health Organization. Social Determinants of Health Key Concepts. World Health Organization. Available at: http://www.who.int/social_
determinants/final_report/key_concepts_en.pdf?ua=1. Accessed October 28, 2014.
3. Centers of Disease Control and Prevention. Social Determinants of Health. Centers of Disease Control and Prevention website. 2014. Available at:
http://www.cdc.gov/socialdeterminants/. Accessed October 28, 2014.
4. Commission on the Social Determinants of Health. Closing the gap in a generation: Health equity through action on the social determinants of
health. Commission on Social Determinants of Health Final Report. Word Health Organization. Available at: http://www.who.int/social_determinants/
final_report/csdh_finalreport_2008.pdf. Accessed October 28, 2014.
5. U.S. Department of Health and Human Services. Social Determinants of Health. Healthy People 2020 website. 2014. Available at: http://www.
healthypeople.gov/2020/topicsobjectives2020/overview.aspx?topicid=39. Accessed October 28, 2014.
6. Centers for Disease Control and Prevention. Establishing a Holistic Framework to reduce Inequities in HIV, Viral Hepatitis, STDs, and Tuberculosis
in the United States. An NCHHSTP White Paper on Social Determinants of Health 2010. U.S. Department of Health and Human Services. Available
at: http://www.cdc.gov/socialdeterminants/docs/SDH-White-Paper-2010.pdf. Accessed October 28, 2014.
7. Centers for Disease Control and Prevention. Phase I Report Recommendations for the Framework and Format of Healthy People 2020. The
Secretary’s Advisory Committee on National Health Promotion and Disease Prevention Objectives for 2020. U.S. Department of Health and Human
Services. Healthy People 2020 Draft. 2009. U.S. Government Printing Office. Available at:http://www.healthypeople.gov/2020/about/advisory/
Reports.
8. Jones C. Levels of Racism: A Theoretic Framework and a Gardener’s Tale. American Journal of Public Health. 2000;90(8):1212-1215. Available at:
http://www.ncbi.nlm.nih.gov/pmc/articles/PMC1446334/. Accessed October 28, 2014.
9. Robert Wood Johnson Foundation. Race, Socioeconomic Factors and Health. Exploring the social determinants of health: Issue Brief # 6. Robert
Wood Johnson Foundation. Available at: http://www.rwjf.org/content/dam/farm/reports/issue_briefs/2011/rwjf70446. Accessed October 28, 2014.
10. National Institutes of Health. Health Disparities. Fact Sheet. U.S. Department of Human and Health Services. 2010. Available at: http://report.nih.
gov/nihfactsheets/Pdfs/HealthDisparities(NIMHD).pdf. Accessed October 28, 2014.
11. Williams DR., Neighbors HW., Jackson JS. Racial/Ethnic Discrimination and Health: Findings from Community Studies. American Journal of Public
Health. 2003 February;93(2):200-208.
12. Kimminau KS, Satzler CJ. Racial and Ethnic Minority Health Disparities in Kansas: A Data and Chart Book. Kansas Health Institute. 2005. Available
at: www.healthequityks.org/download/Data_Chartbook_full_rpt.pdf. Accessed October 28, 2014.
13. 2011 Kansas Behavioral Risk Factor Surveillance System, Bureau of Health Promotion, Kansas Department of Health and Environment. Available
at: http://www.kdheks.gov/brfss/index.html. Accessed October 28, 2014.
14. Kansas Department of Health and Environment. Burden of Diabetes in Kansas. Bureau of Health Promotion, KDHE; 2011.
15. Kansas Department of Health and Environment. Burden of Coronary Heart Disease and Stroke in Kansas. Kansas Heart Disease and Stroke
Program. Bureau of Health Promotion, KDHE; 2008. Available at: http://www.kdheks.gov/cardio/download/Burden_Report.pdf. http://www.kdheks.
gov/cardio/download/Burden_Report.pdf. Accessed October 27, 2014.
16. Bishaw A. Poverty 2010 and 2011. American Community Survey Briefs. U.S. Department of Commerce. Economics and Statistics Administration.
U.S. Census Bureau. Available at: http://www.census.gov/prod/2012pubs/acsbr11-01.pdf. Accessed October 28, 2014.
17. Macartney S. Child Poverty in the United States 2009 and 2010: Selected Race Groups and Hispanic Origin. American Community Survey Briefs.
U.S. Department of Commerce. Economics and Statistics Administration. U.S. Census Bureau. Available at: http://www.census.gov/prod/2011pubs/
acsbr10-05.pdf. Accessed October 28, 2014.
18. Poverty Status in the Past 12 Months. 2008-2012 American Community Survey 5-Year Estimates. Fact Finder. American Community Survey. U.S.
Census Bureau. Available at: http://factfinder2.census.gov/faces/tableservices/jsf/pages/productview.xhtml?pid=ACS_12_5YR_S1701. Accessed
October 28, 2014.
19. Income in the Past 12 Months (In 2012 Inflation-Adjusted dollars). 2008-2012 American Community Survey 5-Year Estimates. Kansas Estimates.
Fact Finder. American Community Survey. U.S. Census Bureau. Available at: http://factfinder2.census.gov/faces/tableservices/jsf/pages/
productview.xhtml?pid=ACS_12_5YR_S1901. Accessed October 28, 2014.
20. Institute for Research on Poverty. Health and Poverty. Institute for Research on Poverty website. 2014. Available at: http://irp.wisc.edu/research/
health.htm. Accessed October 28, 2014.
21. World Health Organization. Determinants of Health. Health Impact assessment website. 2014. Available at: http://www.who.int/hia/evidence/doh/
en/. Accessed October 28, 2014.
22. Driscoll AK, Berstein AB. Health and Access to Care among Employed and Unemployed Adults: United States, 2009-2010. NCHS Data Briefs.
2012;83. Available at: http://www.cdc.gov/nchs/data/databriefs/db83.htm. Accessed October 28, 2014.
23. Winkleby MA., Jatulis DE., Frank E., and Fortmann SP. Socioeconomic status and health: how education, income, and occupation contribute to risk
factors for cardiovascular disease. Am J Public Health. 1992; 82(6): 816–820.
24. Education Attainment. 2008-2012 American Community Survey 5-Year Estimates. Kansas Estimates. American Fact Finder. U.S. Census Bureau.
Available at: http://factfinder2.census.gov/faces/tableservices/jsf/pages/productview.xhtml?pid=ACS_12_5YR_S1501. Accessed October 28, 2014.
25. Robert Wood Johnson Foundation. Issue Brief 2: Housing and Health. 2008. Available at: www.commissiononhealth.org. Accessed October 28,
2014.
26. Stafford N, Chandola T, Marmot M. Association between fear of crime and mental health and physical functioning. Am J Public Health.
2007;97:2076-2081.
27. 2011 Crime Index, Kansas Bureau of Investigation.
28. McGibbon E., Etowa J., McPherson C. Health-Care Access as Social Determinant of Health. Cancer Nurse. 2008;104(7):22-7.
29. Agency for Healthcare Research and Quality. National Health Care Quality Report: 2011. Rockville, MD: U.S. Department of Health and Human
Services. Available at: http://www.ahrq.gov/research/findings/nhqrdr/nhqr11/nhqr11.pdf. Accessed October 28, 2014.
103Strengths and Assets
Strengths
Local Coalitions and Community Kansas Department of Transportation Safe
Foundations Routes to School
There are a number of local coalitions and This program provides funding and technical
foundations across the state making an impact assistance for infrastructural projects such as
on their communities. For example, Thrive Allen improvements to sidewalks, traffic calming,
County works collaboratively across organizations pedestrian and bicycle crossing, on- and off-
and sectors to find ways to improve conditions street bicycle facilities, secure bicycle parking,
that impact quality of life in Allen County (from and traffic diversions. Additional support available
building trails to recruiting health providers to for non-infrastructural activities such as public
engaging local decision makers in discussions awareness campaigns and outreach to press
on poverty causes and solutions). and community leaders, establishing walking
school buses and bike trains, traffic education
The Heartland Healthy Neighborhoods coalition and enforcement, student training on bicycle
in Topeka created a Neighborhood Health Map of and pedestrian safety, and funding for training
factors related to overall health status, including volunteers and staff. Funding is also be provided
crime, poverty, property values and boarded-up for applicants to develop safe routes to schools
houses. This map serves as a model for other plans, with the possibility of future funding to
communities. implement the plan.
Health in All Policies Approach Through Kansas State Department of Education
Health Impact Assessments (HIAs) (KSDE)
A HIA is an informational tool designed to help KSDE is working to implement key
decision-makers consider the health implications recommendations from the Kansas Education
of proposed policies, especially those that don’t Commission, U.S. Department of Education
appear to have direct connections to health. Blueprint for Reform, the Governor’s Commission
These assessments are being conducted in on Graduation and Dropout Prevention and
several communities in the state. Recovery and the Kansas P-20 Education
Council. The new strategic agenda is centered
on a flexible delivery system, effective educators,
visionary leaders and collaboration with families,
communities, constituent groups and policy
partners.
Kansas African Affairs Commission (KAAAC)
The State of African Americans in Kansas
Report released March 2012 centered on
social determinants of health and equity and
their impacts. Sectors in report: schools and
educational opportunity, economic opportunity
and asset building, criminalization and social
justice, health and safe communities, and civic
leadership and advocacy. KAAAC and more than
104335 Kansans are working to improve equity for Assets
African Americans using the State of African
●● Strong spirit of independence and self-
Americans in Kansas Report as a baseline
sufficiency among Kansans
measurement tool.
●● Relatively tight-knit communities across
KAAAC District Town Halls, known as 3 D Events, the state that can be very effective when
were held across Kansas with Commission they choose to mobilize around an issue
representatives and community leaders, inviting ●● Data resources are continuing to improve,
attendees to discover the data, dream about including those related to disparities,
what they would like their community to look like, social determinants and community
design a plan to address the equity and to issue health data (e.g., Kansas Health Matters
a call to action. 3D events held in Commission website)
Districts (March - December 2012) facilitated a
community planning process to address a priority ●● Increase in effective community and
issue based on report findings. grassroots coalitions
●● Strong, supportive health foundations
Rosedale Healthy Kids Initiative committed to addressing these and
The Healthy Kids Initiative (HKI) was formed related health issues through grant
in 2009 as a partnership between Rosedale opportunities and technical assistance
Development Association, the Rosedale (including Kansas Health Foundation,
Ministerial Alliance, KC Healthy Kids and the Sunflower Foundation and United
University of Kansas Medical Center. HKI is a Methodist Health Ministry Fund)
community effort to reduce childhood obesity in ●● Physical environment in Kansas offers
Rosedale by promoting healthy, active lifestyles many opportunities to be physically active,
for all residents. including an expanding trail system
Kansas Department of Commerce Office of ●● Committed, knowledgeable, well-
Minority and Women Business Development intentioned professionals
This office promotes business development
with a focus on minority- and women-owned
businesses. Information and referrals are
provided in the areas of procurement, contracting
and subcontracting, financing, and business
management. The office also partners with
other business advocates to sponsor business
education workshops and seminars.
105You can also read