SGX-REITAS Webinar 8 September 2020 - Keppel Pacific Oak
←
→
Page content transcription
If your browser does not render page correctly, please read the page content below
SGX-REITAS Webinar 8 September 2020
Important Notice
The past performance of Keppel Pacific Oak US REIT is not necessarily indicative of its future performance.
Certain statements made in this release may not be based on historical information or facts and may be
“forward-looking” statements due to a number of risks, uncertainties and assumptions. Representative             Content Outline
examples of these factors include (without limitation) general industry and economic conditions, interest
rate trends, cost of capital and capital availability, competition from similar developments, shifts in
expected levels of property rental income, changes in operating expenses, including employee wages,              Page 3    Overview
benefits and training, property expenses and governmental and public policy changes, and the continued           Page 13   Operational Updates
availability of financing in the amounts and terms necessary to support future business.
Prospective investors and unitholders of Keppel Pacific Oak US REIT (Unitholders) are cautioned not to           Page 18   Market Outlook
place undue reliance on these forward-looking statements, which are based on the current view of Keppel
Pacific Oak US REIT Management Pte. Ltd., as manager of Keppel Pacific Oak US REIT (the Manager) on              Page 26   Additional Information
future events. No representation or warranty, express or implied, is made as to, and no reliance should be
placed on, the fairness, accuracy, completeness or correctness of the information, or opinions contained in
this release. None of the Manager, the trustee of Keppel Pacific Oak US REIT or any of their respective
advisors, representatives or agents shall have any responsibility or liability whatsoever (for negligence or
otherwise) for any loss howsoever arising from any use of this release or its contents or otherwise arising in
connection with this release. The information set out herein may be subject to updating, completion,
revision, verification and amendment and such information may change materially. The value of units in
Keppel Pacific Oak US REIT (Units) and the income derived from them may fall as well as rise. Units are not
obligations of, deposits in, or guaranteed by, the Manager or any of its affiliates. An investment in Units is
subject to investment risks, including possible loss of principal amount invested.
Investors have no right to request the Manager to redeem their Units while the Units are listed. It is
intended that Unitholders may only deal in their Units through trading on Singapore Exchange Securities
Trading Limited (SGX-ST). Listing of the Units on SGX-ST does not guarantee a liquid market for the Units.

                                                                                                                                                    2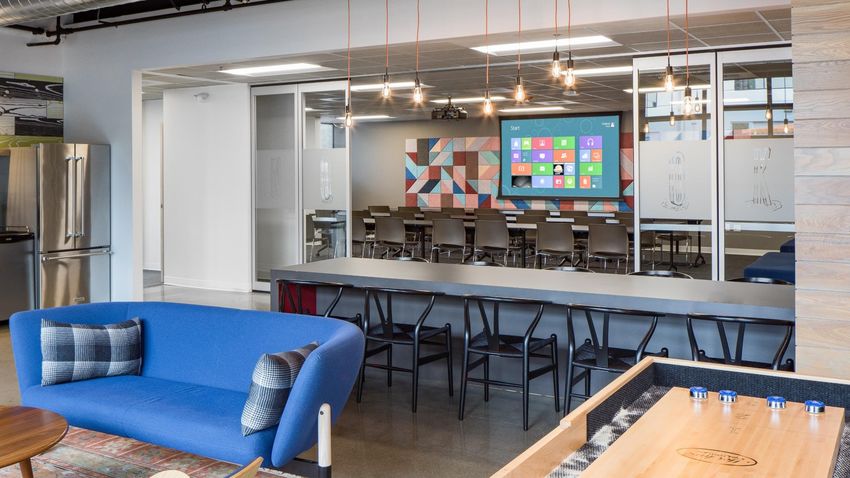
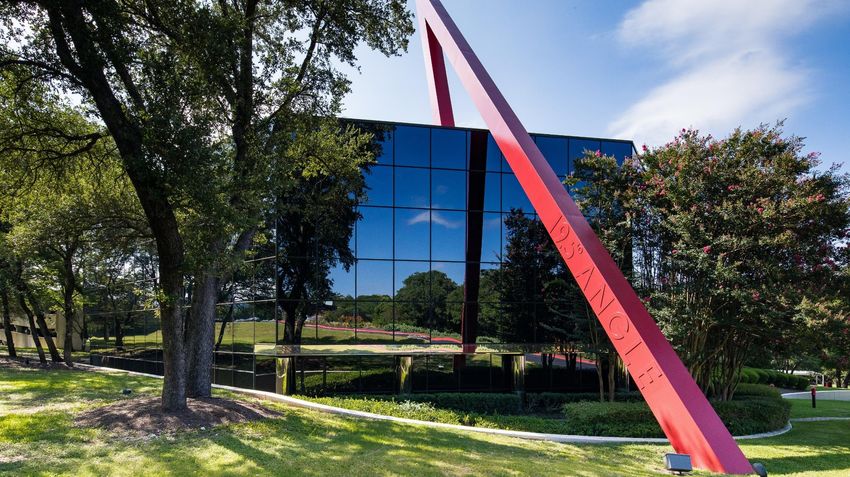
Overview

Tenant lounge
The Westpark Portfolio
Seattle, Washington
Benefitting from
                                                                 Unique exposure
                                                                                             solid US office             Tax advantaged
                                                                 to key US
                                                                                             real estate                 structure
                                                                 growth markets
                                                                                             fundamentals

                                                                 Sponsors              ▪ Keppel Capital and KPA

                                                                 US Asset Manager      ▪ Pacific Oak Capital Advisors LLC, also advisor for
Tenant lounge, Bellevue Technology Center, Seattle, Washington                           Pacific Oak Strategic Opportunity REIT

About Keppel Pacific Oak                                         Manager               ▪ Keppel Pacific Oak US REIT Management Pte. Ltd.
US REIT (KORE)                                                   Investment            ▪ To invest in a diversified portfolio of income-producing
                                                                 mandate                 commercial assets and real estate-related assets in
  Distinctive US office REIT focused on                                                  key growth markets of the US with favourable
  key growth markets with positive economic                                              economic and office fundamentals
  and office fundamentals that generally
                                                                 Distribution Policy   ▪ Semi-annual distributions
  outpace that of the US national average,                       & Distribution        ▪ Distributions declared in US dollars
  as well as the average of the gateway cities                   Currency

                                                                                                                                              4
Growth Trajectory since IPO
                                                                                                                                              Delivered Growth since IPO
                                                                      Strengthened
                                                                      Foothold in the
         Listed on SGX
                                                                                                                                              Distributable Income (US$ million)
                                                                      Strong Maitland
         Portfolio value: US$0.83b                                    submarket
         IPO with 11 office buildings                                 Maitland                                                                                50.8
         & business campuses                                          Promenade 1                                                             38.6
                                                                                                                                                              26.0
         across 7 key growth                                          Orlando, Florida                                                         19.7
         markets
                                                                                                                                                              24.8           29.1
                                                                                                                                              18.9
           Dec 2017                     Jan 2019                                                                                             FY 2018         FY 2019       1H 2020

9 Nov 2017                   Nov 2018              Nov 2019                                  30 Jun 2020                                                      1H      2H
                                                                                             Portfolio value: US$1.27b
                                                                                             13 office buildings &
                                                                                             business campuses across
                                                                                                                                                          DPU (US Cents)
                                                                                             8 key growth markets                                              6.01

                                                                                                                                Axis Title
                                                                                                                                               4.58
                                                                                  Extended                                                                     3.01
               Maiden                                                             Footprint into                                               2.34
           Acquisition                                                            new key Growth
                                                                                                                                               2.24            3.00          3.10
         The Westpark                                                             Market
              Portfolio                                                           One Twenty Five
   Seattle, Washington                                                            Dallas, Texas                                              Adjusted
                                                                                                                                              FY 2018         FY 2019       1H 2020
                                                                                                                                             FY 2018(1)      Axis Title
                                                                                                                                                              1H 2H

                                        1) Adjusted Actual FY 2018 was calculated based on the weighted average number of Units for FY 2019                                     5
                                           of 843,917,481 Units to remove the effects of the enlarged Unit base in FY 2019 for comparison purpose.
First Choice Submarkets in Key Growth Markets
SEATTLE, Washington                                             ATLANTA, Georgia

                                                                                                               Overview
                                                                                                               13 freehold office buildings
                                                               Powers Ferry            Northridge
The Plaza           Bellevue Technology The Westpark                                                           and business campuses
Buildings           Center              Portfolio              Occupancy: 93.8%        Center I & II
                    Occupancy: 100.0%                                                  Occupancy: 85.8%        across 8 key growth markets
Occupancy: 97.3%                        Occupancy: 97.2%

DENVER, Colorado                                                                   ORLANDO, Florida
                                                                                                               Portfolio NLA
                                                                                                               Over 4.7 million sf

Westmoor Center                                                                    Maitland Promenade I & II   Portfolio Value
Occupancy: 96.6%                                                                   Occupancy: 95.0%            US$1.27 billion
SACRAMENTO, California                                                             DALLAS, Texas

                                                                                                               Portfolio Committed
                                                                                                               Occupancy (by NLA)
Iron Point
Occupancy: 99.5%                                                                   One Twenty Five             94.3%
                                                                                   Occupancy: 96.7%
    AUSTIN, Texas                                      HOUSTON, Texas

    Great Hills Plaza    Westech 360                   1800 West Loop South Bellaire Park
    Occupancy: 99.1%     Occupancy: 90.8%              Occupancy: 76.9%     Occupancy: 90.8%                   All information as at 30 June 2020.

                                                                                                                                                     6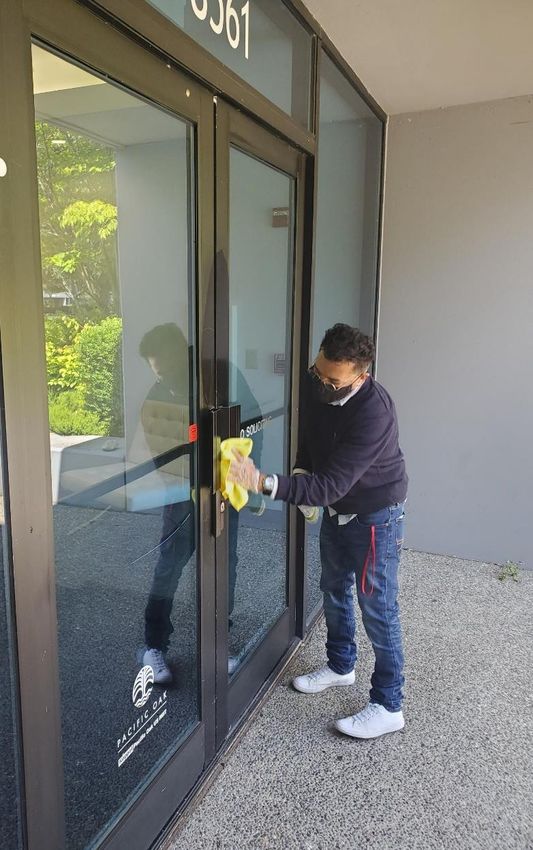
KORE Strengths
                                                                                                                                      Index
                                                                                                                                      inclusion
                                                                           Strong                                                     will improve
                                                                           rental                                                     trading
Presence in                                                                reversion                             Stable
first choice                     100%                                                                            portfolio            liquidity
                                                                           of 14.7%
submarkets in Highly             unsecured                                                                       committed
key growth                       debt                                                                            occupancy            Constituent to the
                  diversified                                              Strong average                                             MSCI Singapore
markets                                                                    rental reversion
                  portfolio with Weighted average                                                                Healthy committed Small Cap Index
                                                                           across the portfolio,
Exposure to       low tenant     term to maturity of                       supported by                          occupancy of         and the FTSE All
                                                                                                                                      World Small Cap
growth and        concentration 3.4 years(1) with                          continued leasing                     94.3% and WALE
defensive sectors risk           no long-term                              demand and rent                       of 4.1 years by CRI. Index, which will
of technology and                       refinancing                                                                                   raise visibility
                                                                           growth across the
healthcare which    Top 10 tenants      requirements until                                                                            among investors
                                                                           key growth markets.
comprise 37.6% of   contribute only     November 2022.                                                                                and enhance
                    19.5% of portfolio                                                                                                trading liquidity.
portfolio NLA.
                    cash rental income.

                                      All information as at 30 June 2020.
                                      (1) Assuming the refinancing of borrowings had occurred on 30 June 2020.
                                                                                                                                                 7
Resilient and Highly Diversified Portfolio
          KORE’s buildings and business campuses in             Highly diversified tenant base, with exposure to
          the tech hubs of Seattle, Austin and Denver           the growth and defensive sectors of technology,
          contribute ~54% of CRI                                as well as medical and healthcare

Geographic Diversification by CRI contribution          Industry Diversification by NLA
as at 30 June 2020                                      as at 30 June 2020
                         Atlanta                              Technology
                          5.7%                                    28.9%                              Professional
      Orlando
                                            Seattle                                                  Services
        11.2%
                                            38.9%                                                    27.9%

      Dallas
      10.7%

                                                             Medical and
     Houston                                                  Healthcare
       13.1%                                                        8.7%
                                           Denver
                                           9.5%                  Media and                          Finance and
      Sacramento
                           Austin                              Information      Others              Insurance
            5.0%
                           5.9%                                       3.1%       9.9%               21.5%

                                                                                                                    8
Low Tenant Concentration Risk
 Top 10 tenants contribute only 19.5% of CRI, with the largest tenant only contributing 3.5% of CRI

Top 10 tenants as at 30 June 2020
Tenant                              Sector                                     Asset                           % CRI
Ball Aerospace                      Technology                                 Westmoor Center                   3.5
Oculus VR                           Technology                                 Westpark Portfolio                2.4
Lear                                Technology                                 The Plaza Buildings                2.1
Zimmer Biomet Spine                 Technology                                 Westmoor Center                   2.0
Spectrum                            Media & Information                        Maitland Promenade I               1.8
Unigard Insurance(1)                Finance & Insurance                        Bellevue Technology Center         1.7
Bio-Medical Applications            Medical & Healthcare                       One Twenty Five                    1.7
US Bank                             Finance & Insurance                        The Plaza Buildings                1.6
Auth0                               Technology                                 The Plaza Buildings                1.4
Reed Group                          Technology                                 Westmoor Center                    1.3
Total                                                                                                            19.5
WALE (by NLA)                                                                                               5.0 years
WALE (by CRI)                                                                                               5.2 years
                                       1) Subsidiary of QBE Insurance Group.
                                                                                                                   9
Positive Economics and Rising Employment
KORE’s key growth markets continue to outperform national average
          5.4%                              Real GDP Growth Average(1) 2014-2018                                                                            5.6%
                            Key Growth Markets                5.0%                                                        Gateway Cities
                              4.0%
4.0%               3.9%                               4.1%           3.7%
                                                                                                                                                                            3.9%
                                                                                                                               3.2%
                                                                                                  2.9%
                                                                                                                                                                            2.8%
                                                                                                                                              1.8%                      1.9%2.5%
                                                                                                                1.6%
                                         1.2%

Atlanta   Austin   Dallas     Denver    Houston      Orlando     Sacramento       Seattle        Boston        Chicago          Los         New York         San      Washington
                                                Employment Growth Average(2) 2015-2019                                        Angeles                     Francisco      DC

                                                      3.8%
          3.4%
                   2.9%                                              2.7%          2.8%                                                                     2.7%
2.4%                           2.4%                                                                                                                                         2.7%
                                                                                                  1.6%                         1.8%           1.5%                      1.5%
                                         1.4%                                                                                                                                  1.7%
                                                                                                                1.2%                                                           1.6%

Atlanta   Austin   Dallas     Denver    Houston      Orlando     Sacramento       Seattle        Boston        Chicago          Los         New York         San      Washington
                                                                                                                              Angeles                     Francisco      DC
                       Market Average           United States Average                Key Growth Markets Average                    Gateway Cities Average
                                             Note: Gateway cities average is based on Boston, Chicago, Los Angeles, New York, San Francisco and Washington DC.             10
                                             (1) US Bureau of Economic Analysis.
                                             (2) US Bureau of Labor Statistics.
Low Taxes in KORE’s Key Growth Markets
Individuals and corporations are moving to states with zero or low income and corporate taxes, accelerating population growth
State Individual Tax Rates (as at July 1, 2019)(1)
13.30% 13.30%
Key Growth Markets Gateway Markets
10.75%
8.82% 8.95%
6.99% 8.40%
5.75% 5.05%
4.95%
4.63% 5.48%
3.95%
0.00% 0.00% 0.00%
Colorado Florida Georgia Texas Washington California
California(2) California
California(2) Connecticut Illinois Massachusetts New Jersey New York Washington…
State Corporate Income Tax Rates (as at July 1, 2019)(1) 11.50%
9.50%
8.84% 8.84%
8.00% 8.25%
6.99%
6.50% 8.51%
5.75%
5.50%
4.63% 6.25%
4.12%
0.00% 0.00%
Colorado Florida Georgia Texas
Texas(3) Washington
Washington(3) California
California(3) California
California(3)
Connecticut Illinois Massachusetts New Jersey New York Washington
State Corprate Income Tax Rates United States Average Key Growth Markets Average Gateway Cities Average DC
(1) Tax Foundation’s 2020 State Business Tax Climate Index, based on top marginal individual income tax rates. 11
(2) The state of California encompasses the key growth city of Sacramento and the gateway cities of Los Angeles and San Francisco.
(3) Texas and Washington do not have a corporate income tax but do have a gross receipts tax.Expanding Population in KORE’s Key Growth Markets
KORE’s key growth markets continue to outperform national average
2.8%
Population Growth Average(1)
2015-2019
Key Growth Markets 2.3% Gateway Cities
1.9%
1.7% 1.6%
1.8%
1.5%
1.5%
1.1%
0.8%
0.5% 0.6%
0.6%
0.1% 0.3%
-0.2% -0.1%
Atlanta Austin Dallas Denver Houston Orlando Sacramento Seattle Boston Chicago Los New York San Washington
Angeles Francisco DC
Market Average United States Average Key Growth Markets Average Gateway Cities Average
Note: Gateway cities average is based on Boston, Chicago, Los Angeles, New York, San Francisco and Washington DC. 12
(1) US Census Bureau.Operational Updates Enhanced health and safety protocols across KORE’s properties
1H 2020 Results Highlights
Continued Growth                                       Stable                                                                    Robust
in Operating Income                                    Income Stream                                                             Financial Position
Distributable Income                                   Strong                                                                    Early Refinanced
US$29.1 mil                                            Rental Reversion                                                          All 2021 Loans

   17.6% YoY                                                 14.7%                                                               3.4 years                      (3)
                                                                                                                                                                      in WATM

DI of US$29.1 million for 1H 2020 was 17.6%            Continued positive rental reversions                                      Actual WATM was 2.5 years as at
higher y-o-y, driven by contributions from             for the whole portfolio, driven mainly by                                 30 June 2020. Assuming the refinancing
One Twenty Five(1) and higher rental income            the tech hubs of Seattle and Austin.                                      of remaining loans due in 2021 is effective
from the rest of the portfolio. Average rent                                                                                     on 30 June 2020, WATM would be
collection for 1H 2020 was ~98%.(2)                                                                                              extended to 3.4 years(3).

Distribution per Unit                                  Limited                                                                   Low
3.10 US cents                                          Lease Expiries by CRI                                                     Aggregate Leverage

   3.3% YoY                                            2.8%                                                                      37.4%                (4)

1H 2020 DPU was 3.3% above 1H 2019 DPU.                Leased ~196,000 sf of space in 1H 2020,                                   Low leverage and 100% unsecured loans
Distribution yield was 8.9%, based on the              equivalent to 4.2% of the portfolio.                                      provide financial flexibility to pursue
market closing price of US$0.700 per Unit              Portfolio committed occupancy was                                         opportunities in key growth markets
as at 30 June 2020.                                    94.3%, and only 2.8% of leases expiring                                   across the US.
                                                       over the rest of 2020.
                                        (1)   The acquisition of One Twenty Five in Dallas, Texas, was completed in November 2019.
                                        (2)   Updated as at 19 August 2020.                                                                                                     14
                                        (3)   Weighted average term to maturity (WATM) on a pro forma basis, had the refinancing of the borrowings occurred on 30 June 2020.
                                        (4)   Calculated as the total borrowings and deferred payments (if any) as a percentage of the total assets.
Portfolio Performance
• Committed total of ~196,000 sf of space in 1H 2020
• Equivalent to 4.2% of portfolio NLA, and mainly in Seattle, Atlanta and Houston
• Achieved strong rental reversion of 14.7% for the whole portfolio
• Rental collections for April, May and June 2020 were ~98%, ~96% and ~93% respectively(1)
• Average rental collections for 2Q 2020 was ~96%, and for 1H 2020 was ~98%(1)
• Committed portfolio occupancy was 94.3%(2) and portfolio WALE was 4.1 years(3) as at 30 June 2020
• 2.6% built-in average annual rent escalations
Lease Expiry Profile as at 30 June 2020 Leases Signed in 1H 2020
NLA CRI 41.8% 41.5%
Expansions
Limited leases 17.4% New
expiring for 35.3%
the remainder
of 2020
17.9% 17.2%
15.0% 14.7% 13.2%
11.1% 10.6% 11.0%
3.2% 2.8% Renewals
47.3%
2020 2021 2022 2023 2024 2025 andand
2025 beyond
1) Updated as at 19 August 2020. beyond
2) By NLA.
15
3) By CRI. Based on NLA, portfolio WALE was 4.0 years.Navigating the COVID-19 Pandemic & Facilitating the Safe Return to Offices ✓ Income resilience and operational excellence • Healthy rent collections of ~100% in 1Q 2020 and ~96% in 2Q 2020(1) • Minimal exposure to retail (
The Essential but Ever Changing Office
Potential Office Paradigm Shifts
• Higher levels of remote working and a gradual transition to a more ✓ KORE is well-positioned to benefit
flexible working culture from the shift towards well-connected
- Employees welcome the flexibility to work from home, but still suburbs
desire to be in office for the majority of the week(1)
- Physical offices remain important for social interaction, collaboration, ✓ Distinct portfolio lends itself well to
innovation, talent attraction and retention the additional spatial requirements
as businesses de-densify
• De-densification of existing space for health safety measures and
future-proofing their space ✓ Strategic exposure to the fast-
• Increased emphasis on flexible lease tenures and adaptable spaces expanding tech hubs provides further
as tenants re-evaluate their space needs income resilience as businesses
accelerate their digital transformation
Potential Impact on Office Demand
✓ Quality lifestyle amenities and
• Health and safety concerns around mass transit and high density
collaborative spaces remain highly
urban cores could see businesses decentralise away from downtown valued by office workers
CBD locations
• De-densification and higher sf per worker to offset higher levels ✓ Tenants reassured by transparent
of remote working communications and proactive
• Cyclical downturn triggered by COVID-19 will impact short-term engagements.
demand for office space
(1) Gensler U.S. Work from Home survey 2020.
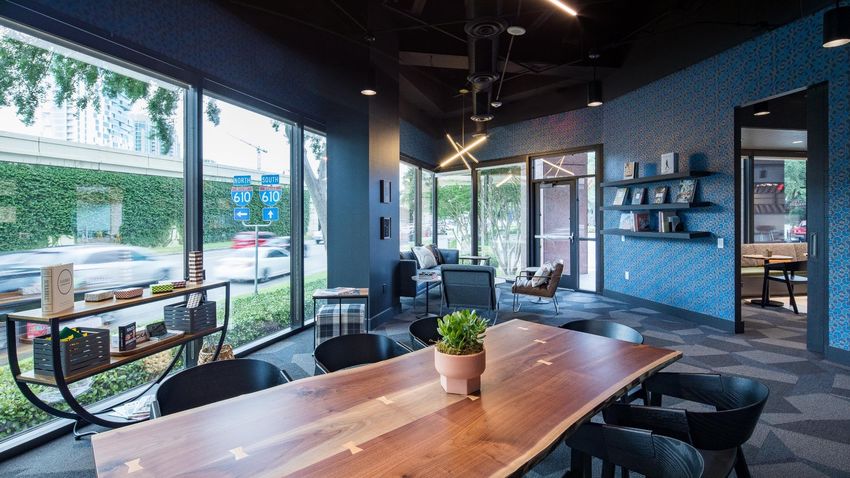
Sources: Cushman & Wakefield, The Future of Workplace 2020; JLL Research, Future of Global Office Demand, June 2020. 17Market Outlook Tenant lounge, 1800 West Loop South Houston, Texas
US Economy at a Glance
% GDP Growth % Labour Force Participation
5 67
0 66
-5 65
-10 64
-15 63
-20 62
-25 61
-30 60
-35 59
2015
2016
2017
2018
2019
1Q 2020
2Q 2020
Feb-15
Jul-07
Jan-14
Mar-16
Jul-20
Dec-12
Apr-17
Aug-08
Nov-11
Oct-10
Sep-09
May-18
Jun-19
Great Hills Plaza, Austin, Texas (1)
GDP Growth Labour Force Participation Rate (2)
-31.7% 10.2% • US unemployment rate improved for the third straight month from 14.7%
in April 2020 to 10.2% in July 2020
Real GDP growth Unemployment rate • Continued economic support from the US government:
in 2Q 2020(1) in July 2020(2)
• Ratification of Coronavirus Aid, Relief and Economic Security Act
+4.8% +1.8m • US$2 trillion stimulus package to US businesses, families and local governments
• Business and employment support through the Paycheck Protection Program
Average hourly Jobs added in
• Labour force participation rate in the US stands at 61.4% in July 2020(2),
earnings y-o-y(2) July 2020(2)
with 7.7 million persons seeking jobs
(1) Source: U.S. Bureau of Economic Analysis, August 2020.
19
(2) Source: U.S. Bureau of Labor Statistics, July 2020.Technology – A Key Driver of US Growth and Employment
Ranking of Top 10 US Occupation Jobs Added During Decade, 2010-2019
Food Preparation and Serving 2,419,416
QCEW + self-employed*
Personal Care and Services 2,179,869
Transportation and Material Moving 1,972,500
2-digit SOCs
Tech 1,808,837
Management 1,762,494
Business and Financial 1,713,068
Healthcare 1,555,318
Sales and Related 917,795
Installation, Maintainence and Repair 722,330
Lobby, The Plaza Buildings, Seattle, Washington Production 715,983
Ranking of Top 10 US Industry Sectors Gross Product (Economic Impact),
Over 28% of KORE’s tenants Manufacturing $2,381
are from the historically fast Government
Tech Industry $1,879
$2,336
growing tech sector Finance and Insurance $1,745
US$ billion Professional, Scientific, and Tech Scvs $1,591
Health Care and Social Assistance $1,563
Estimated direct contribution Wholesale Trade $1,234
10% of the tech sector to the
US economy
Retail Trade
Information
$1,126
$1,100
Construction $867
Source: CompTIA’s Cyberstates 2020 report. 20
*Refers to the 2 digit Standard Occupational Classification (SOC) system in the Bureau of Labor Statistics’ Quarterly
Census of Employment and Wages (QCEW).First Choice Submarkets Outlook
Property Submarket Last 12M Last 12M Average Last 12M Projected
Submarket Vacancy Rate Vacancy Rate Deliveries Absorption Submarket Rent Rental Growth Rental Growth
Property (%) (%) (sf’000) (sf’000) (US$ p.a.) (%) (%)
Seattle, Bellevue CBD
2.7 4.3 - (31.4) 53.9 2.8 (4.9)
The Plaza Buildings
Seattle, Eastside
Bellevue Technology 0.0 4.5 537.0 515.0 39.7 5.3 (2.5)
Center
Seattle, Redmond
2.8 3.0 - 111.0 35.2(1) 3.2 (4.7)
The Westpark Portfolio
Denver, Northwest
3.4 8.7 5.0 164.0 23.2 2.9 (5.3)
Westmoor Center
Austin, Northwest
0.9(2) / 9.2(3) 16.8 47.0 (1,300.0) 37.5 2.7 (7.0)
Great Hills & Westech 360
Houston, Galleria/Uptown
23.1 16.7 - (208.0) 31.3 (2.2) (8.4)
1800 West Loop South
Houston, Galleria/Bellaire
9.2 15.0 4.9 (17.9) 25.5 0.7 (6.6)
Bellaire Park (4)
Dallas, Las Colinas
3.3 19.7 - (277.0) 29.0 0.7 (7.4)
One Twenty Five
Orlando, Maitland
5.0 9.5 - (30.8) 23.4 2.2 (6.2)
Maitland Promenade I & II
Sacramento, Folsom
0.5 4.0 5.2 82.2 27.4 4.7 (2.8)
Iron Point
Atlanta, Cumberland/I-75
6.2 13.6 - 191.0 26.0 3.9 (4.3)
Powers Ferry
Atlanta, Central Perimeter
14.2 15.4 1,000.0 670.0 29.2 2.3 (5.6)
Northridge I & II
Source: CoStar Office Report, 2 July 2020.
(1) Refers to average submarket office rent. (3) Refers to Westech 360’s vacancy.
21
(2) Refers to Great Hills Plaza’s vacancy. (4) Previously known as West Loop I & II.Last 12 Months Rent Growth
Key Growth Markets Gateway Cities
5.3%
4.7%
3.9%
3.2% 2.9% 2.6%
2.8% 2.7% 2.1% 2.1%
2.3% 2.2%
2.4%
0.7% 0.7% 0.7%
1.4%
1.1%
0.3%
-1.3%
-2.2%
Last 12M Rental Growth Key Growth Markets Average Gateway Cities Average United States Average
Source: CoStar Office Report, 2 July 2020. 22Projected 12-Month Rent Outlook
KORE’s in-place rents are on average, 10.8% below asking rents
Key Growth Markets Gateway Cities
-2.5%
-2.8%
-4.3%
-4.9% -4.7% -5.5%
-6.0%
-6.1%
-5.3% -5.6% -6.2% -5.4% -5.0% -5.1% -6.3%
-6.6%
-7.0%
-7.4% -7.4% -7.4%
-8.4%
Projected Rental Growth Key Growth Markets Average Gateway Cities Average United States Average
Source: CoStar Office Report, 2 July 2020. 23Strategically-located assets in key growth markets
Constituent of:
Highly diversified portfolio with tenants from high growth
and defensive sectors • MSCI Singapore
Small Cap Index
Committed Income resilience supported by low tenant concentration
and strong tenant mix
to Deliver
Long-Term • FTSE All World
Organic growth supported by well-structured leases, built-in annual
Value rental escalations and positive rental reversions Small Cap Index
Strong balance sheet and liquidity position with 100% unsecured debt
and no long-term refinancing requirement until November 2022
Strong and committed sponsors; and a stable and experienced
management team
24Thank You For more information, please visit www.koreusreit.com Connect with us on: Westech 360 Austin, Texas
Additional
Information

Tenant space,
Westmoor Center
Denver, Colorado
Trust Structure
                   Tax-efficient structure for holding US properties
                   ▪    No US corporate tax (21%) and
                        US withholding tax (30%)
                   ▪    No Singapore corporate tax (17%) and
                        Singapore withholding tax (10%)
                   ▪    Subject to limited tax(2)

                   Leverage Sponsors' expertise and resources
                   to optimise returns for Unitholders

                   Alignment of interests among Sponsors,
                   Manager and Unitholders

                  (1)   Keppel Capital holds a deemed 6.8% stake in Keppel Pacific Oak US REIT
                        (KORE). Pacific Oak Strategic Opportunity REIT, Inc. (KPA entity) holds a
                        6.8% stake in KORE. KPA holds a deemed interest of 1.0% in KORE, for a
                        total of 7.8%.
                  (2)   KORE has implemented the restructuring to revert to the structure it used
                        when it was initially listed. The Barbados corporate taxes will cease w.e.f.
                        from 16 April 2020. There are three wholly-owned Singapore Intercompany
                        Loans Subsidiaries extending intercompany loans to the Parent US REIT.

                  Information as at 20 August 2020. Unitholding in KORE is subject to an ownership
                  restriction of 9.8% of the total Units outstanding.

                                                                                                       27
Financial Performance for 2Q & 1H 2020
2Q 2020 2Q 2019 % 1H 2020 1H 2019 %
(US$’000) (US$’000) Change (US$’000) (US$’000) Change
Gross Revenue 35,174 29,280 20.1 70,500 58,724 20.1
Property Expenses (14,253) (11,292) 26.2 (28,628) (22,548) 27.0
Net Property
Income 20,921 17,988 16.3 41,872 36,176 15.7
Tenant lounge, The Westpark Portfolio , Seattle,
Washington
Income Available
14,697 12,404 18.5 29,109 24,758 17.6
• 17.6% YoY increase to for Distribution(1)
distributable income DPU (US cents) 1.56 1.50 4.0 3.10 3.00 3.3
• Driven by contributions from
One Twenty Five and higher Distribution Yield(2) - - - 8.9% 7.9% 100 bps
rental income from the rest (1) The income available for distribution to Unitholders is based on 100% of the taxable income available for distribution to Unitholders.
of the portfolio (2) The annualised distribution yield for 1H 2020 is on a basis of 182 days and pro-rated to 366 days (1H 2019: 365 days). Distribution yields for
1H 2020 and 1H 2019 are based on market closing prices of US$0.700 and US$0.765 per Unit as at last trading day of the respective periods.
28Capital Management
Low aggregate leverage and 100% unsecured loans provide greater financial flexibility
As at 30 June 2020 Debt Maturity Profile
Total Debt • US$500.4 million of external loans
• 100% unsecured 100% of Loans Unsecured
28.9%
Committed Available • US$55.0 million of (1) 22.9% 24.0%
Facilities committed revolving credit facility 8.2% Due
Nov 2021
16.0%
• US$9.0 million of
uncommitted revolving credit facility 2020 2021 2022 2023 2024
Aggregate Leverage(2) 37.4% Interest Rate Exposure
All-in Average Floating Sensitivity to LIBOR(5)
3.34% p.a.
Cost of Debt(3) Debt
15.7% Every + 50bps in LIBOR
Interest Coverage(4) 4.4 times
translates to - 0.060 US
Fixed Debt
Average Term to cents in DPU p.a.
2.5 years 84.3%
Maturity
1) Refers to the US$41 million uncommitted revolving credit facility drawn.
2) Calculated as the total borrowings and deferred payments (if any) as a percentage of the total assets.
3) Includes amortisation of upfront debt financing costs.
4) Interest Coverage Ratio (ICR) disclosed above is computed based on the definition set out in Appendix 6 of the Code on Collective
Investment Schemes revised on 16 April 2020. After adjusting for management fees taken in Units, the ICR would be 4.7 times. 29
5) Based on the 15.7% floating debt, US$41 million revolving credit facility drawn which are unhedged and the total number of Units in issue
as at 30 June 2020.Capital Management (cont’d)
• In July 2020, KORE announced the early refinancing of borrowings due in November 2021
• Loans obtained during the Initial Public Offering in November 2017
• Restructured the interest rate swap in relation to these borrowings
• No long term refinancing requirement until November 2022
• Below are the pro formas of all-in average cost of debt, average term to maturity and debt maturity profile after the
refinancing of the borrowings and the restructuring of the interest rate swap
As at 30 June 2020 (Pro forma) Debt Maturity Profile (Pro forma)
100% of Loans Unsecured
All-in Average Cost of Debt(1) 3.19% p.a. Early refinanced 100% of expiring loans in 2021
28.9%
Average Term to Maturity(2) 3.4 years Due
Nov 2022 24.0% 22.9%
22.9%
(1) Assuming the refinancing of borrowings and restructuring 16.6%
of the interest rate swap had occurred on 1 January 2020. Due Nov 2021
(2) Assuming the refinancing of borrowings had occurred on 8.2%
30 June 2020. 23.9%
2020 2021 2022 2023 2024 2025
30Healthy Balance Sheet
As at 30 June 2020 US$’000
Total Assets 1,337,395
Investment Properties 1,272,936
Cash and Cash Equivalents 58,620
Other Assets 5,839
Total Liabilities 582,231
Gross Borrowings 500,440
Other Liabilities 81,791
Unitholders’ Funds 755,164
Units in issue and to be issued (‘000)(1) 941,052
NAV per Unit (US$) 0.800
Adjusted NAV per Unit (US$)(2) 0.770
Atrium at Great Hills Plaza, Austin, Texas Unit Price (US$) 0.700
(1) Includes management fees in Units to be issued for 2Q 2020. 31
(2) Excludes income available for distribution.You can also read