TRANSIT AND TRANSIT ORIENTED DEVELOPMENT: TO SHAPE OR TO SERVE? - ULI Triangle Dena Belzer
←
→
Page content transcription
If your browser does not render page correctly, please read the page content below

TRANSIT AND TRANSIT
ORIENTED DEVELOPMENT: TO
SHAPE OR TO SERVE?
        ULI Triangle

                   Dena Belzer
                   June 3, 2015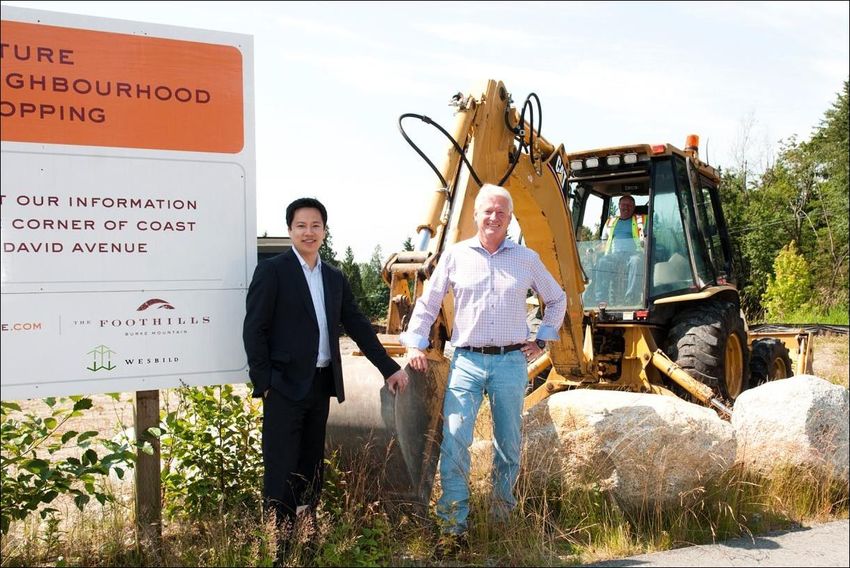
Presentation Overview
1. Linking Transit and Development
2. The Value Transit and TOD Create
3. Emerging Lessons Learned From Transit
   and TOD
4. Concluding Thoughts
Linking Transit and Development
Transit Ridership is Highly
Dependent on Land Use Patterns
Development Near Transit – Transit
Oriented Development (TOD)
Development located within ¼ to ½ mile of a
frequent transit station/stop (really a district)
Located in an area where it is also easy to
bike/walk
Serves as an “origin”, a “destination,” or both for
the transit system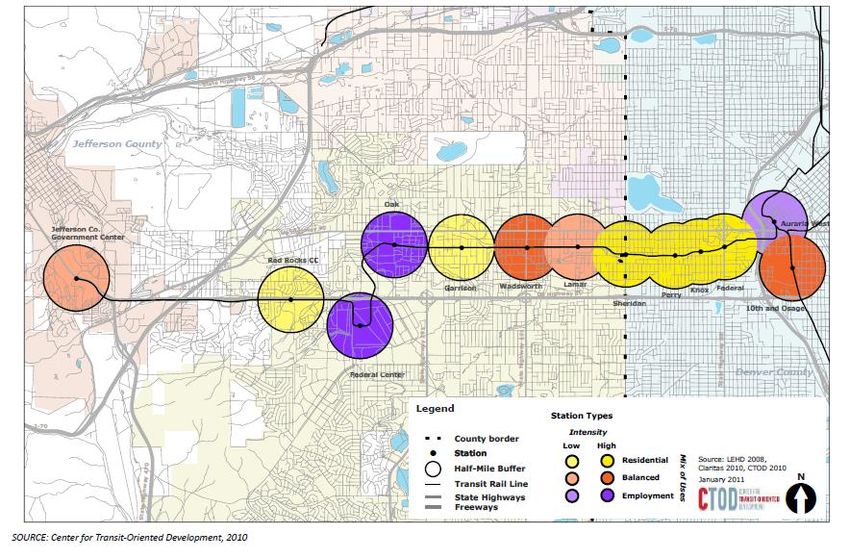
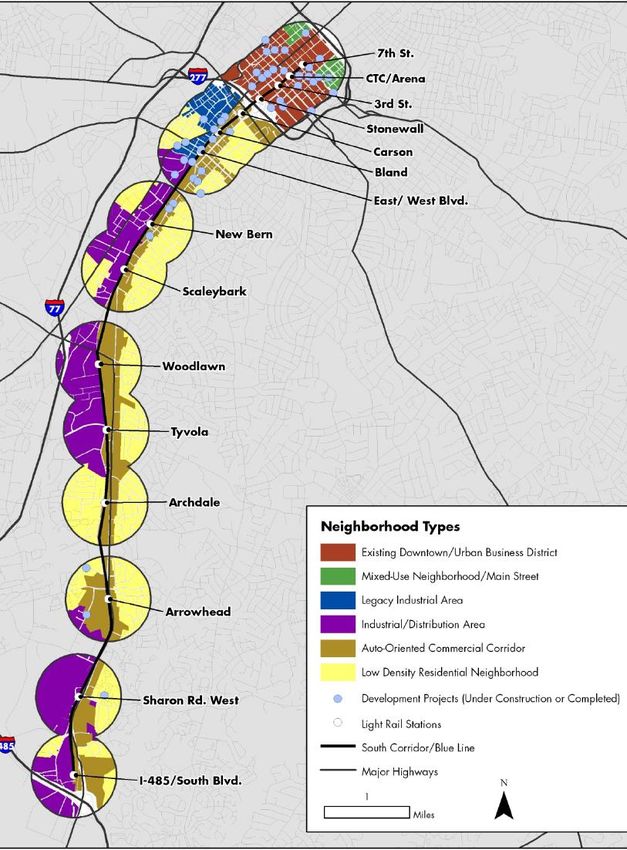
There Is No Single Transit or
Building Type in TOD
Transit Corridors Reflect the Range of Land uses and
Densities – It’s the Connections that Count!

Employment Destinations Are Essential to
Transit Because Commuters Ride Transit

             Total Trips                                     Transit Trips
                  Other

             School/                                         Other
             Church
                                                  Personal

      Work
                            Personal            Social/
                                              Recreational
                                                                     Work

           Social/                              School
         Recreational

     • By a wide margin, the largest group of transit trips are commute trips
     • Commuters are key to transit’s productivity
     Source: Pisarski, Commuting in America

 8
Any Transit That Supports Successful TOD is: 1. High quality Frequent Clean and Comfortable Fast 2. Stops/stations that are easily accessible by biking or walking 3. Connected to employment centers/activity centers and major institutions
The Value Transit and TOD Create
Location   and Access
      Transportation      st       toeconomy
                     and a 21 century  Transit
Save Households Money
Proximity to Transit Increases Property
Values
16.0%
14.0%
BART Proximity Premium
(single family homes)
12.0% 10.7%
10.0% 9.6%
8.0%
6.0% 5.4%
4.6%
4.0%
2.0%
0.0%
Within 1/2 mile 1/2 to 1 mile 1 to 2 miles 2 to 5 miles
Network Distance to Nearest BART Station
Source: Strategic EconomicsCompact Development, Like TOD, Lowers Capital
and Operating Costs for Municipalities
Calgary, Alberta
Capital Costs Operating Costs
32% savings
Schools 13% savings
Recreation Centers
Fire Stations
Water and Wastewater
Transit
Roadways
Development Scenario: Dispersed Compact Dispersed Compact
Source: IBI – Implications Of Alternative Growth Patterns On Infrastructure Costs, Plan-It Calgary, City of Calgary,
2008Emerging Lessons Learned from Transit and TOD
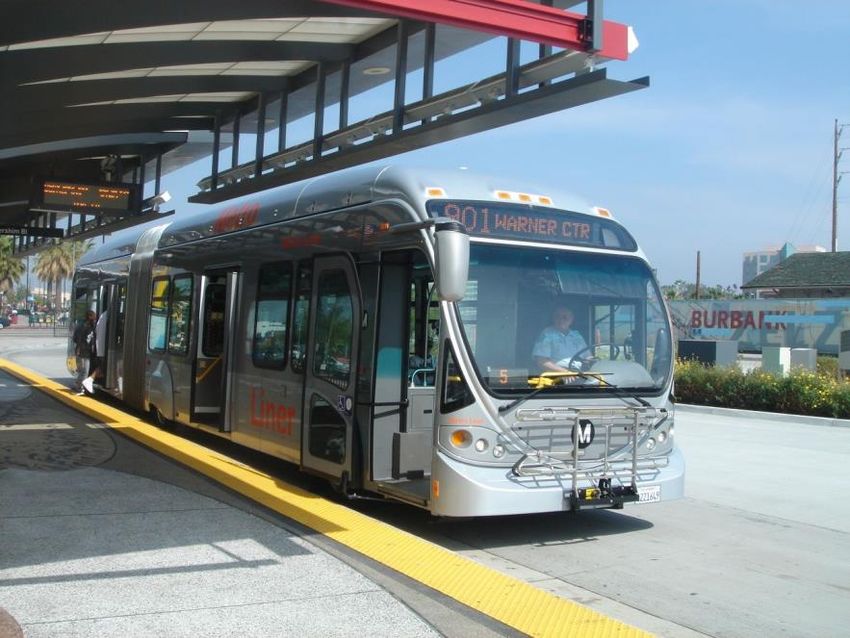
Lesson 1: BRT Generates Economic
Benefits Similar to LRT

Healthline               $4-$5 billion worth of investment has occurred in the corridor
Cleveland, OH            since the Healthline began operations; associated with hospitals,
                         universities, other institutions

Franklin EmX             $100 million worth of construction projects are under way
Eugene, OR               downtown near the Franklin EmX line, including a boutique hotel,
                         office space renovations, and expansions to a community college

Troost MAX,              The city recently received a $25-million federal grant for urban
Kansas City,             reinvestment; area was chosen for federal investment in part due
MO                       to its proximity to the BRT

Source: U.S. Government Accountability Office, “Bus Rapid Transit: Projects Improve Transit Service and Can Contribute to
Economic Development,” July 2012, GAO analysis of interviews with local officials.
Lesson 2: Transit is a Market Accelerator, Not a Market Maker
Lesson 3: Changing Demographics is Driving
Demand For Transit Oriented Locations
76 Million Baby
Boomers many of 75-80 Million Millennials – The
whom are downsizing newest members of the work
force
Almost ½ of All
Households are Single
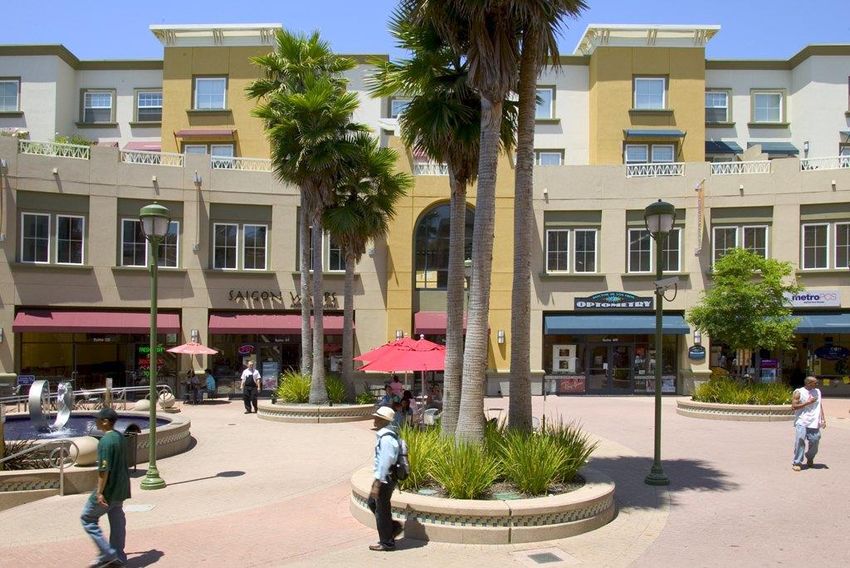
PeopleMany Consumers Want to Live In
Walkable Communities
Don't Care
5%
Walkable
Community
Conventional 50%
Suburban
Community
45%
Source: National Association of Realtors/ American Strategies. “ National Community Preference Survey” 2013This Demand is Generating Price Premiums for
Both Residential and Commercial Properties
Average Rents per Square Foot
Walkable vs Suburban Neighborhoods in Atlanta
%
Suburban “WalkUp” Difference
Office $14.23 $18.55 30%
Retail $10.42 $25.71 144%
Rental
$13.07 $14.67 12%
Housing
For-Sale
$60.06 $156.46 161%
Housing
Source: Leinberger, GWU School of Business – The WalkUP Wake-Up Call: Atlanta 2013And, This is Not Just about “Downtown” Locations Source: Leinberger, GWU School of Business – The WalkUP Wake-Up Call: Atlanta 2013
Lesson 5: These Other Transportation
Systems Also have Economic Benefits
             Bike Share =
             Additional $150,000 in rider
             expenditures (Minneapolis)

             Urban Bike “Trails” =
             As much as $846 million in
             economic impact
             (Indianapolis Cultural Arts Trail)
Lesson 4: More Businesses are Relocating
to Be Near Transit
“I think it’s essential we be accessible to Metro and that limits the
options. I think as with many other things our younger folks are
more inclined to be Metro-accessible and more urban.” - Arne M.
Sorenson, Chief Executive, Marriott International. Washington Post, March 2015
“While Microsoft and Nintendo have stayed in the suburbs,
Amazon is building a futuristic new inner-city home. “ – The Guardian, May
22, 2014
“State Farm exec: Transit helped Tempe get $600M hub”– Parker Leavitt, The Republic,
February 20, 2015
2Lesson 6: TOD Must Be Equitable
“MARTA will apply a policy goal of 20% affordability, on
average, to joint development projects undertaken
subsequent to the adoption of the TOD Guidelines”
- Polices for Implementing MARTA’s TOD Guidelines, 2010
MARTA – Metropolitan Atlanta Rapid Transit AuthorityConcluding Thoughts
Planning for Transit is a Regional Proposition, Planning
for Job Growth Should Also be a Regional Concern

Job
sprawl in
the
Phoenix
region
Local Governments Need to “Set the Table” For TOD With Clear
Land Use Policy to Reflect Community Values and Guide the
Market
Good Zoning
Good street connectivity policiesSteer The Market Rather Than letting the Market Steer Itself Once places become “transit accessible” they may serve different market niches than these same place did in the past.
Be Realistic About the Market, but Don’t “Settle” Either This is a long term proposition Not every developer has the right skill set to do TOD, look for the right partners
Create a Strategy To Ensure Housing Affordability
Early in the Transit Planning Process
One entity or organization should take the lead
on developing and implementing the strategy
This should be a regional effort
Many tools will be requiredTransit Can Both Shape and Serve But Only By: Working with the right market segments Having the right policies in place Making the supporting public investments Being patient!
You can also read