Short-Term Variation and Discharge Mechanism of the Futamata Hot Spring Estimated by Continuous Monitoring Data - MDPI
←
→
Page content transcription
If your browser does not render page correctly, please read the page content below
water
Article
Short-Term Variation and Discharge Mechanism of
the Futamata Hot Spring Estimated by Continuous
Monitoring Data
Yota Suzuki *             and Hiroshi Asanuma

                                          Fukushima Renewable Energy Institute, National Institute of Advanced Industrial Science and Technology,
                                          Koriyama-shi, Fukushima 963-0298, Japan; h.asanuma@aist.go.jp
                                          * Correspondence: yt-suzuki@aist.go.jp; Tel.: +81-29-861-8275

                                          Abstract: Japan has abundant hot spring resources, which, if used appropriately, could contribute
                                          to CO2 emission reduction and socioeconomic development. Thus, for the appropriate use of hot
                                          spring resources, it is necessary to estimate the detailed discharge mechanism and its surrounding
                                          hydraulic characteristics. In our study, a hot spring monitoring device was developed and installed
                                          in the Futamata hot spring to evaluate its discharge mechanism. Comparison between the measured
                                          values of the monitoring device and the amount of precipitation indicated that this hot spring shows
                                          two types of water quality change trends depending on the intensity of precipitation. However, this
                                          was a short-term variation that could not be detected by conventional methods. To address this
                                          limitation, we created a new discharge mechanism model for the Futamata hot spring based on these
                                          observations, which allowed for the continuous observation of hot spring water using a monitoring
                                          device and was effective in detecting short-term variations. As such observations contribute to
                                estimating the hydraulic structure around the hot spring, they are important for appropriate use of
                                   hot spring resources.
Citation: Suzuki, Y.; Asanuma, H.
Short-Term Variation and Discharge        Keywords: Futamata hot spring; remote monitoring system; time series analysis; Fukushima; Japan
Mechanism of the Futamata Hot
Spring Estimated by Continuous
Monitoring Data. Water 2021, 13, 977.
https://doi.org/10.3390/w13070977         1. Introduction
                                               The Paris Agreement was adopted with the agreement of all participating countries at
Academic Editor: Marco Franchini
                                          the 21st Conference of the Parties to the United Nations Framework Convention on Climate
                                          Change (COP21) held in 2015. The Paris Agreement is an international framework for
Received: 19 March 2021
                                          reducing greenhouse gas emissions after 2020. In Japan, the aim is advocated of reducing
Accepted: 29 March 2021
                                          greenhouse gas emissions by 26.0% by 2030 (compared with those in 2013) and expanding
Published: 1 April 2021
                                          the use of renewable energy with low CO2 emissions is promoted [1].
                                               Japan is home to 27,283 hot spring resources [2] that should be properly and appro-
Publisher’s Note: MDPI stays neutral
with regard to jurisdictional claims in
                                          priately utilized. Muraoka and Osato (2010) estimated that the potential of the domestic
published maps and institutional affil-
                                          low-temperature (53–120 ◦ C) hydrothermal system resources is 8.33 GW [3]. The power
iations.
                                          generation efficiency used for this estimation was 0.0731. The amount of energy per year is
                                          approximately 999,000 GWh from the estimated potential of 8.33 GW, calculated according
                                          to the method of the Ministry of the Environment, 2019a [4]. The amount of CO2 emitted
                                          per year is approximately 250 million tCO2 when the same amount of energy is gener-
                                          ated with an oil-fired boiler (CO2 emission factor is 0.0693; Ministry of the Environment,
Copyright: © 2021 by the authors.
                                          2019b [5]). Consequently, the effective utilization of natural hydrothermal resources in
Licensee MDPI, Basel, Switzerland.
                                          Japan could contribute to a reduction in CO2 emissions.
This article is an open access article
distributed under the terms and
                                               Hot springs are not only hydrothermal resources but also tourism attractions in Japan.
conditions of the Creative Commons
                                          The Japanese hot spring industry has the largest market in the world [6] and forms the
Attribution (CC BY) license (https://     basis of the domestic tourism industry. The tourism industry influences socioeconomic
creativecommons.org/licenses/by/          development through the creation of businesses and employment opportunities, as well as
4.0/).                                    the development of social infrastructure. The production economic effect brought about by

Water 2021, 13, 977. https://doi.org/10.3390/w13070977                                                       https://www.mdpi.com/journal/water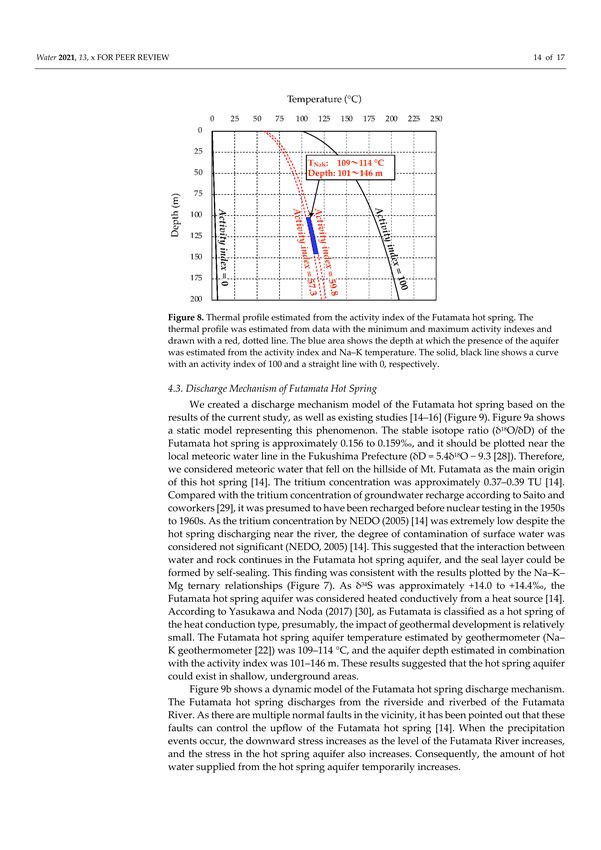
Water 2021, 13, 977                                                                                            2 of 15

                      tourism consumption in Japan is 55.4 trillion yen and the added value effect is 28.2 trillion
                      yen, which is said to have an employment opportunity for 4.41 million people. This is
                      equivalent to 5.3% of the amount of production of Japan, 5.2% of gross domestic product
                      (GDP), and 6.4% of the total number of employees [7]. In addition, hot spring resources
                      often exist in remote areas, such as near volcanoes, and the hot spring industry contributes
                      to job creation in these non-industrial areas [8].
                            A detailed evaluation of the hot spring resources is indispensable to proper utilization.
                      Continued reckless use without evaluating the characteristics causes depletion and water
                      quality changes in hot springs. Moreover, it could adversely affect the environment.
                      Continuous monitoring is effective for evaluation of the characteristics of groundwater
                      resources such as hot springs. Monitoring of hot springs is generally conducted once
                      every month for several months. However, these survey frequencies cannot capture water
                      quality changes that occur less than daily, owing to weather conditions [9]. Therefore,
                      automatic high-frequency continuous observation using a device is desirable to capture
                      short-term variations; however, it is considered extremely difficult because of the effects of
                      scale formation [9]. Accordingly, few studies have conducted high-frequency continuous
                      observations of hot springs.
                            In addition, estimating the hydraulic structure around the hot spring is important
                      for evaluating the interference between hot springs. In Beppu City, which has the largest
                      number of hot springs in Japan, there is concern that hot spring resources will be depleted
                      because of the rush to hot spring well drilling in the limited area where they are expected to
                      occur. Accordingly, a protected area, the “Avoid Area”, has been established and develop-
                      ment control is being implemented [10]. To prevent excessive development, it is important
                      to estimate the hydraulic structure around a hot spring by continuous monitoring.
                            In this study, we attempted to estimate the hydraulic structure around the Futamata
                      hot spring using a hot spring monitoring device [11]. Verification tests of hot spring
                      monitoring devices have been conducted at 11 locations in Japan [11], and acquiring data
                      is relatively easy at the Futamata hot spring because of the small scale formation effect. In
                      addition, this hot spring is a natural discharge, i.e., water is not pumped using power, and
                      there is no mix of multiple sources. It was selected as our study area because it was not
                      necessary to consider human effects and it was relatively easy to verify the data.
                            The main objective of this study was to estimate the detailed discharge mechanism
                      of a hot spring in order to appropriately use hot spring resources. Analysis of the data
                      suggested that high-frequency continuous observations could provide useful information
                      for understanding short-term variations in this hot spring and for estimating their causes.
                      We detected short-term variations that could not be detected by conventional methods and
                      we created a corresponding new discharge mechanism model for this hot spring.

                      2. Materials and Methods
                      2.1. Futamata Hot Spring
                            This natural hot spring is located in the southern part of the Fukushima Prefecture in
                      northeastern Japan. It discharges from the riverside and riverbed of the Futamata River,
                      which flows through the eastern foot of Mt. Futamata, a Quaternary stratovolcano. The area
                      around the source is covered with Tertiary lake sediments, and the western Mt. Futamata
                      flank is unconformably covered with Quaternary volcanic ejecta [12]. An observation
                      point of the Automated Meteorological Data Acquisition System (AMeDAS) [13], Yumoto
                      site is located in the northeast of the Futamata hot spring. There are multiple normal
                      faults in the vicinity that strike in an E–W direction and are inclined to the north at a high
                      angle. It has been pointed out that these faults could control the upflow of the Futamata
                      hot spring [14]. Surveys for geothermal development by New Energy and Industrial
                      Technology Development Organization (NEDO) have been conducted twice around the
                      Futamata hot spring [14–16], with water quality analysis conducted accordingly. During
                      2004 to 2005, two geothermal survey wells were drilled at a point approximately 3 km
                      north of the Futamata hot spring (Figure 1a). To assess the impact of the well survey on the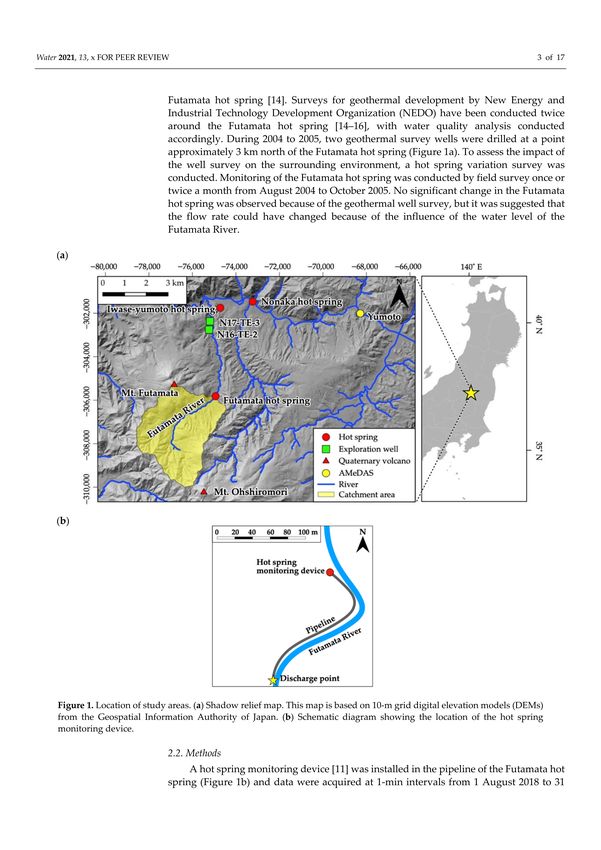
Water 2021, 13, 977                                                                                                         3 of 15

                                 surrounding environment, a hot spring variation survey was conducted. Monitoring of the
                                 Futamata hot spring was conducted by field survey once or twice a month from August
                                 2004 to October 2005. No significant change in the Futamata hot spring was observed
                                 because of the geothermal well survey, but it was suggested that the flow rate could have
                                 changed because of the influence of the water level of the Futamata River.

      Figure 1. Location of study areas. (a) Shadow relief map. This map is based on 10-m grid digital elevation models
      (DEMs) from the Geospatial Information Authority of Japan. (b) Schematic diagram showing the location of the hot spring
      monitoring device.

                                 2.2. Methods
                                      A hot spring monitoring device [11] was installed in the pipeline of the Futamata hot
                                 spring (Figure 1b) and data were acquired at 1-min intervals from 1 August 2018 to 31
                                 December 2019. A photograph of the hot spring monitoring device is shown in Figure 2,
                                 while Table 1 shows its main specifications [11]. This is an IoT device and the data can be
                                 downloaded via the Internet. The flow rate, temperature, and electrical conductivity (EC)
                                 were obtained from the data acquired from the monitoring device. In addition, we used
                                 precipitation data measured at the AMeDAS Yumoto site (Figure 1a) for the same period.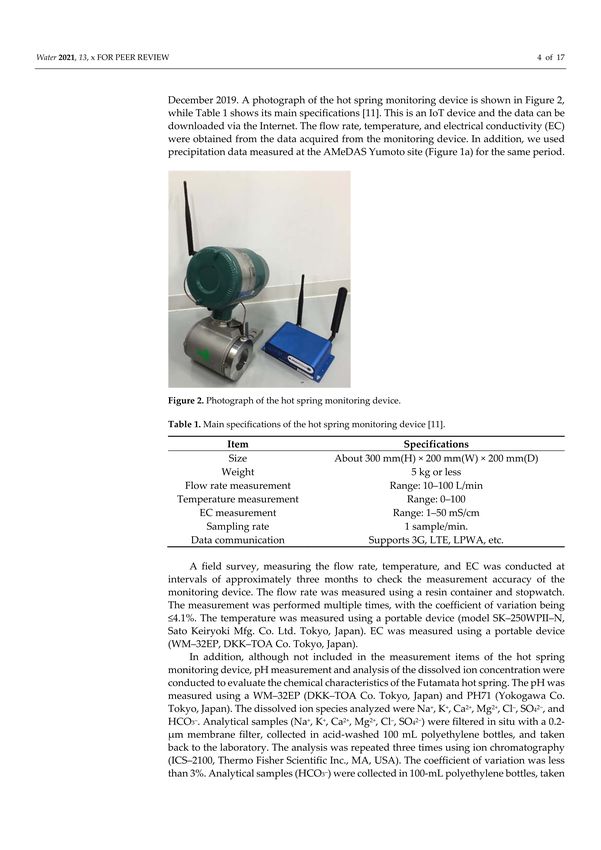
Water 2021, 13, 977                                                                                               4 of 15

                      Figure 2. Photograph of the hot spring monitoring device.

                      Table 1. Main specifications of the hot spring monitoring device.

                                         Item                                         Specifications
                                         Size                         About 300 mm(H) × 200 mm(W) × 200 mm(D)
                                       Weight                                         5 kg or less
                               Flow rate measurement                             Range: 10–100 L/min
                              Temperature measurement                                Range: 0–100
                                  EC measurement                                  Range: 1–50 mS/cm
                                   Sampling rate                                    1 sample/min.
                                Data communication                            Supports 3G, LTE, LPWA, etc.

                            A field survey, measuring the flow rate, temperature, and EC was conducted at inter-
                      vals of approximately three months to check the measurement accuracy of the monitoring
                      device. The flow rate was measured using a resin container and stopwatch. The measure-
                      ment was performed multiple times, with the coefficient of variation being ≤4.1%. The
                      temperature was measured using a portable device (model SK–250WPII–N, Sato Keiryoki
                      Mfg. Co. Ltd., Tokyo, Japan). EC was measured using a portable device (WM–32EP,
                      DKK–TOA Co., Tokyo, Japan).
                            In addition, although not included in the measurement items of the hot spring mon-
                      itoring device, pH measurement and analysis of the dissolved ion concentration were
                      conducted to evaluate the chemical characteristics of the Futamata hot spring. The pH
                      was measured using a WM–32EP (DKK–TOA Co. Tokyo, Japan) and PH71 (Yokogawa Co.
                      Tokyo, Japan). The dissolved ion species analyzed were Na+ , K+ , Ca2+ , Mg2+ , Cl– , SO4 2− ,
                      and HCO3 – . Analytical samples (Na+ , K+ , Ca2+ , Mg2+ , Cl– , SO4 2− ) were filtered in situ with
                      a 0.2-µm membrane filter, collected in acid-washed 100 mL polyethylene bottles, and taken
                      back to the laboratory. The analysis was repeated three times using ion chromatography
                      (ICS–2100, Thermo Fisher Scientific Inc., Waltham, MA, USA). The coefficient of variation
                      was less than 3%. Analytical samples (HCO3 – ) were collected in 100-mL polyethylene
                      bottles, taken back to the laboratory, and calculated from the alkalinity of pH 4.3 by sulfate
                      titration. The ion balance [17] was ±1.7% or less.

                      3. Results: Comparison of the Survey Data and Monitoring Data
                           We compared the manually measured values of the field survey and the automatically
                      measured values of the hot spring monitoring device and examined the differences between
                      the values. The hot spring monitoring device is equipped with a sampling valve for collect-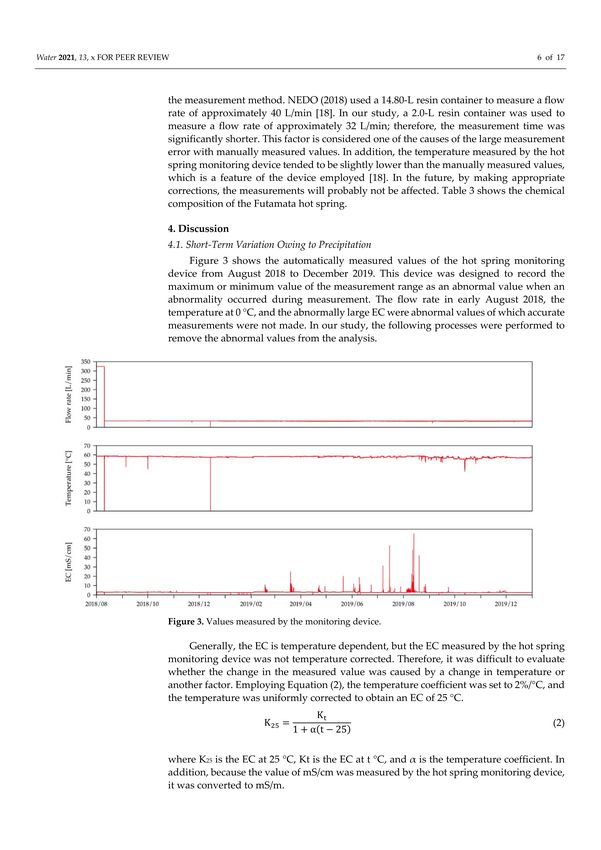
Water 2021, 13, 977                                                                                                                                     5 of 15

                                       ing hot spring water on the downstream side of various sensors. However, as the valve
                                       opens, the amount of hot spring water circulating in the pipeline changes drastically, which
                                       could affect the measurement. Therefore, for comparison with the manually measured
                                       values of the field survey, we used the average value for 10 min when the automatically
                                       measured values by the monitoring device were stable before the start of the field survey.
                                            Table 2 shows the manually measured values of the field survey and the automatically
                                       measured values of the hot spring monitoring device. In addition, to compare the manually
                                       measured values and the automatically measured values, we calculated the difference
                                       between the values using Equation (1).

                                                                   Automatic measured values − Manual measured values
                                            Di f f erence (%) =                                                       × 100                                (1)
                                                                                Manual measured values
                                             The difference between the manually measured and automatically measured values
                                       was −1.5% to 4.5% for the flow rate, −1.8 to −0.3% for the temperature, and 0.3 to 0.6%
                                       for the EC. NEDO (2018) considered the accuracy of flow rate measurement by a hot
                                       spring monitoring device and indicated that measurements could probably differ by ±3.5%
                                       or less from manually measured values [18]. In our study, the difference between the
                                       automatically and manually measured values was 4.5% maximum, i.e., larger than the
                                       result of the report [18]; however, presumably this could be ascribed to the difference in the
                                       measurement method. NEDO (2018) used a 14.80-L resin container to measure a flow rate
                                       of approximately 40 L/min [18]. In our study, a 2.0-L resin container was used to measure
                                       a flow rate of approximately 32 L/min; therefore, the measurement time was significantly
                                       shorter. This factor is considered one of the causes of the large measurement error with
                                       manually measured values. In addition, the temperature measured by the hot spring
                                       monitoring device tended to be slightly lower than the manually measured values, which
                                       is a feature of the device employed [18]. In the future, by making appropriate corrections,
                                       the measurements will probably not be affected. Table 3 shows the chemical composition
                                       of the Futamata hot spring.

      Table 2. Comparison of the automatically measured values of the hot spring monitoring device and the manually measured
      values of the field survey.

                               Flow Rate [L/min]                            Temperature [◦ C]                                    EC [mS/cm]
     Date        Automatic        Manual     Difference [%]     Automatic      Manual     Difference [%]          Automatic       Manual    Difference [%]
 2018/08/10           n/m          36.1                           58.8          59.8            –1.7%                2.78          2.76         0.3%
 2018/11/22           32.8         33.3            –1.5%          57.9          58.4            –0.9%                2.57          n/m
 2019/03/08           32.6         31.2             4.5%          58.2          59.0            –1.4%                3.02          n/m
 2019/06/14           32.6         32.1             1.5%          57.1          58.1            –1.8%                2.49          n/m
 2019/09/04           32.5         n/m                            57.0          57.6            –1.1%                2.49          2.48         0.6%
 2019/12/10           32.4         31.2            3.9%           57.1          57.3            –0.3%                2.57          n/m
      n/m: No measurement. Automatic: Automatically measured values of the hot spring monitoring device. Manual: Manually measured values
      of the field survey. Difference: Difference between these measured values calculated by using Equation (1).

                                            Table 3. Chemical composition of the Futamata hot spring.

  Sampling Date         pH        Na+ [mg/L]        K+ [mg/L]     Ca2+ [mg/L]      Mg2+ [mg/L]          Cl– [mg/L]          SO4 2– [mg/L]   HCO3 – [mg/L]
    2018/08/10          8.90         78.7             1.03           326                0.08               2.83                 953              n/m
    2018/11/22          9.06         79.2             1.04           328                0.08               2.84                 949              n/m
    2019/03/08          8.75         78.9             1.02           327                0.08               2.80                 936              n/m
    2019/06/14          8.72         78.5             1.07           324                0.08               2.90                 949              14.5
    2019/09/04          8.73         78.3             1.12           327                0.09               2.98                 949              15.3
    2019/12/10          8.67         78.2             1.04           325                0.08               2.98                 955              15.3
                                                                n/m: No measurement.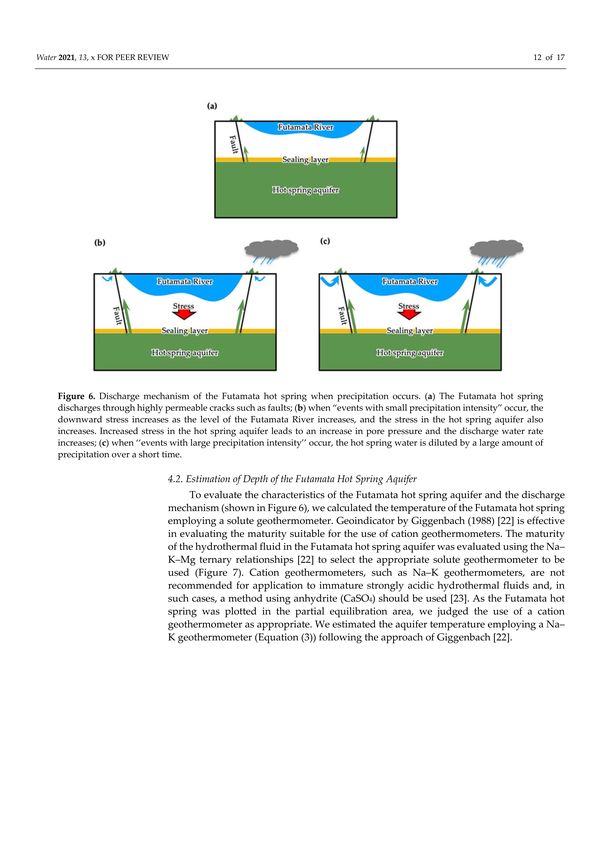
Water 2021, 13, 977                                                                                           6 of 15

                      4. Discussion
                      4.1. Short-Term Variation Owing to Precipitation
                           Figure 3 shows the automatically measured values of the hot spring monitoring device
                      from August 2018 to December 2019. This device was designed to record the maximum
                      or minimum value of the measurement range as an abnormal value when an abnormality
                      occurred during measurement. The flow rate in early August 2018, the temperature at 0 ◦ C,
                      and the abnormally large EC were abnormal values of which accurate measurements were
                      not made. In our study, the following processes were performed to remove the abnormal
                      values from the analysis.

                            Figure 3. Values measured by the monitoring device.

                           Generally, the EC is temperature dependent, but the EC measured by the hot spring
                      monitoring device was not temperature corrected. Therefore, it was difficult to evaluate
                      whether the change in the measured value was caused by a change in temperature or
                      another factor. Employing Equation (2), the temperature coefficient was set to 2%/◦ C, and
                      the temperature was uniformly corrected to obtain an EC of 25 ◦ C.

                                                                       Kt
                                                          K25 =                                                  (2)
                                                                  1 + α(t − 25)

                      where K25 is the EC at 25 ◦ C, Kt is the EC at t ◦ C, and α is the temperature coefficient. In
                      addition, because the value of mS/cm was measured by the hot spring monitoring device,
                      it was converted to mS/m.
                           Figure 4 shows a graph of the flow rate and temperature measured by the hot spring
                      monitoring device, temperature-corrected EC, and 24-h precipitation measured by the
                      AMeDAS Yumoto site (Figure 1a). The 24-h precipitation was the total amount of precipita-
                      tion recorded 24 h before the measurement time. A filtering method, STL, [19] was used to
                      create the flow rate, temperature, and EC graphs. This filtering method can decompose
                      data into three components, namely, trend, seasonal, and remainder. Here, the cycle was set
                      to 24 h, and the results are shown of the trend component with the seasonal and remainder
                      components removed. The flow rate values before 10 August 2018 were missing.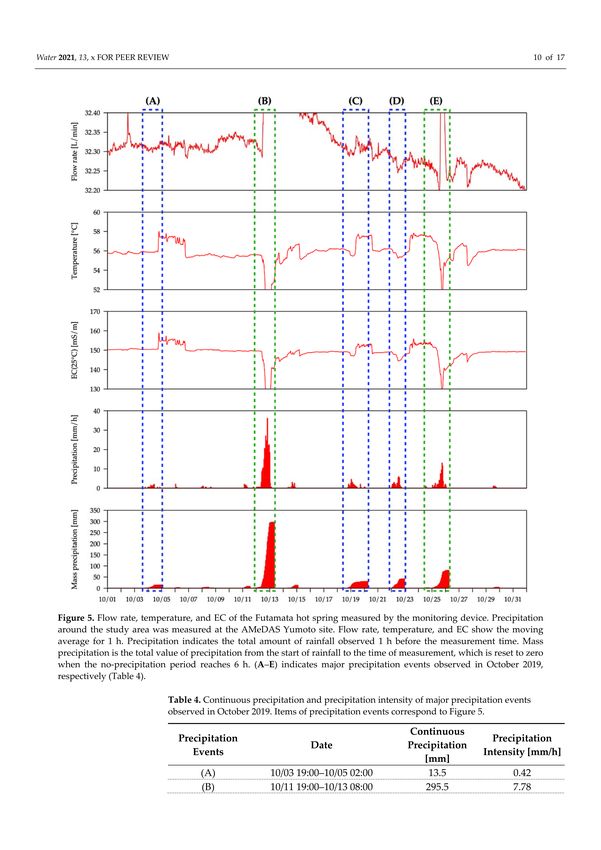
Water 2021, 13, 977                                                                                                                 7 of 15
er 2021, 13, x FOR PEER REVIEW                                                                                                      8 of 17

                             Figure
              Figure 4. Flow rate,    4. Flow rate,
                                   temperature,  andtemperature,
                                                      EC measured and
                                                                    by EC
                                                                        the measured
                                                                            monitoringby the monitoring
                                                                                        device,           device,measured
                                                                                                and precipitation and precipitation
                                                                                                                             by the AMeDAS
              Yumoto site. Flow rate, temperature, and EC show the trend for 24 h, and precipitation showsthe
                             measured     by the AMeDAS    Yumoto    site. Flow rate, temperature,  and  EC  show   thetrend
                                                                                                                         total for
                                                                                                                                for 24
                                                                                                                                    24 h,
                                                                                                                                        h before
                             and   precipitation shows  the total for 24  h before
              measurement. EC is converted from Equation (2) to a value of 25 ◦ C. measurement.   EC  is converted from   Equation     (2)
                             to a value of 25 °C.
Water 2021, 13, 977 8 of 15
In view of the results (Figure 4), we focused on October 2019, with particularly large
24-h precipitation confirmed. Figure 5 shows a graph of the flow rate, temperature, and
EC (25 ◦ C) measured by the hot spring monitoring device, and precipitation measured
by the AMeDAS Yumoto site from 1 October 2019 to 1 November 2019. We used the EC
values corrected for temperature from Equation (2). Mass precipitation is the total value of
precipitation from the start of rainfall to the time of measurement, which was reset to zero
when the no-precipitation period reached 6 h.
Figure 5. Flow rate, temperature, and EC of the Futamata hot spring measured by the monitoring device. Precipitation
around the study area was measured at the AMeDAS Yumoto site. Flow rate, temperature, and EC show the moving average
for 1 h. Precipitation indicates the total amount of rainfall observed 1 h before the measurement time. Mass precipitation
is the total value of precipitation from the start of rainfall to the time of measurement, which is reset to zero when the
no-precipitation period reaches 6 h. (A–E) indicates major precipitation events observed in October 2019, respectively
(Table 4).Water 2021, 13, 977 9 of 15
Table 4. Continuous precipitation and precipitation intensity of major precipitation events observed in October 2019. Items
of precipitation events correspond to Figure 5.
Precipitation Events Date Continuous Precipitation [mm] Precipitation Intensity [mm/h]
(A) 10/03 19:00–10/05 02:00 13.5 0.42
(B) 10/11 19:00–10/13 08:00 295.5 7.78
(C) 10/18 19:00–10/20 06:00 29.5 0.82
(D) 10/22 01:00–10/22 23:00 40.5 1.76
(E) 10/25 01:00–10/26 06:00 79.0 2.63
On 12 October 2019 typhoon No. 19 (Hagibis) landed and caused heavy rainfall (Fig-
ure 5B), and on 25 October 2019 typhoon No. 21 (Bualoi) caused an increase in precipitation
(Figure 5E) [20]. In addition, precipitation was recorded on October 4 2019 (Figure 5A),
19 October 2019 (Figure 5C), and 22 October 2019 (Figure 5D). Here, we classified these
as “events with large precipitation intensity” (Figure 5, green, dashed line) caused by
typhoons such as those of 12 and 25 October, and “events with small precipitation intensity”
(Figure 5, blue, dashed line) caused by events such as those occurring on 4, 19, and 22
October. Table 4 shows the continuous precipitation and precipitation intensity of major
precipitation events observed in October 2019.
When “events with large precipitation intensity” occurred, the flow rate increased,
temperature decreased, and the EC of the Futamata hot spring decreased. In addition,
the spike-shaped change in each measured value was at a maximum during the time the
precipitation peaked. The water quality of the Futamata hot spring changed almost at the
same time as the occurrence of the precipitation events. These results suggested that this
hot spring could have been diluted by a large amount of precipitation.
On the other hand, when “events with small precipitation intensity” occurred, the
flow rate increased slightly, temperature increased, and the EC increased in the Futamata
hot spring. In addition, the temperature and EC changed several hours after the peak
of precipitation, indicating a time lag between the occurrence of the precipitation events
and the change in water quality. Because the temperature and EC increased, and because
of the time lag, it is unlikely that the Futamata hot spring was diluted by precipitation.
Consequently, we considered that the water quality could have changed by a completely
different mechanism when “events with large precipitation intensity” occurred.
When “events with small precipitation intensity” occurred, as the temperature and
EC increased, it was unlikely that the water quality changed because of precipitation.
Rather, presumably, the hot water supply rate from the deep part was increasing. We
considered the causes of this tendency in the water quality change based on the Terzaghi
Principle consolidation theory (Figure 6). Most of the sources of the Futamata hot spring are
discharged naturally from the riverbed of the Futamata River and, presumably, multiple,
high-sloping, normal faults contribute to this discharge [14]. If the Futamata hot spring
aquifer existed in the shallow underground of the Futamata River, changes in the level
of the Futamata River could contribute to changes in the hot water supply rate from the
aquifer. Therefore, after the occurrence of “events with small precipitation intensity”, the
downward stress increased as the level of the Futamata River increased and the stress in
the hot spring aquifer also increased. The increased stress in the aquifer could lead to
an increase in pore pressure and increase in the discharge water rate through faults with
relatively high permeability (Figure 6). Consequently, the flow rate, temperature, and EC
of the Futamata hot spring increased. A similar tendency was observed from groundwater
observation data in Tokyo, Japan [21] wherein such changes in groundwater level are a
function of the stress in the aquifer that, in turn, is dependent on the changes in the river
water level. On the other hand, when “events with large precipitation intensity” occurred,
presumably, the hot spring water was diluted by a large amount of precipitation over a
short time, thereby increasing the flow rate significantly, whereas the temperature and EC
tended to decrease.Water 2021, 13, 977 10 of 15
Figure 6. Discharge mechanism of the Futamata hot spring when precipitation occurs. (a) The Futamata hot spring
discharges through highly permeable cracks such as faults; (b) when “events with small precipitation intensity” occur, the
downward stress increases as the level of the Futamata River increases, and the stress in the hot spring aquifer also increases.
Increased stress in the hot spring aquifer leads to an increase in pore pressure and the discharge water rate increases; (c)
when “events with large precipitation intensity” occur, the hot spring water is diluted by a large amount of precipitation
over a short time.
In addition, there was a time lag between the occurrence of precipitation and the
change in the water quality of the hot spring, i.e., a delay from the time the precipitation
events occurred to the time the level of the nearby Futamata River increased. The source
of the Futamata River is the hillside of Mt. Ohshiromori, which is located in the southern
part of Mt. Futamata (Figure 1a). The size of the catchment area near the Futamata hot
spring is approximately 11.5 km2 . It takes time for precipitation in the catchment area
to flow into the Futamata River and its branches and through the discharge point of the
Futamata hot spring. Afterward, the level of the Futamata River gradually decreases as the
influence of precipitation decreases, and the change in water quality of the Futamata hot
spring recovers within a few hours.
4.2. Estimation of Depth of the Futamata Hot Spring Aquifer
To evaluate the characteristics of the Futamata hot spring aquifer and the discharge
mechanism (shown in Figure 6), we calculated the temperature of the Futamata hot spring
employing a solute geothermometer. Geoindicator by Giggenbach (1988) [22] is effective
in evaluating the maturity suitable for the use of cation geothermometers. The maturity
of the hydrothermal fluid in the Futamata hot spring aquifer was evaluated using the
Na–K–Mg ternary relationships [22] to select the appropriate solute geothermometer to
be used (Figure 7). Cation geothermometers, such as Na–K geothermometers, are not
recommended for application to immature strongly acidic hydrothermal fluids and, in such
cases, a method using anhydrite (CaSO4 ) should be used [23]. As the Futamata hot spring
was plotted in the partial equilibration area, we judged the use of a cation geothermometerWater 2021, 13, 977 11 of 15
as appropriate. We estimated the aquifer temperature employing a Na–K geothermometer
(Equation (3)) following the approach of Giggenbach [22].
1390
TNaK = − 273.15 (3)
1.750 + log( Na/K )
where the unit of cation concentration is mg/kg. Using Equation (3), the Futamata hot
spring aquifer temperature was estimated at 109 ◦ C to 114 ◦ C (Table 5). The difference
between the discharge temperature and the temperature measured by geothermometer
was as small as 49.2 ◦ C to 56.7 ◦ C, suggesting that the Futamata hot spring aquifer probably
exists in the shallow underground.
Figure 7. Na–K–Mg ternary relationships. Red circles indicate samples from Futamata hot spring.
Table 5. Activity index, Na–K temperature, and aquifer depth, estimated from the activity index and
Na–K temperature of Futamata hot spring.
Date Activity Index TNaK [◦ C] Depth [m]
2018/08/10 59.8 109 101
2018/11/22 58.4 110 117
2019/03/08 59.0 109 107
2019/06/14 58.1 111 125
2019/09/04 57.6 114 146
2019/12/10 57.3 110 127
We attempted to estimate the depth of the Futamata hot spring aquifer using the
activity index [24]. This activity index can be extrapolated easily from the underground
thermal profile from the point data of the drilling depth and the temperature at that depth.
Because a detailed thermal profile is not required, abundant data could be utilized, and the
subsurface thermal structure in major geothermal fields in Tohoku, Japan, was estimated in
this way and its accuracy evaluated [25,26]. When calculating the activity index of a natural
hot spring, the discharge temperature is used as the value of the activity index [27]. The
red, dotted lines in Figure 8 are the thermal profiles of the Futamata hot spring estimated
using the activity index. The solid black curve and the solid black straight line represent an
activity index of 100 and 0, respectively. The thermal profiles of the Futamata hot spring
were drawn when the activity index was at a maximum and a minimum. Assuming that
the Futamata hot spring aquifer exists at a depth where the temperatures reach 109–114 ◦ C
based on the results of the geothermometer, it was identified as existing at the depth of
approximately 101–146 m (Table 5), represented by the blue area in Figure 8.Water 2021, 13, 977 12 of 15
Figure 8. Thermal profile estimated from the activity index of the Futamata hot spring. The thermal
profile was estimated from data with the minimum and maximum activity indexes and drawn with a
red, dotted line. The blue area shows the depth at which the presence of the aquifer was estimated
from the activity index and Na–K temperature. The solid, black line shows a curve with an activity
index of 100 and a straight line with 0, respectively.
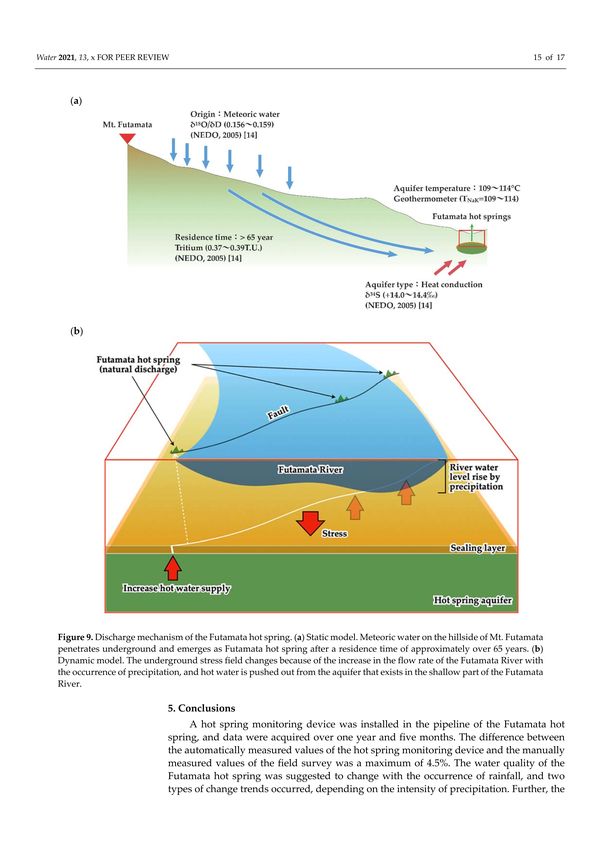
4.3. Discharge Mechanism of Futamata Hot Spring
We created a discharge mechanism model of the Futamata hot spring based on the
results of the current study, as well as existing studies [14–16] (Figure 9). Figure 9a shows
a static model representing this phenomenon. The stable isotope ratio (δ18 O/δD) of the
Futamata hot spring is approximately 0.156 to 0.159‰, and it should be plotted near the
local meteoric water line in the Fukushima Prefecture (δD = 5.4δ18 O − 9.3 [28]). Therefore,
we considered meteoric water that fell on the hillside of Mt. Futamata as the main origin
of this hot spring [14]. The tritium concentration was approximately 0.37–0.39 TU [14].
Compared with the tritium concentration of groundwater recharge according to Saito and
coworkers [29], it was presumed to have been recharged before nuclear testing in the 1950s
to 1960s. As the tritium concentration by NEDO (2005) [14] was extremely low despite
the hot spring discharging near the river, the degree of contamination of surface water
was considered not significant (NEDO, 2005) [14]. This suggested that the interaction
between water and rock continues in the Futamata hot spring aquifer, and the seal layer
could be formed by self-sealing. This finding was consistent with the results plotted by the
Na–K–Mg ternary relationships (Figure 7). As δ34 S was approximately +14.0 to +14.4‰, the
Futamata hot spring aquifer was considered heated conductively from a heat source [14].
According to Yasukawa and Noda (2017) [30], as Futamata is classified as a hot spring of
the heat conduction type, presumably, the impact of geothermal development is relatively
small. The Futamata hot spring aquifer temperature estimated by geothermometer (Na–K
geothermometer [22]) was 109–114 ◦ C, and the aquifer depth estimated in combination
with the activity index was 101–146 m. These results suggested that the hot spring aquifer
could exist in shallow, underground areas.Water 2021, 13, 977 13 of 15
Figure 9. Discharge mechanism of the Futamata hot spring. (a) Static model. Meteoric water on the hillside of Mt. Futamata
penetrates underground and emerges as Futamata hot spring after a residence time of approximately over 65 years.
(b) Dynamic model. The underground stress field changes because of the increase in the flow rate of the Futamata River
with the occurrence of precipitation, and hot water is pushed out from the aquifer that exists in the shallow part of the
Futamata River.
Figure 9b shows a dynamic model of the Futamata hot spring discharge mechanism.
The Futamata hot spring discharges from the riverside and riverbed of the Futamata River.
As there are multiple normal faults in the vicinity, it has been pointed out that these faults
can control the upflow of the Futamata hot spring [14]. When the precipitation events
occur, the downward stress increases as the level of the Futamata River increases, andWater 2021, 13, 977 14 of 15
the stress in the hot spring aquifer also increases. Consequently, the amount of hot water
supplied from the hot spring aquifer temporarily increases.
5. Conclusions
A hot spring monitoring device was installed in the pipeline of the Futamata hot
spring, and data were acquired over one year and five months. The difference between
the automatically measured values of the hot spring monitoring device and the manually
measured values of the field survey was a maximum of 4.5%. The water quality of the
Futamata hot spring was suggested to change with the occurrence of rainfall, and two
types of change trends occurred, depending on the intensity of precipitation. Further, the
aquifer of the Futamata hot spring was suggested to exist in the shallow underground of
the Futamata River. The results of this survey and existing surveys suggested the water
quality of the Futamata hot spring changed when changes occurred in the level of the
Futamata River after rainfall.
In this study, we showed that continuous observation with a monitoring device could
successfully capture short-term variations not detectable with conventional methods. We
created a new dynamic discharge mechanism model and, based on the observations,
provided more detailed estimation of the hydraulic structure around the Futamata hot
spring. Our results suggested that continuous observation of hot springs by a monitoring
device provides important information for the appropriate use of hot spring resources.
In the future, we intend to apply such continuous observations to hot spring resources in
other areas to derive a versatile discharge mechanism estimation method, which will lead
to the appropriate use of hot spring resources nationwide.
Author Contributions: Conceptualization, Y.S. and H.A.; methodology, Y.S.; formal analysis, Y.S.;
investigation, Y.S.; data curation, Y.S.; writing—original draft preparation, Y.S.; writing—review and
editing, H.A.; visualization, Y.S.; supervision, H.A.; project administration, H.A.; funding acquisition,
H.A. All authors have read and agreed to the published version of the manuscript.
Funding: This paper is based on results obtained from a project, JPNP13009, commissioned by the
New Energy and Industrial Technology Development Organization (NEDO).
Data Availability Statement: Not applicable.
Acknowledgments: This paper is based on results obtained from a project commissioned by the
New Energy and Industrial Technology Development Organization (NEDO). Yoshiyasu Sato of the
Daimaru Asunaro-so, Fukushima, Japan, cooperated in this study. The Automated Meteorological
Data Acquisition System (AMeDAS) data were provided by the Japan Meteorological Agency (JMA).
R version 3.5.1 was used for time series analysis [31]. We gratefully acknowledge the valuable com-
ments of Yasuaki Murata (Fukushima Renewable Energy Institute, National Institute of Advanced
Industrial Science and Technology), Norio Yanagisawa (National Institute of Advanced Industrial
Science and Technology), and Daisuke Fukuda (Geothermal Engineering Co., Ltd., Iwate, Japan).
Conflicts of Interest: The authors declare no conflict of interest.
References
1. Ministry of Foreign Affairs of Japan. Framework after 2020: Paris Agreement. Available online: https://www.mofa.go.jp/mofaj/
ic/ch/page1w_000119.html (accessed on 27 February 2021).
2. Ministry of the Environment, Japan. The State of Use of Hot Springs in Japan in the Fiscal Year 2018. Available online:
http://www.env.go.jp/nature/onsen/pdf/2-4_p_1.pdf (accessed on 2 June 2020).
3. Muraoka, H.; Osato, K. Hot Spring Power Generation System. In Aiming for Coexistence between Geothermal Power Generation
and Hot Spring Use; The Geothermal Research Society of Japan: Tokyo, Japan, 2010; pp. 26–33. Available online: https:
//grsj.gr.jp/wp-content/uploads/Onsen_kyosei_report_200215.pdf (accessed on 3 March 2021).
4. Ministry of the Environment, Japan. Guidelines for Effective Use of Hot Spring Heat. Available online: https://www.env.go.jp/
nature/onsen/pdf/guideline_1903.pdf (accessed on 3 March 2021).
5. Ministry of the Environment, Japan. List of Calculation Formulas and Emission Factors for Calculating Greenhouse Gas Emissions.
Available online: https://www.env.go.jp/earth/ondanka/suishin_g/3rd_edition/ref2.pdf (accessed on 3 March 2021).Water 2021, 13, 977 15 of 15
6. Ozaki, M.; Tagami, J. To Further Strengthen the Potential of the Tourism Resource “ONSEN”: Based on the Current Situation and
Characteristic Efforts of the European Spa Market. In Monthly Report of the Japan Economic Research Institute; The Japan Economic
Research Institute: Tokyo, Japan, 2014; pp. 62–71. (In Japanese)
7. Japan Tourism Agency. Research Study on Economic Impacts of Tourism in Japan. Available online: https://www.mlit.go.jp/
common/001354466.pdf (accessed on 3 March 2021).
8. The Japan Institute for Labor Policy and Training. Report of Japan Institute for Labor Policy No. 102. Available online:
https://www.jil.go.jp/institute/reports/2008/documents/0102_02.pdf (accessed on 3 March 2021).
9. Saishu, H.; Ootsuki, F.; Koga, M.; Watanabe, M.; Fukuda, D.; Kajiwara, T.; Asanuma, H. Design of an automated water monitoring
device suitable for use in Japanese onsen. J. Geotherm. Res. Soc. Jpn. 2016, 38, 115–126. (In Japanese with English Abstract)
[CrossRef]
10. Beppu City. For Businesses that Generate Hot Springs. Available online: https://www.city.beppu.oita.jp/sangyou/environment/
alternative_onsen.html (accessed on 28 January 2021).
11. Asanuma, H.; Yoshida, Y.; Kajiwara, T.; Kiyota, Y. Development of AI–IoT hot spring monitoring system. Chinetsugijutsu 2020, 45,
59–66. (In Japanese)
12. Yamamoto, T. Geology of the Tajima district. With Geological Sheet Map at 1:50,000. Geol. Surv. Jpn. 1999, 54, 85. (In Japanese
with English Abstract)
13. Japan Meteorological Agency. Automated Meteorological Data Acquisition System (AMeDAS). Available online: http://www.
jma.go.jp/jma/kishou/know/amedas/kaisetsu.html (accessed on 27 January 2021).
14. New Energy and Industrial Technology Development Organization (NEDO). Report of Geothermal Development Promotion Survey
No.C–2–2, Tenei Region (Primary Report); New Energy and Industrial Technology Development Organization (NEDO): Kawasaki,
Japan, 2005; p. 228. (In Japanese with English Abstract)
15. New Energy and Industrial Technology Development Organization (NEDO). Report of Fluid Geochemical Survey: National
Geothermal Resource Comprehensive Survey, Nasu Region; New Energy and Industrial Technology Development Organization
(NEDO): Kawasaki, Japan, 1990; p. 86. (In Japanese with English Abstract)
16. New Energy and Industrial Technology Development Organization (NEDO). Report of Geothermal Development Promotion Survey
No.C–2–2, Tenei Region (Secondary Report); New Energy and Industrial Technology Development Organization (NEDO): Kawasaki,
Japan, 2006; p. 178. (In Japanese with English Abstract)
17. Fritz, S.J. A Survey of Charge-Balance Errors on Published Analyses of Potable Ground and Surface Waters. Ground Water 1994,
32, 539–546. [CrossRef]
18. New Energy and Industrial Technology Development Organization (NEDO). Report of Research and Development of a Simple Remote
Hot Spring Monitoring Device for Geothermal Power Generation that Coexists with Hot Springs; New Energy and Industrial Technology
Development Organization (NEDO): Kawasaki, Japan, 2018; p. 184. (In Japanese with English Abstract)
19. Cleveland, B.R.; Cleveland, S.W.; McRae, J.E.; Terpenning, I. STL: A seasonal-trend decomposition procedure based on loess.
J. Off. Stat. 1990, 6, 3–73.
20. Japan Meteorological Agency (JMA). Disaster Weather Report: Heavy Rains and Storms from October 10–26, 2019 Due to Typhoons in
Eastern Japan; Japan Meteorological Agency (JMA): Tokyo, Japan, 2020; p. 288. Available online: http://www.jma.go.jp/jma/
kishou/books/saigaiji/saigaiji_2019/saigaiji_202003.pdf (accessed on 27 January 2021). (In Japanese)
21. Bureau of Construction Tokyo Metropolitan Government. Changes of Groundwater Levels Corresponding to High Water Level
of River Near Groundwater Observatory. Available online: https://www.kensetsu.metro.tokyo.lg.jp/content/000046558.pdf
(accessed on 25 March 2021).
22. Giggenbach, W.F. Geothermal solute equilibria. Derivation of Na-K-Mg-Ca geoindicators. Geochim. Cosmochim. Acta 1988, 52,
2749–2765. [CrossRef]
23. Oue, K.; Ohsawa, S.; Yusa, Y.; Kawano, T. A New Chemical Geothermometer for Strongly Acidic Hydrothermal Water. J. Hot
Spring Sci. 1996, 46, 87–96. (In Japanese with English Abstract)
24. Hayashi, M.; Taguchi, S.; Yamasaki, T. Activity Index and Thermal History of Geothermal Systems. Geotherm. Resour. Counc.
Trans. 1981, 5, 177–180.
25. Suzuki, Y.; Ioka, S.; Muraoka, H. Determining the Maximum Depth of Hydrothermal Circulation Using Geothermal Mapping and
Seismicity to Delineate the Depth to Brittle–Plastic Transition in Northern Honshu, Japan. Energies 2014, 7, 3503–3511. [CrossRef]
26. Suzuki, Y.; Muraoka, H.; Asanuma, H. Validation and Evaluation of an Estimation Method for Deep Thermal Structures Using an
Activity Index in Major Geothermal Fields in Northeastern Japan. Energies 2020, 13, 4684. [CrossRef]
27. Hayashi, M. The Target for Exploration of Deep High-Temperature Geothermal Reservoirs. J. Geotherm. Res. Soc. Jpn. 1982, 4,
81–90.
28. Yabusaki, S. Distribution of stable isotopes of oxygen and hydrogen in spring water and groundwater at Fukushima prefecture.
J. Cent. Reg. Aff. Fukushima Univ. 2016, 27, 31–41. (In Japanese)
29. Saito, M.; Imaizumi, H.; Ishii, Y.; Katoh, N.; Kitaoka, K. Tritium Concentration Table of Groundwater Recharge for Groundwater
Dating in Japan. Radioisotopes 2013, 62, 819–826. [CrossRef]
30. Yasukawa, K.; Noda, T. Geochemical criteria to evaluate hydraulic and thermal relationship between geothermal reservoir and
nearby hot spring aquifer. J. Geotherm. Res. Soc. Jpn. 2017, 39, 203–215. [CrossRef]
31. The R Project for Statistical Computing. Available online: https://www.R-project.org/ (accessed on 26 January 2021).You can also read