Sierra Nevada Memorial Hospital - 2013 Community Health Needs Assessment Summary Implementation Strategy and Community Benefit Plan
←
→
Page content transcription
If your browser does not render page correctly, please read the page content below
Sierra Nevada Memorial Hospital
 2013 Community Health Needs Assessment Summary
Implementation Strategy and Community Benefit Plan

Table of Contents

I. 2013 Sierra Nevada Memorial Hospital Community Health Needs Assessment
   Summary: An assessment of the Hospital’s Service Area in Nevada County
   conducted jointly by Sierra Nevada Memorial Hospital, Valley Vision and
   Community Stakeholders

      Description of the Community Served by the Hospital             3
      The Assessment Team                                             4
      How the Assessment was Conducted                                5
      Health Needs Identified                                         9
      Community Assets Identified                                    20

II.   Sierra Nevada Memorial Hospital Implementation Strategy and
      Community Benefit Plan Summary

      Summary                                                        21
      Target Areas and Population                                    21
      How the Implementation Strategy Was Developed                  22
      Major Needs and How Priorities Were Established                22
      Description of What Sierra Nevada Memorial Hospital
      Will Do to Address Community Needs                             24
      Action Plans                                                   24
      Next Steps for Priorities                                      26
      Priority Needs Not Being Addressed and the Reasons             26
      Approval                                                       26

Appendices

      Appendix A: List of Key Informants for Sierra Nevada Memorial Hospital CHNA

      Appendix B: Health Assets Table for Sierra Nevada Memorial Hospital Service Area

Attachment: 2013 Sierra Nevada Memorial Hospital Community Needs Assessment

                                                                                         2
2013 Sierra Nevada Memorial Hospital
Community Health Needs Assessment Summary:
An Assessment of the Hospital’s Service Area in Nevada County conducted jointly by Sierra
Nevada Memorial Hospital, Valley Vision and Community Stakeholders

Beginning in early 2012 through February 2013 an assessment of the health needs of residents
living in the service area of Sierra Nevada Memorial Hospital, a member of Dignity Health, was
completed by the Hospital, Valley Vision, Inc., and Community Stakeholders. The Hospital’s
service area lies within Nevada County, CA, known for its rural atmosphere and small town way
of life, and comprised of an estimated 75,000 residents. Except for Tahoe Forest Hospital in
Truckee, CA, which is located 70 miles away and provides only critical access, Sierra Nevada
Memorial Hospital is the sole hospital serving this region.

Description of Community Served by the Hospital

Defining the Hospital Service Area (HSA). Sierra Nevada Memorial Hospital’s HSA was
determined by analyzing patient discharge data. Dignity Health hospitals define the community
as the geographic area served by the hospital, considered its primary service area. This is based
on a percentage of hospital discharges and is also used in various other departments of the
system and hospital, including strategy and planning. The HSA identified for the focus of the
needs assessment is depicted in the map below.

               Map of Sierra Nevada Memorial Hospital service area

       Description of the Community. Nevada City, Grass Valley, Truckee and nine other
unincorporated cities make up Nevada County. National forests and state parks account for 63%

                                                                                                    3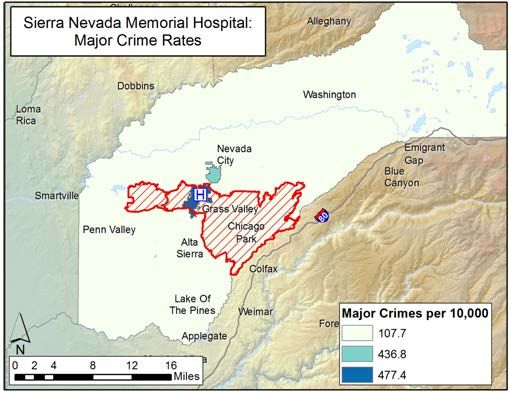
of all land in the county. Nevada County ranks 36th among the most populated counties in
California. Agriculture, forestry and fishing companies represent the largest business sectors in
the county, with small businesses of one to four employees most representative of the economy.
Of the estimated 75,000 residents, a large percentage is retired. There is a higher percentage
(20.6%) of residents 65 years of age, or older, living in Nevada County than in California’s
overall percentage (11.2%) of residents in this age demographic.

       Community Demographics. Within Sierra Nevada Memorial Hospital’s primary service
area demographics are as follows:

   •   Population
          o Under 18 = 18.8%
          o 18-34 = 16.3%
          o 35-64 = 44.4%
          o 65+ = 20.6%
   •   Diversity
          o Caucasian: 87.7%
          o Hispanic: 7.0%
          o Asian: 1.2%
          o African American: 0.4%
          o American Indian/Alaska Native & Other: 3.7%
   •   Average Income: $70,877
   •   Uninsured: 16.56%
   •   Unemployment: 5.0%
   •   No High School Diploma: 5.4%
   •   Renters: 21.9%
   •   Medicaid Patients: 10.42%

The Assessment Team

The Community Health Needs Assessment (CHNA) was conducted through a participatory team
process led by community benefit staff of Sierra Nevada Memorial Hospital, and Valley Vision,
Inc., a community service organization dedicated to improving quality of life in the greater
Sierra, Sacramento, and San Joaquin regions. Valley Vision (www.valleyvision.org) is a non-
profit 501(c)(3) research and consulting firm serving a broad range of communities across
Northern California. The organization’s mission is to improve quality of life through the delivery
of high-quality research on important topics such as healthcare, economic development, and
sustainable environmental practices. Using a community-based participatory orientation to
research, Valley Vision has conducted multiple CHNAs across an array of communities for over
seven years.

A team of experts from multiple sectors within the Hospital’s service area was assembled to
conduct the assessment, including: 1) a local public health expert with over a decade of
experience in conducting CHNAs; 2) a geographer with expertise in using GIS technology to

                                                                                                    4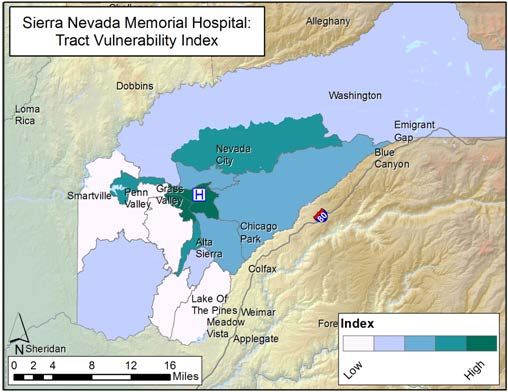
map health-related characteristics of populations across large geographic areas, and 3) local
public health practitioners and consultants to collect and analyze data.

         Community-Based Participatory Research Approach. The assessment followed a
community-based participatory research approach for identification and verification of results at
every stage of the assessment. This orientation built capacity and enabled beneficial change
within the Hospital CHNA workgroup, and the community members for which the assessment
was conducted. Including participants in the process allowed for a deeper understanding of the
results.

        CHNA Workgroup. The CHNA workgroup, comprised of Hospital community benefit
representatives, other health system, and Sierra Health Foundation, was an active contributor to
the CHNA process. Using the community-based participatory research approach, monthly
meetings were held with the workgroup at each critical stage in the assessment process. This
data, combined with demographical data, informed the location and selection of key informants
that participated in the assessment. Key informants included health and community experts such
as the Nevada County Public Health Officer, the Nevada County School District Superintendent,
and physicians and leaders of community health and social service organizations.

How the Assessment was Conducted

       “Health Need” and Objectives of the Assessment. The CHNA was anchored and
guided by the following objective:

       In order to provide necessary information for the Sierra Nevada Memorial Hospital
       community health improvement plan, identify communities and specific groups within
       these communities experiencing health disparities, especially as these disparities relate
       to chronic disease, and further identify contributing factors that create both barriers and
       opportunities for these populations to live healthier lives.

The World Health Organization defines health needs as “objectively determined deficiencies in
health that require health care, from promotion to palliation.” Building from this, the CHNA
used the following definitions for health need and driver:

       Health Need: A poor health outcome and its associated driver.

       Health Driver: A behavioral, environmental, and/or clinical factor, as well as more
       upstream social economic factors that impact health

        Methodology. The assessment used a mixed method data collection approach that
included primary data such as key informant interviews, community focus groups, and a

                                                                                                    5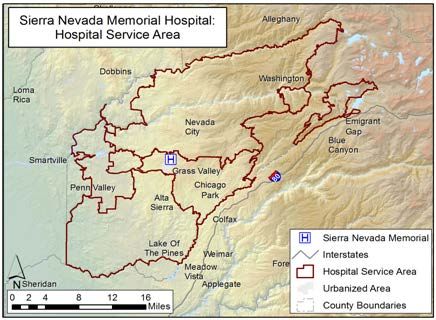
community assets assessment. Secondary data included health outcomes, demographic data,
behavioral data, and environmental data.

        Unit of Analysis and Study Area. The study area of the assessment included Sierra
Nevada Memorial Hospital’s service area. A key focus was to show specific communities
(defined geographically) experiencing disparities as they related to chronic disease and mental
health. To this end, zip code boundaries were selected as the unit-of-analysis for most indicators.
This level of analysis allowed for examination of health outcomes at the community level that
are often hidden when data are aggregated at the county level. Some indicators (demographic,
behavioral, and environmental in nature) were included in the assessment at the census tract,
census block, or point prevalence level, which allowed for deeper community level examination.

        Selection of Data Criteria. Criteria were established to help identify and determine all
data to be included for the study. Data were included only if they met the following standards:

   •   All data were to be sourced from credible and reputable sources
   •   Data must be consistently collected and organized in the same way to allow for future
       trending
   •   Data must be available at the zip code level or smaller

County, state, and Healthy People 2020 targets (when available) were used as benchmarks to
determine severity. All rates are reported per 10,000 of population. Health outcome indicator
data were adjusted using Empirical Bayes Smoothing, where possible, to increase the stability of
estimates by reducing the impact of the small number problem. To provide relative comparison
across zip codes, rates of Emergency Department (ED) visits and hospitalization for heart
disease, diabetes, hypertension, and stroke were age adjusted to reduce the influence of age.

       Primary Data - The Community Voice. Primary data collection included qualitative
data gathered in four ways:

   •   Input from the Dignity Health community benefit team
   •   Key informant interviews with area health and community experts
   •   Focus groups with area community members
   •   Community health asset collection via phone interviews and website analyses

        Key Informants. Key informants are health and community experts familiar with
populations and geographic areas residing within the Sierra Nevada Memorial Hospital’s service
area. To gain a deeper understanding of the health issues pertaining to chronic disease and
populations living in more vulnerable communities, seven key informants participated in the
CHNA process. Interviews were conducted with these informants using a theoretically grounded
interview guide. Each interview was recorded and content analysis was conducted to identify key
themes and important points pertaining to each HSA geographic area. Findings from these
interviews were also used to help identify communities most appropriate for focus groups. (See
Appendix A for a list of key informants, including professional title, and description of their
knowledge and expertise).

                                                                                                   6
Focus Groups. Members of the community representing subgroups, defined as groups
with unique attributes (race and ethnicity, age, sex, culture, lifestyle, or residents of a particular
area of the HSA), were recruited to participate in a focus group. A standard protocol was used
for the focus group to understand the experiences of these community members as they relate to
health disparities and chronic disease. One focus group was conducted that included 12
community member participants. Content analysis was performed on the focus group interview
notes to identify salient health issues affecting these community residents.

        Secondary Quantitative Data. Secondary quantitative data used in the assessment are
listed below in Tables 1 and 2.

Table 1: Health outcome data used in the CHNA reported as ED visits, hospitalization, and
mortality
             ED and Hospitalization                                      Mortality
       Accidents              Hypertension*            All-Cause Mortality*        Infant Mortality
        Asthma                Mental Health            Alzheimer’s Disease             Injuries
        Assault             Substance Abuse                  Cancer                Life Expectancy
                                                          Chronic Lower
        Cancer                     Stroke*                                          Liver Disease
                                                       Respiratory Disease
  Chronic Obstructive
                            Unintentional Injuries           Diabetes               Renal Disease
  Pulmonary Disease
                            Self-inflicted injury
       Diabetes*                                          Heart Disease                 Stroke
    Heart Disease*                                         Hypertension                 Suicide
*Age adjusted by 2010 California standard population

Table 2: Socio-demographic, behavioral, and environmental data profiles used in the CHNA
                                         Socio-Demographic
                Total Population                              Limited English Proficiency
                Family Make-up                                     Percent Uninsured
                 Poverty Level                       Percent over 25 with No Nigh School Diploma
                      Age                                         Percent Unemployed
                 Race/Ethnicity                                      Percent Renting
                                Behavioral and Environmental Profiles
                 Safety Profile                                Food Environment Profile
    • Major Crime                                      • Percent Obese/Percent Overweight
    • Assault                                         • Fruit and Vegetable Consumption (≥5/day)
    • Unintentional Injury                            • Farmers Markets
    • Fatal Traffic Accidents                         • Food Deserts
    • Accidents                                       • modified Retail Food Environment Index
                                                          (mRFEI)
              Active Living Profile                            Physical Wellbeing Profile
    • Park Access                                      • Age-adjusted Overall Mortality
                                                       • Life Expectancy
                                                       • Infant Mortality
                                                       • Health Care Professional Shortage Areas
                                                       • Health Assets

                                                                                                         7
Data Analysis - Identifying Vulnerable Communities. The first step in the process was
to examine socio-demographics in order to identify areas of the HSA with high vulnerability to
chronic disease disparities and poor mental health outcomes. Race/ethnicity, household make-up,
income, and age variables were combined into a vulnerability index that described the level of
vulnerability of each census tract. This index was then mapped for the entire HSA. A tract was
considered more vulnerable, or more likely to have higher unwanted health outcomes than
others, in the HSA if it had higher: 1) percent Hispanic or non-White population; 2) percent
single parent headed households; 3) percent below 125% of the poverty level; 4) percent under
five years old; and 5) percent 65 years of age or older living in the census tract. This information
was used in combination with input from the CHNA workgroup to identify prioritized areas for
which key informants would be sought. The vulnerability index for the HSA is shown below.
Sierra Nevada Memorial Hospital service area map of vulnerability
Where to Focus Community Member Input? Focus Group Selection. The selection
for the focus group was determined by feedback from key informants and analysis of health
outcome indicators (ED visits, hospitalization, and mortality rates). Due to the barriers of low
population density and lack of spaces for community members to congregate, qualitative data
collection emphasized key informants that serve area residents over focus groups.
8Identifying “Communities of Concern”: the First step in Prioritizing Area Health
Needs. To identify Communities of Concern, primary data from key informant interviews,
detailed analysis of secondary data, health outcome indicators, and socio-demographics were
examined. Zip code communities with rates that exceeded county, state, or Healthy People 2020
benchmarks for ED utilization, hospitalization, or mortality were considered. The health outcome
data analysis was triangulated with primary data and socio-demographic data to identify specific
Communities of Concern.
What is the Health Profile for Communities of Concern? What are the Prioritized
Health Needs of the Area? Data on socio-demographics of residents living in these
communities, which included socio-economic status, race and ethnicity, educational attainment,
housing status, employment status, and health insurance status, were examined. Area health
needs were determined via in depth analysis of qualitative and quantitative data, and then
confirmed by socio-demographic data. As noted earlier, a health need was defined as a poor
health outcome and its associated driver. A health need was included as a priority if it was
represented by rates worse than the established quantitative benchmarks or was consistently
mentioned in the qualitative data.
Health Needs Identified
Analysis of data revealed two Communities of Concern listed in Table 3.
Table 3: Identified Communities of Concern for Sierra Nevada Memorial Hospital Service Area
Zip Community Name County 2010 Population*
95945 Grass Valley Nevada 25,199
95975 Rough and Ready Nevada 1,769
Total population 26,968
(*Source: 2010 Census data)
The Sierra Nevada Memorial Hospital service area is made up of six zip codes in the western
part of Nevada County and is home to approximately 75,000 residents. Based on an analysis of
socio-demographic characteristics and health outcome data at the zip code level, 95945 and
95975 were identified as Communities of Concern. Nearly 27,000 residents live in these two zip
code Communities of Concern. While many of the socio-demographic characteristics and health
outcome variables indicate that these areas as highly vulnerable and have high rates of negative
health outcomes, there are pockets within other zip codes in the HSA that display similar
characteristics and health outcomes. Therefore, it should be stated that other Communities of
Concern exist outside of these two zip codes and are dispersed throughout the HSA, but are not
easily identified by zip code boundaries (e.g. elderly who may live in or near of Nevada City or
low-income families that reside in or near Penn Valley).
9Socio-demographic Profile of Communities of Concern. Table 4 below displays data
that serve to describe the socio-demographic profile of the two zip code Communities of
Concern. Values and rates in bold indicate those that exceed any of the reported benchmarks.
Table 4: Socio-demographic characteristics for Sierra Nevada Memorial Hospital Communities
of Concern compared to national and state benchmarks
% Households in poverty
% Families in poverty w/
% over 25 with no high
% Non-White Hispanic
% No health insurance
% Families in poverty
% over age 5 with
school diploma
limited English
over 65 headed
female headed
employed
Renting
% Un-
kids
%
95945 7.4 13.9 30.9 7.6 14.9 0.9 8.1 24.6 49.7
95975 12.0 16.2 26.1 6.0 18.7 0.1 15.5 23.5 19.8
National 8.7 15.1 31.2 12.9 -- 8.7 7.9 16.3 --
State -- -- -- 19.4 -- -- 9.8 21.6 --
(Source: Dignity Health Community Benefit, CNI data, 2011)
An examination of social determinants of health indicated that both zip codes displayed rates that
exceeded certain benchmarks. For example, 95975 had 16% unemployment, surpassing both the
state and national rates. Zip code 95975 had 12% of households over 65 living in poverty and
16% of households of families living in poverty, both higher than national benchmarks. Both zip
codes had a higher rate of residents without health insurance compared to the state and national
benchmarks, with 95945 at 25% and 95975 at 23%.
Priority Health Needs. The health needs identified through analysis of both quantitative
and qualitative data are listed below. All needs are noted as a “health driver,” or a condition or
situation that contributed to a poor health outcome. Health outcome results follow the list below.
See Appendix G for a detailed list of health needs, including health outcomes and their
associated drivers, identified within the HSA.
• Lack of access to primary care and preventive services
• Lack of integration of behavioral health and primary care
• Transportation issues and limitations
• Limited access to healthy foods, food security
• Lack of access to specialty care
• Lack of dental care
• Lack of access to mental health services
• Eligibility requirements for Medi-Cal and other social services
• Lack of access to outdoor and recreational activities
• Lack of access to physical therapy
10Health Outcomes - Diabetes, Heart Disease, Stroke, and Hypertension. Diabetes,
heart disease, stroke, and hypertension were consistently mentioned in the qualitative data as
conditions affecting many area residents. When asked about the biggest health issues within the
community, one key informant stated, “… diabetes, hypertension, heart disease are big players
for us. As you get into folks from financially disadvantaged areas you start to get higher
incidents of things like diabetes, obesity, those kind of things” (KI_Nevada_1). An examination
of health outcome data related to these conditions is shown in Tables 5-8 below.
Table 5: Mortality, ED visit, and hospitalization rates for diabetes compared to county, state and
Healthy People 2020 benchmarks (rates per 10,000 population)
Zip Code Mortality ED Visits Hospitalization
95945 1.9 228.9 153.8
95975 2.1 111.3 99.9
Diabetes Nevada County 1.6 126.9 95.1
CA State 1.8 188.4 190.9
Healthy People 2020 6.6 -- --
(Sources: Mortality, CDPH 2010; ED visits and hospitalization, OSHPD, 2011)
An examination of mortality due to diabetes reveals both zip codes have rates higher than county
and state benchmarks. Zip code 95945 had a rate of ED visits due to diabetes of 228.9 per
10,000, clearly higher than Nevada County rate of 126.9 per 10,000. Rates in 95945 were
drastically higher in Blacks at 2260.0 diabetes related ED visits per 10,000 compared to Whites
at 309.4 visits, and Hispanics at 197.4 visits. Whites were the only group to have a rate of ED
visits related to diabetes in 95975 at 144.0 visits per 10,000, above the county benchmark. The
rate of hospitalizations due to diabetes in 95945 was highest in Blacks at 451.4 per 10,000, a rate
more than twice the state benchmark. The rate for ED visits in Whites was 267.0 per 10,000 in
this zip code. Again Whites were the only group to have a rate of hospitalizations due to diabetes
in the 95975 zip code of 141.2 per 10,000.
Table 6: Mortality, ED visit and hospitalization rates for heart disease compared to county, state
and Healthy People 2020 benchmarks (rates per 10,000 population)
Zip Code Mortality ED Visits Hospitalization
95945 33.4 103.4 243.9
95975 14.0 68.8 185.5
Heart Disease Nevada County 15.2 69.7 177.7
CA State 11.5 93.1 218.4
Healthy People
2020 10.1 -- --
(Sources: Mortality, CDPH 2010; ED visits and hospitalization, OSHPD, 2011)
Mortality due to heart disease was more than twice the county rate in zip code 95945, at 33.4 per
10,000 compared to 15.2 per 10,000. Zip code 95945 also had higher rates of ED visits and
hospitalizations due to heart disease compared to county and state benchmarks. Rates for ED
visits related to heart disease in 95945 were highest in Whites at 205.6 visits followed by Asian
Pacific Islanders at 47.2 visits, and Native Americans at 40.7 visits. Whites were the only group
to have a rate of ED visits related to heart disease in 95975 at 118.6 visits per 10,000. The rate of
11hospitalizations due to heart disease in 95945 was highest in Whites at 291.6 per 10,000,
compared to the rate in Hispanics at 112.0 per 10,000.
Table 7: Mortality, ED visits, and hospitalization rates for stroke compared to county, state and
Healthy People 2020 benchmarks (rates per 10,000 population)
Zip Code Mortality ED Visits Hospitalization
95945 10.5 15.9 56.1
95975 3.9 11.0 45.3
Stroke Nevada County 6.0 12.6 45.0
CA State 3.5 16.2 51.8
Healthy People
2020 3.4 -- --
(Sources: Mortality, CDPH 2010; ED visits and hospitalization, OSHPD, 2011)
While both Communities of Concern demonstrated mortality rates due to stroke that surpassed
the state benchmark, zip code 94945 had a mortality rate due to stroke that was three times the
state rate. An examination of rates of ED visits and hospitalizations for stroke showed that rates
in 95945 exceeded Nevada County rates.
Table 8: ED visit and hospitalization rates for hypertension compared to county and state
benchmarks (rates per 10,000 population)
Zip Code ED Visits Hospitalization
95945 308.6 395.8
Hypertension 95975 210.4 251.2
Nevada County 192.6 275.0
CA State 365.6 380.9
(Source: OSHPD, 2011)
Both Communities of Concern had rates of ED visits for hypertension higher than the Nevada
County rate. Zip code 95945 also had a rate of hospitalization for hypertension that surpassed the
state rate.
Mental Health and Substance Abuse. Area experts and community members
consistently reported the struggle HSA residents had at maintaining positive mental health and
accessing treatment for mental illness. Such struggles ranged from overall daily coping in the
midst of personal and financial pressures, to the management of severe mental illness requiring
needed in-patient treatment and medications for care. Table 9 provides data on ED visits and
hospitalizations related to mental health.
12Table 9: ED visit and hospitalization rates due to mental health issues compared to county and
state benchmarks (rates per 10,000 population)
Zip Code ED Visits Hospitalization
95945 241.0 352.7
Mental Health
(overall) 95975 57.5 128.0
Nevada County 131.7 192.8
CA State 130.9 182.1
(Source: OSHPD, 2011)
Community of Concern zip code 95945 had rates of ED visits and hospitalizations for mental
health issues that nearly twice exceeded county and state benchmarks.
In addition to mental health issues, rates of ED visits and hospitalization due to self-inflicted
injury were examined.
Table 10: ED Visit and hospitalization rates due to self-inflicted injury compared to specific
county and state benchmarks (rates per 10,000 population)
Zip Code ED Visits Hospitalization
95945 15.6 9.1
Self-Inflicted
95975 0.0 4.6
Injury
Nevada County 9.1 6.2
CA State 7.9 4.4
(Source: OSHPD, 2011)
Area experts mentioned isolation as a concern for people at risk of suicide. Zip code 95945 had
rates of ED visits and hospitalizations due to self-inflicted injury higher than the county and state
benchmarks. Key informants identified areas such as Penn Valley, the outskirts of Nevada City,
and North San Juan as having populations of elderly individuals who may not have family in the
area and who might have minimal contact with other area residents. It was discussed that this
lack of social interaction could be a contributing factor for mental health issues and suicide.
Area experts and focus group participants also mentioned the lack of public space and areas
where the community can gather and engage with others, which might also contribute to
isolation and related negative health outcomes. As Table 11 shows, rates of substance abuse-
related ED visits and hospitalization were clearly elevated in the Communities of Concern.
Table 11: ED visit and hospitalization rates due to substance abuse issues compared to county
and state benchmarks (rates per 10,000 population)
Zip Code ED Visits Hospitalization
Mental Health- 95945 717.4 295.9
Substance 95975 375.1 181.7
Abuse Nevada County 363.1 174.5
CA State 232.0 143.8
(Source: OSHPD, 2011)
13Both Communities of Concern had rates of ED visits and hospitalizations due to substance abuse
that were above county and state benchmarks. The rates for substance abuse in zip code 95945
were more than three times the state benchmark for ED visits and more than two times the state
benchmark for hospitalizations. Qualitative data supported these findings, with one key
informant stating, “We also recognize a significant impact on health from substance abuse
issues, be it opiates or pain meds. Marijuana, alcohol, always a big one” (KI_Nevada_1).
Respiratory Illness: Chronic Obstructive Pulmonary Disease (COPD) and Asthma.
In an effort to understand the impact of tobacco use and respiratory illness in the Communities of
Concern, rates of ED visits and hospitalization related to chronic obstructive pulmonary disease
(COPD), asthma, and bronchitis were examined and are displayed in Table 12. Rates of ED visits
and hospitalization due to asthma are examined independently in Table 13.
Table 12: ED Visits and Hospitalization due to COPD, asthma, and bronchitis compared to
county and state benchmarks (rates per 10,000 population)
Zip Code ED Visits Hospitalization
95945 369.8 322.6
COPD, Asthma,
95975 177.1 182.1
Bronchitis
Nevada County 201.2 201.9
CA State 202.3 156.8
(Source: OSHPD, 2011)
Table 13: ED Visit and hospitalization rates due to asthma compared to county and state
benchmarks (rates per 10,000 population)
Zip Code ED Visits Hospitalization
95945 176.7 97.8
Asthma 95975 68.6 65.0
Nevada County 95.7 70.4
CA State 134.9 70.5
(Source: OSHPD, 2011)
In zip code 95945, rates of ED visits and hospitalizations related to COPD and asthma were
higher than the county and state benchmarks. The hospitalization rate for COPD, asthma, and
bronchitis in 95945 was double the state rate, at 322.6 per 10,000 compared to 156.8 per 10,000.
The ED visit rate due to asthma in 95945 was nearly double the Nevada County rate.
Behavioral and Environmental - Safety Profile. Examination of safety indicators
included examining local law enforcement data reported by police and sheriff’s departments in
the area. In addition, rates of ED visits and hospitalizations due to assault and unintentional
injury were examined.
Crime Rates. The following map shows major crimes by municipality as reported by
various jurisdictions. Darker colored areas denote higher rates of major crime, including
homicide, forcible rape, robbery, aggravated assault, burglary, motor vehicle theft, larceny, and
arson.
14Major crimes by municipality as reported by California Attorney General’s Office,
2010
Zip codes 95945 and 95959 are located in two separate municipalities which include the Grass
Valley Police Department and the Nevada City Police Department. The crime rate for the City of
Grass Valley is 477.4 crimes per 10,000 residents compared to Nevada City at 436.8. Portions of
95945 and 95959 are also included in the Nevada County Sheriff’s Department with a crime rate
of 107.7 per 10,000 residents, which is also lower than the neighboring counties of Placer and
Yuba with rates of 193.6 and 212.6 per 10,000 residents, respectively.
Assault and Unintentional Injury. As an additional indicator of safety within the
Communities of Concern, ED visit and hospitalization rates for assault were examined.
Table 14: ED visits and hospitalization rates due to assault compared to county and state
benchmarks (rates per 10,000 population)
Zip Code ED Visits Hospitalization
95945 37.1 2.5
Assault 95975 28.6 0.0
Nevada County 22.3 2.3
CA State 29.5 3.9
(Source: OSHPD, 2011)
15Both Communities of Concern had rates of ED visits due to assault that surpassed the Nevada
County benchmark. As Table 14 indicates, zip code 95945 exceeded the county benchmarks for
both rates of ED visits and hospitalizations due to assault.
Unintentional Injury. As the fifth leading cause of death in the nation and the first
leading cause in those under the age of 35, examining rates of unintentional injuries was
important.
Table 15: Mortality, ED visits and hospitalization rates due to unintentional injury compared to
county and state benchmarks (rates per 10,000 population)
Zip Code ED Visits Hospitalization
Mortality
95945 4.1 1466.7 369.5
Unintentional 95975 3.1 919.6 183.3
Injury
Nevada County 4.0 948.6 244.7
CA State 2.7 651.8 154.6
Healthy People 2020 3.6 -- --
(Sources: Mortality, CDPH 2010; ED visits and hospitalization, OSHPD, 2011)
As Table 15 displays, both zip code Communities of Concern surpassed the state rates of
mortality, ED visits, and hospitalization due to unintentional injury. The rate of ED visits due to
unintentional injury was notably high in 95945, at 1,466.7 per 10,000, more than double the state
rate. The hospitalization rate for unintentional injury in 95945 was twice the state rate.
Fatality/Traffic Accidents. The following map displays the locations of traffic accidents
that resulted in a fatality. Only those locations of traffic accidents resulting in a fatality located
within HSA are noted, and accidents beyond the HSA boundaries are not shown. Table 16 shows
bicycle accidents and accidents involving a motor vehicle versus a pedestrian or bicyclist.
Accidents resulting in a fatality, especially those on city streets, contribute to the perception of
safety area residents feel when traveling through their community, particularly for area residents
that rely on public, pedestrian, and/or bicycle travel. Both area experts and community members
in the HSA stated that access to services and care is largely dependent on adequate transportation
and many residents’ access services by walking, biking, or taking local, sporadically available
public transportation.
16Traffic accidents resulting in fatalities as reported by the National Highway
Transportation Safety Administration, 2010
As shown in map above, most fatal traffic accidents in the HSA took place on the highways in
the area; however two accidents occurred on smaller streets close to town centers.
Table 16: ED visit and hospitalization rates for accidents compared to county and state
benchmarks (rates per 10,000 population)
Zip Code ED Visits Hospitalization
95945 19.1 1.3
Accidents
95975 18.3 2.3
Nevada County 16.0 1.5
CA State 15.6 2.0
(Source: OSHPD, 2011)
Zip code 95975 had rates of ED visits and hospitalization due to bicycle accidents and accidents
involving an automobile and a bicyclist or pedestrian which exceeded county and state
benchmarks.
Food Environment. An examination of the food environment in the Communities of
Concern is shown in Table 17. Approximately 50% of residents within the Communities of
Concern reported not eating at least five servings of fruits or vegetables daily as recommended
by the state. While zip code 95945 had one farmers’ market, it also contains a federally
designated food desert tract. Such tracts are designated by the federal government as census
tracts in which 33% of the population or more than 500 people have low access to healthy food.
17Table 17: Percent obese, percent overweight, percent not eating at least five fruits and vegetables
daily, presence (X) or absence (-) of federally defined food deserts, and number of farmers
markets
% % % no Food Farmers
Zip Code
Obese Overweight 5-a-day Desert Markets
Food
95945 20.0 34.7 50.3 X 1
Environment
95975 21.2 36.1 49.3 - 0
CA State 24.8 -- -- -- --
[Sources: % Obese & overweight, fruit & vegetable consumption: Healthy City
(www.healthycity.org), 2003-2005; Food deserts: Kaiser Permanente CHNA Data Platform/US
Dept. of Agriculture, 2011; Farmers markets: California Federation of Certified Farmers
Markets, 2012]
Residents and area experts stated that accessing healthy foods may be an issue due to
affordability and difficultly of getting to and from markets. Long drives and limited public transit
become increasing issues the further away residents live from the town centers of Grass Valley
or Nevada City. The following map shows the modified Retail Food Environment Index
(mRFEI), which is the proportion of healthy food outlets to all available food outlets by census
tract. Lighter areas indicate greater access to health foods and the darkest areas indicate no
access to healthy foods.
Modified Retail Food Environment Index (mRFEI) by census tracts for HSA
An examination of mRFEI data indicated that much of the area within the Communities of
Concern is categorized as having good access to healthy food. However, other areas within the
HSA are categorized as having no healthy retail outlets.
18Active Living. One of the largest barriers to engagement in physical activity is access to
recreational areas. The following map profiles the percent of the population in census tracts that
live within one-half mile of a recreational park.
Percent population living in census tract within one-half mile of park space (per
10,000)
Zip code 95945 had the census tract with the highest percent of residents, over one-third, living
within one-half mile of a park. However, the vast majority of the HSA has very limited access to
parks. The HSA is surrounded by recreational activities and very close to the Tahoe National
Forest. Despite this, area experts stated that these recreational opportunities are not accessible to
low-income families or the elderly, who may not have the equipment to enjoy activities such as
hiking, biking, or kayaking.
Physical Wellbeing. Age-adjusted all-cause mortality rates are a significant indicator of
the health of a community. Zip code 95945 had the highest age-adjusted overall mortality rate in
the SNMH HSA at 67.6 deaths per 10,000. Life expectancy data showed that the Communities of
Concern had a lower life expectancy at birth compared to other zip codes in the HSA; however,
the overall life expectancy was comparable or slightly better than that of the state benchmark.
The infant mortality rate of zip code 95945 matched that of the state, at 5.2 deaths per 1,000 live
births.
19Table 18: Age-adjusted all-cause mortality rate, life expectancy at birth, and infant mortality rate
(all-cause mortality rate per 10,000 populations; infant mortality rate per 1,000 live births)
Age-Adjusted
Zip Code All-Cause Life expectancy Infant Mortality
Mortality
95945 67.6 78.5 5.2
95975 60.3 80.2 0.0
Nevada County 61.5 -- 3.6
CA State 63.3 78.6 5.2
National -- 80.4 --
Healthy People 2020 -- -- 6.0
(Sources: 2010 CDPH and 2010 Census data; rates calculated)
Community Assets Identified
Communities require resources in order to maintain and improve their health. These include
health related assets such as access to health care professionals and community-based
organizations. An assessment of these resources revealed nearly 40 assets that provide Sierra
Nevada Memorial Hospital opportunities for partnership in addressing some of the health needs
identified in this report. A listing of health assets in the HSA can be found in Appendix B.
20Sierra Nevada Memorial Hospital
Implementation Strategy and Community Benefit Plan
Summary for FY 2013 – 2015
Sierra Nevada Memorial Hospital has been meeting the health needs of residents in its Nevada
County community for over 50 years. A part of western Nevada County since 1958, the Hospital
carries out its mission daily, contributing to the wellness of its community through the provision
of quality services delivered in a compassionate and cost effective manner, and collaborating
with others in the community to improve quality of life.
The Hospital has 870 employees and offers 121 licensed acute care beds and 18 emergency
department beds, and has continued to expand services over the years to meet the growing needs
of its community. An Ambulatory Treatment Center was added in the 1990s, created specifically
for patients with chronic illnesses and other ongoing outpatient care needs. In more recent years,
the Hospital opened the Sierra Nevada Diagnostic Center. The Hospital’s Cancer Center is
nationally accredited by the Commission on Cancer of the American College of Surgeons as a
Community Cancer Program, and its Primary Stroke Center has earned the Gold Seal of
Approval from the Joint Commission for Primary Stroke Centers.
This report summarizes the plans for Sierra Nevada Memorial Hospital to sustain and build upon
community benefit programs that address priority health needs identified in the 2013 Community
Health Needs Assessment (CHNA), and to engage with the community in developing new
offerings that respond to needed care and services.
Target Areas and Populations
Specifically, the 2013 CHNA identified two of the six zip codes within Sierra Nevada Memorial
Hospital’s service area as Communities of Concern. Nearly 27,000 residents live within these
two zip codes - 95975 and 95945 – which encompass the communities of Grass Valley and
Rough and Ready. Both zip codes displayed rates for unemployment that surpassed state and
national rates, and both were higher than national benchmarks for poverty. More residents in
these zip codes had no health insurance as compared to state and national benchmarks. Higher
rates of chronic illness were identified within both zip codes. There were more than double the
number of emergency department visits and hospitalizations in these two zip codes as compared
to zip codes in the service area due to diabetes and heart disease. Stroke, hypertension, COPD
and asthma were also greater concerns for residents in these two communities. Mental health
illness in these two zip codes was significantly higher, with cases that nearly twice exceeded
county and state benchmarks. The problems of substance abuse, self-inflicted injury, and suicide
were also greater. Within these two zip codes, the CHNA also showed that there was low access
to healthy foods.
A priority for Sierra Nevada Memorial Hospital is to focus on populations with the greatest need;
thus more emphasis on addressing health issues in these two zip codes is a target area of focus
for community benefit planning and implementation for the Hospital.
21How the Implementation Strategy Was Developed
The 2013 CHNA informed Sierra Nevada Memorial Hospital’s implementation plan, along with
a review and evaluation of existing community benefit programs and services. In developing the
CHNA, the Hospital took a leadership role, engaging the services of Valley Vision, a
community-based nonprofit research and consultant group, and involving a variety of experts
from the public health field, as well as a geographer with experience using GIS technology to
map health-related characteristics of populations across large areas, and other public health
practitioners. The assessment followed a community-based participatory research approach for
identification and verification of results at every stage of the assessment. This orientation built
capacity and enabled beneficial change within the Hospital CHNA workgroup, and the
community members for which the assessment was conducted. Including participants in the
process allowed for a deeper understanding of the results. Key informants for the CHNA
included community leaders with significant knowledge and expertise; Nevada County Public
Health Officer, Nevada County School District Superintendent; physicians; and leaders of
community health and social service agencies among them.
Findings from the new 2013 CHNA, completed in late March 2013, will be presented in various
community forums, and shared with health providers, organizations, community leaders and
public officials. Sierra Nevada Memorial Hospital established a leadership team to determine
how best to enhance services to respond to priority needs, and to develop a plan of action.
Major Needs and How Priorities Were Established
The 2013 CHNA provided a baseline for establishing priorities. The CHNA process involved a
rigorous community-based participatory research approach that engaged both public health
experts and community members, utilizing a mixed method data collection methodology that
included primary and secondary data collection. Primary data were compiled from key informant
interviews, community focus groups, and the community assets assessment process. Secondary
data included health outcomes, demographic data, behavioral data, and environmental data. Ten
health needs specifically, were identified as priority health needs in the CHNA:
1. Lack of access to primary care and preventive services
2. Lack of integration of behavioral health and primary care
3. Transportation issues and limitations
4. Limited access to healthy foods, food security
5. Lack of access to specialty care
6. Lack of dental care
7. Lack of access to mental health services
8. Eligibility requirements for Medi-Cal and other social services
9. Lack of access to outdoor and recreational activities
10. Lack of access to physical therapy
22The CHNA revealed priority health needs were greatest in two Communities of Concern - zip
code 95975 and 9594 - which represent nearly 27,000 residents in the communities of Grass
Valley and Rough and Ready.
The Leadership Team at Sierra Nevada Memorial Hospital went through a process of review and
evaluation to compare the CHNA findings to community benefit programs and services currently
being offered by the Hospital, and to determine gaps in services that required attention. Each
CHNA priority health need was weighed against criteria that included:
• How does what the Hospital experiences from an Emergency Department and inpatient
admissions standpoint correspond to the CHNA
• What is being done currently by the Hospital in response to the identified priority health
needs
• What health needs are other community-based provider organizations currently
addressing
• Where are there gaps in care
• Which gaps reflect the greatest risk for residents
• Where are these gaps greatest
• In addition to the significant charity care, Medi-Cal, other government-funded programs,
and community services being provided, what level of resources might be available by
the Hospital to expand or develop new initiatives to respond to these gaps
• How might the Hospital collaborate with the community to best leverage resources to
better meet health needs
• What community provider partners are available
• Which priority health needs align most with the clinical expertise of the Hospital
When comparing current community benefit programs and services offered at Sierra Nevada
Memorial Hospital to the findings in the CHNA, the Hospital is currently responding to a
number of priority health needs. In addition to charity care, care for the indigent, and un-funded
care to the Medi-Cal population, the Hospital’s core community services address those priority
health needs concerning 1) the need for greater access to primary and preventative services, with
major emphasis on chronic disease prevention and self-management; 2) the need to integrate
behavioral health and primary care; 3) the need for transportation; and, 4) the need to support
residents with eligibility requirements for Medi-Cal and other social services. The Hospital will
continue to address these priorities, while implementing plans that:
• Place specific attention on the two Communities of Concern to ensure residents in these
communities can access, and benefit from, services and programs
• Expand collaboration within the community’s safety net to increase access to care
• Determine community assets and ways to collaborate with community-based nonprofit
mental health providers
• Redesign the annual Dignity Health Community Grants Program to build capacity for
greatly needed health and health-related services
• Expand community outreach to ensure awareness of, and increase participation in,
chronic disease prevention and self-management educational offerings, particularly
diabetes and heart disease
23Description of What Sierra Nevada Memorial Hospital
Will Do to Address Community Needs
The Sierra Nevada Memorial Hospital leadership team will continue to meet on a regular
basis, and identify stakeholders in the community who have expertise in those areas identified
as priorities. Specific actions in conjunction with the current community benefit services
offered by the Hospital are outlined below.
Action Plans
1. Lack of Access to Primary Care. Sierra Nevada Memorial Hospital has a leadership
role on the board of the principle Federally Qualified Health Center in the region,
Western Sierra Medical Clinic. The Hospital supports this center’s current efforts to serve
as a primary health care home to the underserved. To provide much needed space (one
contributor to poor access identified through qualitative data in the CHNA) the Hospital
has enabled the Clinic to utilize hospital-owned facilities in Grass Valley for additional
capacity at a reduced rate. The Hospital will continue to work closely with Western
Sierra Medical Clinic to increase focus on access to care, particularly within the two
Communities of Concern. The Hospital also strives to ensure patients in need of a
primary care provider are given timely referrals to the Clinic prior to discharge.
A. Satellite Lab and X-Ray Clinic.
The Hospital is opening a new satellite lab and x-ray clinic located in Penn Valley, in the
vicinity of Rough and Ready, one of the Communities of Concern identified in the
CHNA. This outpatient facility will significantly enhance access to medical services.
Key informants in the CHNA voiced the difficulties many residents within the
community have in obtaining lab and x-ray tests.
2. Lack of Access to Preventative Services. The Hospital is one of the few providers in the
region addressing the need for health education that focuses on disease prevention and
management of chronic disease. Through the Hospital’s Wellness Education department,
thousands of residents have been served over the past 15 years, receiving the necessary
resources and skills to control health conditions and lead healthier lives. In addition,
annual blood screenings are provided. The Hospital will continue to provide these
priority services, and focus on outreach efforts to increase awareness and participation by
residents within the two Communities of Concern. In particular, main conditions that
were raised consistently as priority health issues in CHNA qualitative data included
diabetes, hypertension, and heart disease. Sierra Nevada Memorial Hospital is working to
provide services to address these conditions in several ways:
The best practice health intervention CHAMP® (Congestive Heart Active Management
Program) model provides assistance and support to those with heart disease. Sierra
24Nevada Memorial Hospital implemented this program when it was determined to be a
health priority in the region some years ago. Heart failure is a major cause of
hospitalization for residents within the HSA. The program provides ongoing clinical
support to those with heart failure, and provides medication monitoring and education. It
aims to help those suffering from heart failure live healthier, more active lives, and
reduce avoidable hospital admissions. Complementary to CHAMP®, the Hospital offers
cardiac rehabilitation programs and classes specifically focused on the underserved who
would not otherwise have access to such services.
Diabetes: Take Control! is an active and growing program focused on education and
nutrition counseling to enable residents to better manage this chronic condition, stay
healthy, and avoid hospitalizations for uncontrolled symptoms.
Better Breather and Pulmonary Rehabilitation, and Smoking Cessation classes are
also offered, responding to the chronic diseases of Chronic Obstructive Pulmonary
Disease and Asthma, which was also shown to be prevalent in the CHNA.
A. Building Capacity for Preventative Services
Collaborative efforts are underway by the Hospital with Western Sierra Medical Clinic to
increase access to preventative services. The Hospital is training key members of the
Clinic’s staff to be able to provide education and to facilitate chronic disease self
management classes, extending the reach of these programs in the region, and in
particular to Communities of Concern.
3. Lack of mental health services and substance abuse treatment. Sierra Nevada
Memorial Hospital recognizes the major gap in services for mental health care, and the
high substance abuse problem in the region, and is responding through collaborative
measures that build capacity in the community for services addressing these needs.
A. Building Capacity for Mental Health and Substance Abuse Treatment through
Collaboration.
Sierra Nevada Memorial Hospital is in the process of redesigning its annual Dignity
Health Community Grants Program to focus on creating strategic partnership programs
within the nonprofit community that target underserved individuals in need of mental health
care and/or substance abuse treatment. Through the grants program, agencies will work
together to ensure coordinated care and the continuum of support necessary to improve the
health and quality of life for those they serve. Emphasis will also be placed on developing
methods for measuring program outcomes.
4. Lack of Access to Specialty Care. The Hospital continues to grow its Nurse Navigator
and peer support programs within its existing service lines, particularly for stroke victims.
Stroke, specifically among the large elderly male population in the region, was identified as a
high-risk health issue in the CHNA. The Hospital is also developing a lung cancer screening
program to respond to the growing prevalence of lung cancer, which was indicated in the
CHNA as an increasing concern.
255. Unintentional injury. Quantitative data from the CHNA reflected that ED visits for
unintentional injury is far greater within the Hospital's service area when compared to state
rates. A significant contributing factor for this high rate is due to falls among the large
elderly population in the region. Falls prevention classes are offered, and the Hospital is
involved in the Falls Prevention Coalition of Nevada County, an organization dedicated to
reducing the risk of falls through education.
6. Eligibility Requirements for Medi-Cal and other Social Services. Sierra Nevada
Memorial Hospital’s active Enrollment Assistance program is directly aligned with this
CHNA priority. The program identifies patients without insurance and navigates them
through the complicated and often confusing enrollment process.
Sierra Nevada Memorial Hospital will continue to provide core community benefit services that
are directly responding to other priority health needs, including:
1. Transportation and Medication. The Hospital assesses and provides transportation for
those with no means to travel, and provides medications to patients who cannot afford to
purchase them.
2. Professional Health Education. Sierra Nevada Memorial Hospital provides educational
training opportunities for future workforce expansion needed to expand access to care in
the region. Student nurses work with preceptors in the Hospitals inpatient unit on a
continuous basis.
3. Cancer and Traumatic Brain Injury Support Groups. Support groups offered by the
Hospital provide education, and help those in the community and their family members
cope with cancer and brain injuries.
4. Alzheimer’s Outreach Program. In response to a growing need to assist patients, their
families and caregivers with Alzheimer’s, SNMH’s Home Care Department provides an
Alzheimer’s Outreach Program that serves as a community education, resource and
support center. Alzheimer’s is particularly prevalent among the growing elderly residents
within Nevada County. A licensed Social Worker is dedicated to the program, which
offers a variety of services, including ongoing “Yes I Can” courses that teach caregivers
and families how to provide quality care for those with Alzheimer’s still living at home,
and Caregiver Support Groups. The program provides education and caregiver support
via home visits and through consultations and serves to link those in need to important
resources and assisted living/care centers.
Next Steps for Priorities
For each of the priority areas listed above, Sierra Nevada Memorial Hospital will work with
established partners, and build new partnerships with others in the community to create
opportunities for collaboration and capacity building. Emphasis will be placed on developing
methodologies for measuring goals and objectives in order to more accurately measure health
outcomes. Attention will be given to outreach within the two Communities of Concern.
26Priority Needs Not Being Addressed and the Reasons Why
The Hospital responds to priority health needs in many ways, and in times that are critical for
patients in crisis. In addition to charity care, indigent care, and un-funded care for Medi-Cal
patients, a significant number of programs and services offered address the priority needs
identified in the 2013 CHNA. The needs of Nevada County are monumental, and as the sole
hospital serving this expansive rural region, Sierra Nevada Memorial Hospital does not have the
resources available to develop and/or duplicate initiatives to meet every priority need identified,
which makes collaboration with community assets critical. The County Public Health
Department and other community-based nonprofit organizations for instance, are providing
mental health services. Community Recovery Resources directly responds to the issue of
substance abuse, and in fact, is building a new inpatient treatment facility. The City of Grass
Valley and Nevada City offer weekly farmers markets, making fresh foods available at an
affordable cost to residents.
27Appendix A: List of Key Informants for Sierra Nevada Memorial Hospital CHNA
Area Name & Title Agency Area of Expertise
Nevada Dr. Frank J. Lang, Jr., Miners Community Clinic, Community Health
County Physician Inc.
Nevada Dr. Karen L. Milman, Nevada County Health and Community Health
County Public Health Officer Human Services
Nevada Dr. Dawn Harris, Physician Emergency Medical Community Health
County Physician, Sierra Nevada
Memorial Hospital
Nevada Ariel Lovett, Deputy Community Recovery Community Health
County Director Resources
Nevada Kim Parker, Executive Sierra Hospital Memorial Community Health
County Director Hospital Foundation
Nevada Holly Hermansen, Nevada City Unified Community Health,
County Superintendent, Nevada School District Youth & Adolescent
County Schools Health
Shelly Sexton, Nevada
County SELPA
Administrator
28You can also read