SIFMA Insights: US Equity Market Structure Primer
←
→
Page content transcription
If your browser does not render page correctly, please read the page content below

SIFMA Insights:
US Equity Market Structure Primer

July 2018
Executive Summary

Contents
Executive Summary ................................................................................................................................................................................... 4
Drivers of Market Volumes ......................................................................................................................................................................... 6
Historical Volumes ...................................................................................................................................................................................... 7
Market Volumes and the Relationship to the VIX ....................................................................................................................................... 9
Realized versus Implied Volatility ............................................................................................................................................................. 10
VIX and the Fed Funds Rate .................................................................................................................................................................... 11
Evolution of the Market Landscape .......................................................................................................................................................... 12
Markets Were Previously Dominated by a Few ........................................................................................................................................ 12
Now Markets Have Fragmented ............................................................................................................................................................... 13
And Trade Sizes Have Come Down as Well ............................................................................................................................................ 14
Market Shares Across Exchanges and Off-Exchange Venues................................................................................................................. 16
On-Exchange Trading .............................................................................................................................................................................. 16
Off-Exchange: Alternative Trading Systems (ATS) .................................................................................................................................. 18
Order Routing ........................................................................................................................................................................................... 21
How Does an Order Get from End User to Exchange? ............................................................................................................................ 21
Order Routing Visual ................................................................................................................................................................................ 22
US Cash Equities SROs ........................................................................................................................................................................... 23
The Evolution of the US Equity Market Regulations ................................................................................................................................. 24
Securities Act of 1933 .............................................................................................................................................................................. 24
Securities Exchange Act of 1934 .............................................................................................................................................................. 24
Maloney Act Amendments of 1938 ........................................................................................................................................................... 25
Securities Act Amendments of 1975 ........................................................................................................................................................ 26
Order Handling Rules (1997).................................................................................................................................................................... 26
Regulation Alternative Trading Systems (Reg ATS, 1998) ....................................................................................................................... 27
Decimalization (2000) ............................................................................................................................................................................... 27
Regulation National Market System (Reg NMS, 2005) ............................................................................................................................ 28
Rule 613: Consolidated Audit Trail (CAT, 2012) ....................................................................................................................................... 29
Measures to Address Market Volatility (2012) .......................................................................................................................................... 30
Regulation Systems Compliance and Integrity (Reg SCI, 2014) .............................................................................................................. 31
Where We Stand Today ........................................................................................................................................................................... 32
Pilots to Assess Potential Changes .......................................................................................................................................................... 32

SIFMA Insights                                                                                                                                                                                Page | 2
Executive Summary

Roundtables to Discuss Potential Changes.............................................................................................................................................. 34
The History of US Stock Exchange and Market Events ........................................................................................................................... 35
Appendix .................................................................................................................................................................................................. 42
Terms to Know ......................................................................................................................................................................................... 42
ATS Data .................................................................................................................................................................................................. 43
Authors ..................................................................................................................................................................................................... 44

     SIFMA Insight Primers

     The SIFMA Insights primer series is a reference tool that goes beyond a typical 101 series. By illustrating important technical
     and regulatory nuances, SIFMA Insights primers provide a fundamental understanding of the marketplace and set the scene to
     address complex issues arising in today’s markets.

     The SIFMA Insights primer series, and other Insights reports, can be found at: https://www.sifma.org/insights

     Guides for retail investors can be found at http://www.projectinvested.com//markets-explained

SIFMA is the voice of the U.S. securities industry. We represent the broker-dealers, banks and asset managers whose nearly 1 million
employees provide access to the capital markets, raising over $2.5 trillion for businesses and municipalities in the U.S., serving clients
with over $18.5 trillion in assets and managing more than $67 trillion in assets for individual and institutional clients including mutual
funds and retirement plans. SIFMA, with offices in New York and Washington, D.C., is the U.S. regional member of the Global Financial
Markets Association (GFMA). For more information, visit http://www.sifma.org.

This report is subject to the Terms of Use applicable to SIFMA’s website, available at http://www.sifma.org/legal.
Copyright © 2018

SIFMA Insights                                                                                                                                                                                    Page | 3
Executive Summary
Executive Summary
The U.S. equity markets are the largest in the world, representing around 38% of the $85 trillion in global equity
market cap, or $32 trillion:
US 38% of Global Equity Markets
Other DM, 0.4%
Singapore,
1%
EM, 17%
Australia,
2%
US, 38%
Canada,
3%
HK, 5%
UK, 5%
Japan,
7%
China, EU, 11%
10%
Source: World Federation of Exchanges, SIFMA estimates
Note: As of FY17. Market capitalization of listed domestic companies. EU = European Union 27 countries; UK = United Kingdom; HK = Hong Kong; EM
= emerging markets; DM = developed markets
On average, around 6.7 billion shares are traded on U.S. equity markets every day. The U.S. equity markets
continue to be among the deepest, most liquid and most efficient in the world, with investors enjoying narrow
spreads, low transaction costs and fast execution speeds. There is also plenty of opportunity for price improvement,
especially for retail investors.
That said, one can always strive to improve. Efficient and resilient market structure is key to sustaining investor
confidence and participation underpinning the equity markets. The goal of regulators and market participants is to
promote market resiliency and ensure the U.S. equity markets continue to benefit investors and play an essential
role in capital formation.
SIFMA Insights Page | 45
10
15
20
25
30
35
4,700
4,900
5,100
5,300
5,500
5,700
5,900
6,100
Jan 03
10.5
Jan 03 May 03
May 03 Sep 03
SIFMA Insights
Sep 03
5,985
Jan 04
Jan 04 May 04
May 04 Sep 04
Sep 04 Jan 05
Jan 05
May 05
May 05
Sep 05
Sep 05
Jan 06
Jan 06
May 06
May 06
Sep 06
Sep 06
Jan 07
Jan 07
5,413
May 07
May 07
Sep 07
Sep 07
Jan 08
Jan 08
May 08
Note: US companies only, listed on NYSE and Nasdaq
May 08
Sep 08
Source: World Federation of Exchanges, SIFMA estimates
Sep 08
Jan 09
Jan 09
4,986
10.1
May 09
May 09
Sep 09
Sep 09
Jan 10
Jan 10
May 10
May 10
Sep 10
Sep 10
Jan 11 Jan 11
May 11 May 11
Sep 11
14.0
Sep 11
Jan 12 Jan 12
May 12 May 12
Total Number of Listed Companies
Sep 12
Domestic Market Capitalization ($T)
Sep 12
Jan 13 Jan 13
May 13
4,877
May 13
Sep 13 Sep 13
Jan 14 Jan 14
May 14 May 14
Sep 14 Sep 14
Jan 15 Jan 15
May 15 May 15
Sep 15 Sep 15
Jan 16 Jan 16
23.7
May 16 May 16
Sep 16 Sep 16
Jan 17 Jan 17
May 17 May 17
Sep 17 Sep 17
Jan 18 Jan 18
May 18 May 18
34.0
5,272
Page | 5
Executive SummaryDrivers of Market Volumes
Drivers of Market Volumes
Volume is the number of shares traded indicating the overall activity of a security, or the market in aggregate, over a
specified period of time. For investors, volumes can be used as a technical indicator1 to identify a trend or reversal,
signaling when to buy or sell a stock. For example, a stock continuing a run upward should see volumes move
similarly. On aggregate, up markets are an indicator of investors’ views of confidence in or a sign of a strong U.S.
economy, i.e. companies are performing well.
While some people like to look at aggregate volumes as an indicator of liquidity, volumes may not always represent
real liquidity. Aggregate volumes include on-exchange trading and off-exchange trading, roughly 63% and 37% on
average over the last 12 months respectively. Within off-exchange trading, you have trading on alternative trading
systems (ATS; ~12% in 1Q18) and the remainder in over-the counter (OTC) trading.2 All equity trading – both on-
exchange and off-exchange – is reported to the tape.
Off-exchange volumes can come in many forms, and the delineations are not always black and white. Broker-
dealers serve many types of clients and therefore have multiple options to find the path for best execution – agency
crossing, upstairs trading, execution on their own or another ATS, etc. While almost all of these forms can be
termed internalization, we describe it and point out a few sub categories as:
• Internalization – Brokers and market makers use internal automated books to execute trades; trades print
to the tape as off-exchange. Typically brokers process trades this way to offset market making risk or
optimize trading across desks.
• Wholesaling – Retail flow routed to market makers, who generally provide better execution than on-
exchange (with more opportunities for price improvement). Some external liquidity providers, operating
single dealer platforms, also interact with institutional flow.
• Upstairs Blocks – The trading of high-touch blocks, a form of capital commitment trading, will print to the
tape as off-exchange.
• ATS – ATS transactions that are not block trades. Clients may choose to route to an ATS because of lower
costs and a greater probability of confidentiality (less information leakage).
1
Analysts and investors also use fundamental analysis on companies to make investment decisions.
2
As per Cboe Global Markets and FINRA data.
SIFMA Insights Page | 6Drivers of Market Volumes
Historical Volumes
Looking at historical volumes since the fall of 2007, the following charts show:
• ADV 6.7 billion in May 2018, down slightly from 7.5 billion in November 2007
• The low was 5.2 billion in August 2014; the high was 12.3 billion in March 2009
• 6.7 billion to 6.8 billion on average for the last 12 to 24 months; six month average was 7.1 billion given the
February peak (8.4 billion ADV; volatility increased significantly over inflation and other economic concerns)
These declining volumes are linked to:
• Passive Investments – Increased usage of index funds, which change holdings infrequently (limiting
increases in trading volumes) versus active funds or individual stock trading.
• Trading Strategies – Growing usage of more advanced trading strategies by individual (retail) investors,
using futures and options which allows them to leverage their position with less capital to bolster returns.
In May 2018, ETF volumes represented 18% of total volumes. Of the 6.7 billion ADV for the period, 5.5 billion was in
single stock trading. In 1Q18, 21% of total volumes was in ETFs, with 6.0 billion out of the total 7.6 billion aggregate
ADV in single stock trading. ETFs are often correlated with volatility, which peaked in February of this year (1Q18
averaged 17.79, versus FY17 average 11.05). This indicates 18% to 20% of aggregate volumes are not accessible
to institutional investors to provide for single stock liquidity.
SIFMA Insights Page | 71,000
3,000
5,000
7,000
9,000
11,000
13,000
1,000
3,000
5,000
7,000
9,000
11,000
13,000
Oct 07 Oct 07
7,510
Jan 08
7,510
Jan 08
SIFMA Insights
22.87
Apr 08
Apr 08
Jul 08
Jul 08
12,216
Oct 08
Oct 08
Jan 09
12,216
Jan 09
Apr 09
59.89
Apr 09
Jul 09
Jul 09
Oct 09
Oct 09
Jan 10
Jan 10
Apr 10
Apr 10
Jul 10
Jul 10
Oct 10
Oct 10
Jan 11
Jan 11
Apr 11
Apr 11
Jul 11
Jul 11
10,564
Oct 11
Source: Cboe Global Markets, Bloomberg, SIFMA estimates
10,564
Oct 11
Jan 12
Jan 12
42.96
Apr 12
Apr 12
Jul 12
Oct 12 Jul 12
Jan 13 Oct 12
Shares
Apr 13 Jan 13
Shares
Jul 13 Apr 13
Oct 13 Jul 13
13.75
6,289
Jan 14 Oct 13
6,289
Apr 14 Jan 14
ADV (M) versus VIX (#)
VIX (RHS)
Jul 14 Apr 14
Oct 14 Jul 14
Jan 15 Oct 14
Trend Line
Apr 15 Jan 15
Jul 15 Apr 15
Average Daily Volume Shares Traded (M)
Oct 15 Jul 15
Jan 16 Oct 15
20.20
9,307
Apr 16 Jan 16
9,307
Jul 16 Apr 16
Oct 16 Jul 16
Jan 17 Oct 16
Apr 17 Jan 17
Jul 17 Apr 17
Oct 17 Jul 17
Jan 18 Oct 17
Apr 18 Jan 18
15.43
6,668
Apr 18
0
10
20
30
40
50
60
6,668
Page | 8
Drivers of Market VolumesDrivers of Market Volumes
Market Volumes and the Relationship to the VIX
Volatility is a driver of U.S. cash equities. Volatility has been well below historical rates since the financial crisis – the
rolling average VIX has ranged between 12 and 13 since 2017 – feeding through to lower volumes.
Historical Rolling 12-Month Average VIX
40
VIX Trend Line 39.02
35
29.07
30 28.11
24.39
25 22.51
18.86
20
15 12.47
14.09
12.39 12.44 12.34
10
Sep-93
Sep-95
Sep-03
Sep-05
Sep-13
Sep-15
Sep-91
Sep-97
Sep-99
Sep-01
Sep-07
Sep-09
Sep-11
Sep-17
Jan-97
Jan-99
Jan-07
Jan-09
Jan-17
Jan-91
Jan-93
Jan-95
Jan-01
Jan-03
Jan-05
Jan-11
Jan-13
Jan-15
May-92
May-00
May-02
May-10
May-12
May-94
May-96
May-98
May-04
May-06
May-08
May-14
May-16
Post Crisis Rolling 12-Month Average VIX
30
VIX Trend Line
28 27.87
26 24.39
24
22
20 18.86
19.84
18
16
14 15.70
12.47
14.09
12 13.42
11.16
10
Jan-13
Jan-14
Jan-15
Jan-10
Jan-11
Jan-12
Jan-16
Jan-17
Jan-18
Jul-10
Jul-11
Jul-12
Jul-13
Jul-14
Jul-15
Jul-16
Jul-17
Apr-10
Apr-14
Apr-15
Apr-16
Apr-11
Apr-12
Apr-13
Apr-17
Apr-18
Oct-11
Oct-12
Oct-16
Oct-17
Oct-10
Oct-13
Oct-14
Oct-15
Source: Bloomberg, SIFMA estimates
SIFMA Insights Page | 9Drivers of Market Volumes
Realized versus Implied Volatility
An additional factor to look at is implied versus realized volatility. The VIX, or the CBOE Volatility Factor, shows the
market’s expectations of 30-day volatility. It is a forward looking indicator of market risk, constructed from implied
volatilities on S&P 500 index options, both puts and calls. It is often referred to as the investor fear gauge. Realized
volatility shown below is as measured by Virtu Financial. Since 2014, realized volatility has most frequently come in
below implied, with the cushion referred to as the volatility risk premium. Until the recent pop in February, realized
has been less than half of implied volatility over the last 12 to 18 months.
Realized versus Implied Volatility
30
Realized Implied
25
20
15
10
5
0
Jan-14
Nov-14
Jan-15
Nov-15
Jan-17
Jan-16
Nov-16
Nov-17
Jan-18
Sep-14
Sep-17
Sep-15
Sep-16
Jul-14
Jul-15
Jul-16
Jul-17
Mar-15
Mar-17
Mar-14
May-15
Mar-16
Mar-18
May-14
May-16
May-17
Realized as a Percent of Implied Volatility
140%
136.8%
120%
100%
84.3%
92.5%
80%
60%
40% 49.3%
44.6%
32.4%
20%
Jan-14
Sep-14
Nov-14
Jan-15
Nov-15
Jan-16
Nov-16
Jan-17
Nov-17
Jan-18
Sep-15
Sep-16
Sep-17
Jul-14
Jul-15
Jul-16
Jul-17
Mar-14
May-14
Mar-15
Mar-16
Mar-17
Mar-18
May-15
May-16
May-17
Source: Virtu Financial, SIFMA estimates
SIFMA Insights Page | 10Drivers of Market Volumes
VIX and the Fed Funds Rate
Finishing up our assessment of macro factors impacting market volumes, the VIX tends to rise and fall with rate
cycles. With a steady, continual rise in rates, the VIX historically increases (after a lag period).
Historical Relationship Between VIX & Fed Funds Rate Cycles
40 VIX Fed Funds Rate (RHS) 9%
35 8%
7%
30
6%
25
5%
20
4%
15
3%
10
2%
5 1%
0 0%
Jan-91
Jan-93
Jan-96
Jan-98
Jan-01
Jan-03
Jan-08
Jan-10
Jan-13
Jan-15
Jan-18
Jan-92
Jan-94
Jan-95
Jan-97
Jan-99
Jan-00
Jan-02
Jan-04
Jan-05
Jan-06
Jan-07
Jan-09
Jan-11
Jan-12
Jan-14
Jan-16
Jan-17
VIX Movements During Last Rate Hike Cycle
16 VIX Fed Funds Rate (RHS) 5.25% 5.5%
5.16%
15.56
5.0%
15.20
4.20% 4.5%
15
4.0%
3.5%
14 3.0%
2.37%
2.5%
13.04 2.0%
13 12.80
13.20
1.11% 1.5%
1.0%
12 0.5%
Aug-07
Jul-05
Aug-05
Sep-05
Jul-06
Aug-06
Sep-06
Jul-07
Dec-06
Nov-04
Dec-04
Nov-05
Dec-05
Nov-06
Jun-07
Jan-05
Jun-05
Jan-06
Jun-06
Jan-07
Oct-04
Oct-05
Oct-06
Mar-05
Mar-06
Mar-07
Apr-05
Apr-06
Apr-07
May-05
May-06
Feb-07
May-07
Feb-05
Feb-06
Source: Bloomberg, SIFMA estimates
SIFMA Insights Page | 11Evolution of the Market Landscape
Evolution of the Market Landscape
Above we discussed the macro factors impacting volumes and the equities markets. This section assesses the
evolution of the landscape and the current structure of the markets.
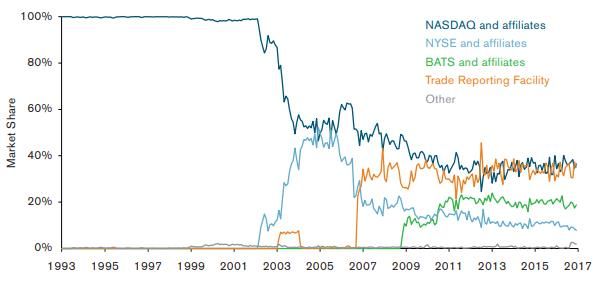
Markets Were Previously Dominated by a Few
Prior to the 2000s, the U.S. equities markets were dominated by NYSE and Nasdaq, particularly in trading of their
own listed stocks: NYSE held ~90% share of trading in its own listed stocks and Nasdaq 100%.
NYSE-Listed Stocks
Nasdaq-Listed Stocks
Source: As shown in the U.S. Treasury report, “A Financial System That Creates Economic Opportunities – Capital Markets”. This report sources: Office
of Financial Research analysis, U.S. Equities Trade and Quote (TAQ), calculated (or derived) based on data from Daily Stock File ©2017 Center for
Research in Security Prices (CRSP®), the University of Chicago Booth School of Business.
SIFMA Insights Page | 12Evolution of the Market Landscape
Now Markets Have Fragmented
Today, we have 13 exchanges, predominantly under three main parent groups, 33 equity ATS and OTC venues.
One may ask why a parent group needs to hold multiple exchange licenses (each individual exchange must be
approved by and registered with the SEC). Different exchanges are set up to serve the various needs of end users,
mainly based on pricing model.
4 Cboe: Cboe BYX, Cboe BZX, Cboe EDGA, Cboe EDGX
4 NYSE: New York Stock Exchange, NYSE Arca, NYSE American, NYSE National
13 3 Nasdaq: Nasdaq BX, Nasdaq PHLX, Nasdaq Stock Market
33 Equity Exchanges
ATS *Chicago Stock Exchange
IEX
OTC Venues
Source: Cboe Global Markets, FINRA, SIFMA estimates
Note: Intercontinental Exchange (ICE) owns the NYSE exchanges, as well as other exchanges and clearing houses across the globe. In April 2018, ICE
announced it entered into an agreement to acquire the Chicago Stock Exchange (CHX), pending regulatory approval.
Some market participants consider this the “fragmentation” of the markets, brought on over the decades by
regulations and electronification of markets. Brokers, on behalf of investors, now must send orders to multiple
trading venues, which then compete with each other for that order flow. There is a balance between concentrated
and fragmented markets. Concentrated markets can provide greater depth of book and higher probability of order
execution at the terms stated by the client. Yet, it can lead to monopolistic behavior in terms of pricing and limit
innovation. On the other side, fragmented markets can be more competitive and geared toward innovation to win
business. However, this can lead to lower probability of order execution and increased total trade costs, as brokers
must search multiple trading venues to find the best price (a requirement of their best execution obligations).
SIFMA Insights Page | 13Evolution of the Market Landscape
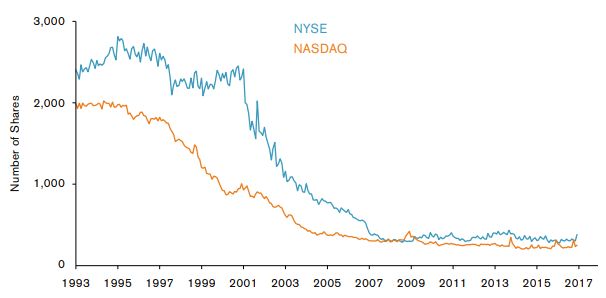
And Trade Sizes Have Come Down as Well
As markets fragmented, we saw the average trade size come down as well, from being in the thousands in the
1990s and early 2000s to around 200 on average today.
Average Trade Size in US Equities Markets
Source: As shown in the U.S. Treasury report, “A Financial System That Creates Economic Opportunities – Capital Markets”. This report sources: Office
of Financial Research analysis, Muzan Trade and Quote Data
With this fragmentation – along with the increase in passive investing discussed above, ETF trading volumes
representing 18% to 20% of total volumes in 2018 – volumes have become concentrated around the closing
auctions at NYSE and Nasdaq, the two main single stock listing exchanges in the U.S.3 According to NYSE, its
closing auction now represents around 7% of total NYSE-listed volume, roughly twice the share versus five years
ago, as market participants choose to participate at a time when the maximum number of buyers and sellers are
coming together.
3
BATS, now owned by Cboe Global Markets, listed its own stock when it IPOd in 2016, but its strategic focus is listing ETPs rather than single stocks.
IEX received listing approval and plans to test the process in 2018.
SIFMA Insights Page | 14Evolution of the Market Landscape
Traders describe the congregation of volumes at the close, and the open, as the “smile curve” (albeit a lopsided
smile). During the 9:30 AM to 4:00 PM trading day, there is typically higher volumes at the open and particularly at
the close, with lower volumes during the middle of the day.
NYSE Half-Hourly Volume (Week of 6-25-18)
450,000 407,735
400,000
350,000
300,000
250,000
200,000
150,000 98,953
100,000
50,000 26,104
0
9:30-10:00
12:30-1:00
1:00-1:30
1:30-2:00
2:00-2:30
2:30-3:00
3:00-3:30
3:30-4:00
11:00-11:30
11:30-12:00
12:00-12:30
10:00-10:30
10:30-11:00
Source: Barron’s, SIFMA estimates
Note: Averages of the daily volumes for the week
SIFMA Insights Page | 15Market Shares Across Exchanges and Off-Exchange Venues
Market Shares Across Exchanges and Off-Exchange Venues
On-Exchange Trading
Within trading on exchanges, the top three exchange groups each hold around a 20% market share in aggregate
across all their individual exchanges. Market share can vary within each exchange group’s individual exchanges, as
shown in the following charts. Off-exchange trading represents around 38% of the total.
Market Share - Exchange
NASDAQ 14.8%
NYSE 12.9%
NYSE Arca 8.7%
Cboe EDGX 6.5%
Cboe BZX 6.2%
Market Share - Parent Company
Cboe BYX 4.8% IEX, CHX,
2.5% 0.5%
NASDAQ BX 3.2%
IEX 2.5%
NYSE,
Cboe EDGA Nasdaq, 22.0%
1.3%
18.6%
NASDAQ PSX 0.7%
CHX 0.5%
Cboe,
NYSE American 0.3% 18.8%
Source: Cboe Global Markets, SIFMA estimates
Note: As of May 2018
SIFMA Insights Page | 16Market Shares Across Exchanges and Off-Exchange Venues
Exchange Market Share by Parent Group
NYSE Cboe NASDAQ IEX CHX Off-Exchange
40% 37.6%
35%
30%
25% 22.0%
18.8%
20%
18.6%
15%
10%
5% 2.5%
0.5%
0%
Nov-16
Dec-16
Jan-17
Nov-17
Dec-17
Jun-16
Jun-17
Jan-18
Jul-16
Jul-17
Aug-16
Aug-17
Sep-17
Sep-16
Apr-17
May-17
Apr-18
May-18
Feb-17
Feb-18
Mar-17
Mar-18
Oct-16
Oct-17
Source: Cboe Global Markets, SIFMA estimates
SIFMA Insights Page | 17Market Shares Across Exchanges and Off-Exchange Venues
Off-Exchange: Alternative Trading Systems (ATS)
Within off-exchange trading, the number of equity ATS dropped to 33 from 42 since 2014 (-21%). Yet ATS, often
called dark pools, continue to provide important functionality for the markets, particularly for block trades. Block
trades are considered trades containing 10,000 or greater shares.4 Execution of these trades can be complicated.
With trades of this size, the client needs its position to remain anonymous to prevent other market participants from
attempting to replicate its trading strategy and thereby moving the market price of the stock. Trades of this size can
significantly move market prices – often changing the economics of the trade – if not executed properly.
Interestingly, when analyzing equity ATS, it is not a one-size-fits-all approach. The average trade size for all equity
ATS is 204, essentially in line with that of exchanges. The average trade size for blocks is 25,079 (or 17,818 when
removing a substantial outlier), versus 192 for non blocks. Yet, the average trade size figure does not necessarily
equate to market share (percent of total shares or total trades), as shown in the following charts.
# of Equity ATS
44
42
42
40
38 37
36 35
34 33 33
32
30
2014 2015 2016 2017 1Q18
Source: FINRA, SIFMA estimates
4
FINRA uses a less narrow definition than the market, with share-based and dollar-based thresholds.
SIFMA Insights Page | 18Market Shares Across Exchanges and Off-Exchange Venues
Non Blocks Ranked by Average Trade Size Non Blocks Ranked by % of Total Shares
XIST 3,562 XIST 0.57%
BIDS 1,194 BIDS 5.05%
WDNX 1,064 WDNX 0.03%
USTK 596 USTK 0.82%
PROS 458 PROS 0.00%
XSTM 336 XSTM 1.49%
ITGP 291 ITGP 2.99%
IATS 274 IATS 1.86%
MSPL 238 MSPL 7.23%
PDQX 214 PDQX 0.60%
MLIX 214 MLIX 4.11%
ICBX 209 ICBX 3.11%
MSRP 207 MSRP 0.59%
CXCX 203 CXCX 1.16%
EBXL 197 EBXL 7.50%
JPMX 193 JPMX 6.02%
DBAX 186 DBAX 7.49%
LATS 182 LATS 6.41%
KCGM 181 KCGM 2.13%
MSTX 167 MSTX 2.25%
CROS 163 CROS 11.39%
SGMT 158 SGMT 4.57%
UBSA 155 UBSA 21.47%
JPBX 107 JPBX 1.15%
Non Blocks Ranked by % of Total Trades
XIST 0.03%
BIDS 0.81%
WDNX 0.01%
USTK 0.26%
PROS 0.00%
XSTM 0.85%
ITGP 1.97%
IATS 1.31%
MSPL 5.83%
PDQX 0.54%
MLIX 3.68%
ICBX 2.85%
MSRP 0.55%
CXCX 1.09%
EBXL 7.31%
JPMX 5.98%
DBAX 7.72%
LATS 6.75%
KCGM 2.26%
MSTX 2.58%
CROS 13.40%
SGMT 5.57%
UBSA 26.59%
JPBX 2.06%
Source: FINRA, SIFMA estimates (as of 1Q18)
SIFMA Insights Page | 19Market Shares Across Exchanges and Off-Exchange Venues
Blocks Ranked by Average Trade Size Blocks Ranked by % of Total Shares
DLTA 359,869 DLTA 30.46%
CIOI 59,354 CIOI 2.57%
LQNT 36,469 LQNT 16.96%
LMNX 32,922 LMNX 5.03%
BCDX 18,000 BCDX 0.00%
LQNA 17,244 LQNA 22.82%
CBLC 15,602 CBLC 3.59%
BLKX 11,112 BLKX 17.86%
AQUA 8,793 AQUA 0.71%
Blocks Ranked by % of Total Trades
DLTA 2.12%
CIOI 1.08%
LQNT 11.67%
LMNX 3.83%
BCDX 0.00%
LQNA 33.19%
CBLC 5.76%
BLKX 40.31%
AQUA 2.03%
Source: FINRA, SIFMA estimates (as of 1Q18)
SIFMA Insights Page | 20Order Routing
Order Routing
How Does an Order Get from End User to Exchange?
Order routing is the process by which an order goes from the end user to execution. Once an investor places a
trade, the order goes to a broker. If the order is marketable, it is eligible for immediate execution based on current
market conditions. Non-marketable orders are not immediately executable for various reasons (the limit price is
outside the current market, or it was an all or none trade and the quantity is not available in the market). Firms have
built technologies to address market fragmentation and identify hidden liquidity, as market participants search for
smart order routing paths to achieve best execution (best ex) of trades while minimizing market impact.
Once marketable, the broker will look at the size of the order and determine the path that will achieve best ex (taking
into account, among other things, ADV of the security being traded). Of note, a client can direct the path the broker
must follow to execute his trade, else the broker can choose the path itself. The path the broker can take varies, as
shown on the following page.
By law, brokers are obligated to provide best ex for their clients5. However, the SEC does not specifically define
what constitutes best ex, and market participants do not follow a uniform methodology themselves. Reg NMS, and
earlier regulations, focused on stock price as measure of best ex. Yet, this does not tell the whole story.
The total cost of a trade can be broken out into explicit and implicit costs. Explicit costs are the broker commissions.
Implicit costs can include:
ƒ{Stock Price; + Fees, - Rebates; Opportunity Cost (time to fill, percent of the order filled)}
During the time lapsed when searching for the price at the NBBO across all trading venues, the market could have
moved, and the broker is forced to execute at a less profitable price. Or a client cannot get their entire order
executed. These are all costs to trading, which can add up as brokers search across fragmented markets.
5
Brokers are legally required to seek the best execution reasonably available for their customers' orders. To comply with this requirement, brokers
evaluate the orders they receive from all customers in the aggregate and periodically assess which competing markets, market makers, or ECNs offer
the most favorable terms of execution. Some of the factors a broker must consider when seeking best execution of customers' orders include: the
opportunity to get a better price than what is currently quoted, the speed of execution, and the likelihood that the trade will be executed.
SIFMA Insights Page | 21Order Routing
Order Routing Visual
Exchanges
Internalization
Wholesalers
End User Broker
Market Makers
Liquidity Providers
ATS
In order of the pro rata percentage of overall volumes seen in today’s markets, order routing options include:
• Exchanges – A broker can send the client’s order direct to the exchange
• Off-exchange – options
o Internalization/Wholesalers – A broker can fill the client’s order from its own inventory of stocks,
making for quicker and cheaper execution, or it can send the order to another broker for execution
o Market Maker/Liquidity Providers – For OTC trades, brokers can send orders to market makers,
who stand ready to buy and sell stocks on a continuous basis, as they are obligated to make two-
sided quotes in the market at all times
• Off-exchange – ATS – A broker can send the client’s order to be executed by the ATS, a broker’s own ATS
or one operated by a third party
SIFMA Insights Page | 22US Cash Equities SROs
US Cash Equities SROs
By law, national stock exchanges also serve as Self-Regulatory Organizations (SROs). As such, they are
responsible for regulating their member firms under their own rules and certain of the federal securities laws. In the
SRO roles, the exchanges and FINRA (formerly NASD) enforce industry standards and requirements related to
securities trading. These standards, among others, include: advance just and equitable principles of trade for the
protection of investors; adopt and enforce rules of fair practice; and foster observance by its members of federal
securities laws. The equities exchange SROs (and FINRA) include:
Financial Industry
*Chicago Stock Investors Exchange
Regulatory
Exchange (CHX) (IEX)
Authority (FINRA)
Cboe Global Intercontinental Nasdaq
Markets (CBOE) Exchange (ICE) (NDAQ)
Cboe BYX New York Stock
Nasdaq BX
Exchange Exchange
Cboe BZX
NYSE Arca Nasdaq PHLX
Exchange
Cboe EDGA The Nasdaq Stock
NYSE American
Exchange Market
Cboe EDGX
NYSE National
Exchange
Source: https://www.sec.gov/rules/sro.shtml
Note: In April 2018, ICE announced it entered into an agreement to acquire CHX, pending regulatory approval.
SIFMA Insights Page | 23The Evolution of the US Equity Market Regulations
The Evolution of the US Equity Market Regulations6
Securities Act of 1933
http://legcounsel.house.gov/Comps/Securities%20Act%20Of%201933.pdf
Catalyst: The stock market crash of 1929
Objective: (1) Ensure transparency in financial statements to assist investors in making informed decisions; (2)
prohibit deceit, misrepresentation and other fraud in the sale of securities
Details:
Also known as the Securities Act or Truth in Securities Act, this was the first federal law used to regulate the stock
market and the first major law on the sale of securities, which had historically been governed by state laws.
Importantly, the act created a uniform set of rules to protect investors against fraud.
The Securities Act required companies to register with the SEC prior to going public, providing relevant financial and
other information in a prospectus and registration statement. Information required included: corporate description of
properties and businesses; management information; financial statements certified by an independent account; and
a description of the security being offered. Some exemptions from the registration requirement existed (private
offerings to a limited number of persons or institutions; offerings of limited size; intrastate offerings; and securities of
municipal, state and federal governments).
Securities Exchange Act of 1934
http://legcounsel.house.gov/Comps/Securities%20Exchange%20Act%20Of%201934.pdf
Catalyst: The stock market crash of 1929
Objective: (1) Create the SEC to regulate the securities industry; (2) establish self regulation; (3) regulate
trading of securities
6
Additional NMS Plan descriptions can be viewed on the SEC’s website here: https://www.sec.gov/rules/sro/nms.htm
SIFMA Insights Page | 24The Evolution of the US Equity Market Regulations Details: Also known as the Exchange Act, this law empowered the SEC with broad authority over all aspects of the securities industry. It tasked the agency to register, regulate and oversee brokerage firms, transfer agents, and clearing agencies as well as the nation's securities self-regulatory organizations (SROs). This act identified and prohibited certain types of conduct and provided the SEC with disciplinary powers over regulated entities and persons associated with them. The Exchange Act also enabled the SEC to require periodic reporting of information by publicly traded companies. Further, the act established supervised exchange self regulation7, with direct and flexible requirements for exchanges. On the direct side, exchanges must: register with the SEC; restrict broker- dealer borrowing; and prohibit manipulative practices. Additionally, exchanges have discretion in monitoring their markets, relying on self-regulation (the flexible aspect). Maloney Act Amendments of 1938 https://www.sec.gov/news/speech/1938/102338mathews.pdf Catalyst: General update to regulations as the trading landscape evolves, i.e. off-exchange trading Objective: Establish the NASD to regulate OTC markets Details: This act authorized the SEC to register national associations of broker-dealers for the purpose of regulating themselves under SEC oversight. The Maloney Act established the National Association of Securities Dealers (NASD), with a mandate to: standardize the securities industry’s principles and practices; promote high standards of commercial honor; advance just and equitable principles of trade for the protection of investors; adopt and enforce rules of fair practice; and foster observance by its members of federal and state securities laws (the promotion of capital formation was added in 1963). 7 While self-regulation dates back to the Buttonwoods Agreement, and early stock exchanges formed constitutions and by laws on their own, this was the first version of supervised self-regulation. SIFMA Insights Page | 25
The Evolution of the US Equity Market Regulations

Securities Act Amendments of 1975
https://www.sec.gov/news/speech/1975/111875loomis.pdf

Catalyst:          Lack of market efficiency and the Paper Crisis

Objective:         Integrate markets and promote competition by establishing a national market system

Details:

In the 1960s/1970s, Congress and the SEC were concerned about efficiencies and lack of competition in markets,
wondering whether investors were getting the best price to transact (not just stock price). The U.S. equities markets
had become quite fragmented, with the same stock sometimes trading at different prices across various trading
venues. The NYSE ticker tape did not report transactions of NYSE-listed stocks that took place on regional
exchanges or OTC markets. The fragmentation made it difficult for traders to assess the whole market and
determine the best price. At the same time, NYSE and a few others dominated the markets, and many felt regulation
was needed to remove barriers to entry. The chaos from the paper crisis furthered the case for a central system.
This act – while also imposing an obligation on the SEC to consider the impacts of new regulation on competition –
empowered the SEC to establish a national market system and a system for nationwide clearing and settlement of
securities transactions. This act enabled the Securities Industry Processors (SIPs), a structured method of
transmitting securities transactions in real-time and showing the price and volume data for the transactions. This
was a further shift from industry driven rules to regulatory mandates prescribing rules for all equity transactions.

Interestingly, Congress noted competitive forces were to drive market development. The goal was to link trading
venues across the country – there were still many regional exchanges at this time – to promote competition and
allow orders to be executed at the best price. Congress provided the SEC with five factors to establish a functioning
national market system: (1) efficiency; (2) competition; (3) price transparency; (4) best execution; and (5) order
interaction. Additionally, they indicated new technologies would increase efficiency, with improved communications
and data processing tools linking markets. The objective was to increase information flow and enable the ability to
offset orders, all contributing to best execution.

Order Handling Rules (1997)
https://www.sec.gov/rules/sro/nd9821o.htm

Catalyst:          General update to regulations as the trading landscape evolves, i.e. technological advances

Objective:         Enhance the quality of published quotations for securities and promote competition and pricing
                   efficiency

Details:

SIFMA Insights                                                                                                   Page | 26
The Evolution of the US Equity Market Regulations The SEC requires a market maker to display customer limit orders that (1) are priced better than a market maker's quote or (2) add to the size associated with a market maker's quote when the market maker is at the best price in the market. This gives investors the ability to directly advertise their trading interest to the marketplace, enabling them to trade inside the current bid-ask spread and thereby compete with market maker quotations and narrow the size of the bid-ask spread. This rule amended prior regulations to require a market maker to display in its quote any better priced orders that it places into an ECN. Alternatively, it may comply with the display requirements through the ECN itself, provided the ECN (1) ensures that the best priced orders entered by market makers into the ECN are included in the public quotation, and (2) provides equivalent access to the ECN for brokers that do not subscribe to the ECN. Regulation Alternative Trading Systems (Reg ATS, 1998) https://www.sec.gov/rules/final/34-40760.txt Catalyst: General update to regulations as the trading landscape evolves, i.e. technological advances Objective: Strengthen the securities markets, while encouraging innovative new markets Details: At the time there was a growing acceptance of technology to provide investors with an increasing array of services, often more efficiently and at a lower cost. However, the regulatory environment at the time was not designed to incorporate these types of systems, despite the fact ATS were already handling around 20% of the orders in securities listed on Nasdaq and almost 4% of other exchange listed securities. Yet, ATS were private, available only to chosen subscribers and regulated as broker-dealers, not like registered exchanges. The SEC was concerned this could affect investor protections and the operation of the markets as a whole, as ATS remained outside the national market system. For example, market makers could quote prices better than those made available to public investors, since they were not fully disclosed. Reg ATS allowed ATS to choose to register as national securities exchanges or as broker-dealers, then complying with additional requirements depending on their activities and trading volume. In 2015, the SEC proposed rules to enhance transparency and oversight of ATS, including: providing information about and activities of the broker-dealer operating the NMS Stock ATS and detailing how the ATS is operated; making these details public; establishing a process for the SEC to review material changes to the operation of an ATS; and requiring ATS to protect subscribers’ confidential trading information. The SEC is voting on this proposal on July 18. Decimalization (2000) https://www.sec.gov/rules/other/34-42360.htm Catalyst: General update to regulations as the trading landscape evolves Objective: Match the rest of the world already using decimalization Details: SIFMA Insights Page | 27
The Evolution of the US Equity Market Regulations

The original convention of quoting stock prices in fractions dated back over two hundred years, leaving the U.S. the
only major market at the time not to price securities in decimals. The SEC, after discussions with market
participants, recognized the potential benefits of decimal pricing over the fraction-based pricing scheme.
Decimalization moved the smallest price improvement from 1/16th (or $0.0625) to $0.01.

The primary case for decimalization was it would result in: tighter spreads; increased competition among market
makers; and make quotes easier to understand. These factors would all benefit investors and the markets
themselves.

Regulation National Market System (Reg NMS, 2005)
https://www.sec.gov/rules/final/34-51808.pdf

Catalyst:           A need to modernize regulations to match changes in the markets

Objective:          (1) Consolidate the rules promoting the national market system; and (2) modernize and strengthen
                    the NMS system

Details:

In the 1970s, the equities markets consisted of mutualized exchanges and human interaction to execute orders. By
2005, computers dominated execution, and exchanges had demutualized and became global for-profit publicly
traded entities in many cases. Speed became king, with trades executing in fractions of a second and algorithms
implementing trading strategies.

Reg NMS is responsible for the current equity market structure, including the unintended consequences it brought
about. This rule was intended to assure investors receive the best prices for order execution by encouraging
competition in the marketplace, fostering competition among individual markets and orders to promote efficient and
fair price formation across securities markets.

Key rules included:

     •    Market Data Rules (Rules 600, 601 and 603) – These rules amended existing SEC rules and NMS plans
          governing the dissemination of market data, controlling how exchanges charge for access to data on
          quotations and orders. It also enabled exchanges to distribute their proprietary market data separately.
             o Allocation Amendment – This section instituted a new market data revenue allocation formula,
                  splitting the revenue generated by charging for SIP market data across trading centers. Originally,
                  the formula was based solely on the trading activity of an SRO. The new formula included a number
                  of elements, such as: quoting share (dollar size and length of time equal to the price of the NBBO);
                  NBBO improvement share (displayed quotations improve the price of the NBBO); trading share
                  (average of the percentage of total dollar volume and percentage of qualified trades, i.e. dollar
                  volume $5,000+); and security income allocation (square root of dollar volume; adjusts for the
                  disproportionate level of trading in the top tier of stocks).

SIFMA Insights                                                                                                 Page | 28
The Evolution of the US Equity Market Regulations
o Governance Amendment – This section created non-voting advisory committees for the NMS Plans
governing the SIPs, inclusive of non-SRO members, who would have the right to submit their views
to the NMS Plan operating committees on matters, including any new or modified product, fee,
contract or pilot program.
o Distribution and Display Rules – This section authorized the independent distribution of market data
outside of what was required by the NMS Plan, believing it would allow investors and vendors
greater freedom to make their own decisions regarding the data they need.
• Access Rule (Rule 610) – This established a uniform standard to ensure fair and non-discriminatory access
to quotes by all trading centers, including nonmembers of exchanges.8 It also imposed a limit on what
trading centers could charge to access protected quotations, as well as mandating SROs to enforce rules to
prohibit members from interfering with protected quotes of other trading centers or creating locked or
crossed markets.
• Order Protection Rule (Trade Through; Rule 611) – The objective was to mandate trades be executed at
the best displayed price. This rule required trading centers to establish, maintain and enforce policies and
procedures to prevent trade executions at prices inferior to other trading centers. A trading center cannot
“trade through” (essentially ignore) a better displayed quote, rather it must route the trade to the venue
displaying the better quote or execute the trade at the better price or with price improvement. Reserve or
hidden orders can be ignored – as can manual quotes, those not published on an electronic trading system,
even if at a better price – and are not protected. This rule put price and speed ahead of all other best
execution factors (fill rates, etc.), which can actually increase total trading costs.
• Sub-Penny Rule (Rule 612) – This established minimum pricing increments, preventing market participants
from displaying quotes in increments less than a penny (for all NMS securities except those priced at less
than $1.00). The objective is to prevent traders from outbidding customers’ orders by a fraction of a penny,
preventing customers’ orders from getting executed.
Rule 613: Consolidated Audit Trail (CAT, 2012)
https://www.sec.gov/divisions/marketreg/rule613-info.htm
Catalyst: May 2010 Flash Crash
Objective: Provide FINRA, the SEC and the exchanges data to enable a view of the whole market, including
granularity at the customer account level
8
Trading centers: exchanges, associations operating a trading facility, ATS, market makers, and broker-dealers executing orders internally as a principal
or agent.
SIFMA Insights Page | 29The Evolution of the US Equity Market Regulations
Details:
The SEC adopted Rule 613 to create a comprehensive consolidated audit trail that would allow regulators to
efficiently and accurately track all market activity. The rule requires SROs to jointly submit a plan to create,
implement and maintain a consolidated audit trail (CAT), and mandates include:
• Provide certain detailed information (origination, modification, cancellation, routing, and execution) to the
CAT for each quote and order, and each reportable event with respect to each quote and order, in an NMS
security.
• Require all reportable events to be reported to the CAT so it can link them to an order through its entire life
cycle from generation through routing, modification, cancellation or execution.
• Establish unique and consistent identifiers for each broker-dealer and national securities exchange.
• Establish unique and consistent identifiers for each account holder, as well as any person who has trading
discretion over an account.
• Require synchronization of business clocks used to record date and time of any reportable event and require
timestamps for each reportable event to the CAT to be in millisecond or finer increments.
Measures to Address Market Volatility (2012)
https://www.sec.gov/oiea/investor-alerts-bulletins/investor-alerts-circuitbreakersbulletinhtm.html
Catalyst: May 2010 Flash Crash
Objective: To address extraordinary market volatility in NMS Stocks.
Details:
The NMS Plan to Address Extraordinary Market Volatility was designed to address the type of sudden price
movements the market experienced during the Flash Crash. This includes:
• Limit Up-Limit Down Mechanism (LULD) – This addresses market volatility by preventing trades in listed
equity securities when triggered by large, sudden price moves in an individual stock, i.e. preventing trades
from occurring outside of a specified price band. This price band is set at a percentage level above and
below the average price of the stock over the immediately preceding five-minute trading period, including:
5%, 10%, 20%, or the lesser of $.15 or 75%, depending on the price of the stock (the price bands double
during the opening and closing periods of the trading day). If the stock price does not naturally move back
within the price bands within 15 seconds, there will be a five-minute trading pause.
• Revised Market-Wide Circuit Breakers – Market-wide circuit breakers provide for cross-market trading
halts during a severe market decline as measured by a single-day decrease in the S&P 500 Index, at these
thresholds: 7% (Level 1), 13% (Level 2), and 20% (Level 3). These triggers are set by the markets at point
levels that are calculated daily based on the prior day’s closing price of the S&P 500 Index. A market decline
that triggers a Level 1 or Level 2 circuit breaker before 3:25 p.m. will halt market-wide trading for 15 minutes,
while a similar market decline at or after 3:25 p.m. will not halt market-wide trading. A market decline that
SIFMA Insights Page | 30The Evolution of the US Equity Market Regulations
triggers a Level 3 circuit breaker, at any time during the trading day, will halt market-wide trading for the
remainder of the trading day.
• Large Trader Reporting Regime – This rule established large trader reporting requirements to identify
large market participants, collect information on their trading and analyze their trading activity. The new rule
required large traders to register with the SEC, assigning each trader a unique identification number. Large
traders will provide this number to broker-dealers, who will be required to maintain transaction records for
each large trader and report this information to the SEC upon request.
Regulation Systems Compliance and Integrity (Reg SCI, 2014)
https://www.sec.gov/rules/final/2014/34-73639.pdf
Catalyst: May 2010 Flash Crash & August 2012 Knight Trading errors, which lead to the firm’s demise
(acquired by Getco)
Objective: Ensure the resiliency of trading systems
Details:
The rules were designed to: reduce the occurrence of systems issues (glitches, crashes, etc.); improve resiliency
when systems problems do occur; and enhance regulatory oversight and enforcement of market technology
infrastructure. The regulation applies to SROs, registered clearing agencies, ATS trading NMS and non-NMS stocks
exceeding specified volume thresholds, disseminators of consolidated market data (plan processors) and certain
exempt clearing agencies. The regulation required exchanges to design, develop, test, maintain and surveil systems
for key securities market functions: trading, clearance and settlement, order routing, market data, market regulation
and market surveillance. Reg SCI did not necessarily introduce new procedures to the exchanges – systems
resiliency is important to combat reputational risk and their entire business model and exchanges continuously
invest in systems and technology – but rather put formal rules down on paper.
SIFMA Insights Page | 31Where We Stand Today
Where We Stand Today
Many market participants believe today’s market structure – although U.S. markets are among the deepest, most
liquid and most efficient in the world – has some “issues” due to unintended consequences rather than market
failures themselves. Regulatory "micromanagement" has led to complexity and fragmentation.
For example, the order protection (or trade through) rule has been blamed for intensifying market fragmentation.
Under this rule, only the quotes at the top of the book are protected. The rule requires traders to transact at the best
displayed price, forcing brokers to comb through all the exchanges and other trading venues in the market, rather
than searching for the quickest or most reliable execution. This can result in increased total trading costs, as well as
rising technology and exchange costs for market makers and brokers.
Some market participants feel the current regulatory structure forced the development of incentive programs and
order types to attract order flow, increasing complexity in markets. In addition, the equity markets place emphasis on
speed of execution, and markets process billions of trades per day, which take place in microseconds, or millionths
of a second (it takes a human 150,000 microseconds to click a computer mouse).
Some of these concerns around today’s markets were actually expressed when SEC Commissioners Cynthia
Glassman and Paul Atkins dissented to the Adoption of Regulation NMS. Some of their concerns included Reg NMS
being:
• In conflict with Congress’ goal to allow competition, not regulation, to drive the development of the national
market system
• Flawed in its underlying assumptions of how investors and markets should interact
• The potential cause of major distortions in the market, hurting competition and innovation
• Unnecessarily complex and not market-based
• Having too exclusive a focus on price as the measure of best ex, with the Commissioners preferring
clarification of a broker’s duty of best ex, since investors have different preferences
The SEC listened to market concerns and is undergoing a multi-year holistic review of market structure.
Commissioner Peirce noted, “NMS is not a goal to be achieved…it should be a continuously developing system that
is agile to respond quickly to new technologies and changing issuer and investor needs”.
Pilots to Assess Potential Changes
Historically, the SEC utilized pilot programs to test changes to market structure, and the agency currently has 17
active pilots, five of which apply market-wide, as opposed to a single exchange. The SEC has been reviewing all
active pilots, noting pilots come with real costs to market participants and therefore need a solid structure, a clearly
defined program, a set end date and an assessment system to measure success. The SEC needs to collect high-
quality data to determine if the proposed change helps markets or if it could it lead to a suboptimal solution.
SIFMA Insights Page | 32You can also read