Significant soil degradation is associated with intensive vegetable cropping in a subtropical area: a case study in southwestern China

Page created by Armando Martinez
 
CONTINUE READING
Significant soil degradation is associated with intensive vegetable cropping in a subtropical area: a case study in southwestern China
SOIL, 7, 333–346, 2021

                                                                                                      SOIL
https://doi.org/10.5194/soil-7-333-2021
© Author(s) 2021. This work is distributed under
the Creative Commons Attribution 4.0 License.

               Significant soil degradation is associated with
            intensive vegetable cropping in a subtropical area:
                    a case study in southwestern China
          Ming Lu1 , David S. Powlson2,3 , Yi Liang1 , Dave R. Chadwick2,4 , Shengbi Long5 , Dunyi Liu1 , and
                                                   Xinping Chen1,2
          1 College of Resources and Environment, Chongqing Key Laboratory of Efficient Utilization of Soil and
                             Fertilizer Resources, Southwest University, Chongqing 400715, China
            2 Interdisciplinary Research Center for Agriculture Green Development in the Yangtze River Basin,

                                         Southwest University, Chongqing 400715, China
                                        3 Department of Sustainable Agriculture Sciences,

                                Rothamsted Research, Harpenden, Hertfordshire AL5 2JQ, UK
        4 School of Environment, Natural Resources and Geography, Bangor University, Gwynedd LL57 2UW, UK
                       5 Jinping Station of Agricultural Technology Promotion, Guizhou 556700, China

                                  Correspondence: Dunyi Liu (liudy1989@swu.edu.cn)

                                 Received: 20 February 2021 – Discussion started: 8 March 2021
                              Revised: 7 June 2021 – Accepted: 9 June 2021 – Published: 2 July 2021

      Abstract. Within the context of sustainable development, soil degradation driven by land use change is con-
      sidered a serious global problem, but the conversion from growing cereals to vegetables is a change that has
      received limited attention, especially in subtropical regions. Here, we studied the effects of the conversion from
      paddy rice to an oilseed rape rotation to vegetable production in southwestern China on soil organic carbon
      (SOC), total nitrogen (TN), the C/N ratio, pH, phosphorus (P), potassium (K), calcium (Ca), and magnesium
      (Mg) based on face-to-face farmer surveys and soil analysis. In the vegetable cropping system, fertilizer appli-
      cation often exceeds the crop demand or levels recommended by the local extension service several times over.
      Thus, the crop use efficiency of N, P, K, Ca, and Mg was only 26 %, 8 %, 56 %, 23 %, and 28 %, respectively.
      In the vegetable cropping system studied, SOC, C stock, TN, and N stock were decreased significantly due to
      low organic inputs from crop residues and high tillage frequency. Furthermore, the soil C/N ratio decreased
      slightly; available P (AP) in the topsoil increased by 1.92 mg kg−1 for every 100 kg ha−1 of P surplus, and the
      critical levels of AP and CaCl2 -soluble P in P leaching were 104 and 0.80 mg P kg−1 . Besides, compared to
      the current paddy–rape rotation system, a clear trend of soil acidification was observed in the vegetable fields.
      However, increasing the contents of soil Ca and Mg significantly alleviated topsoil acidification, with the effect
      increasing over time. Given our findings, the potential benefits of conservation agricultural practices, integrated
      soil–crop system management strategies, and agricultural technology services for recovering the degraded soil
      and improving the vegetable productivity are discussed here.

Published by Copernicus Publications on behalf of the European Geosciences Union.
Significant soil degradation is associated with intensive vegetable cropping in a subtropical area: a case study in southwestern China
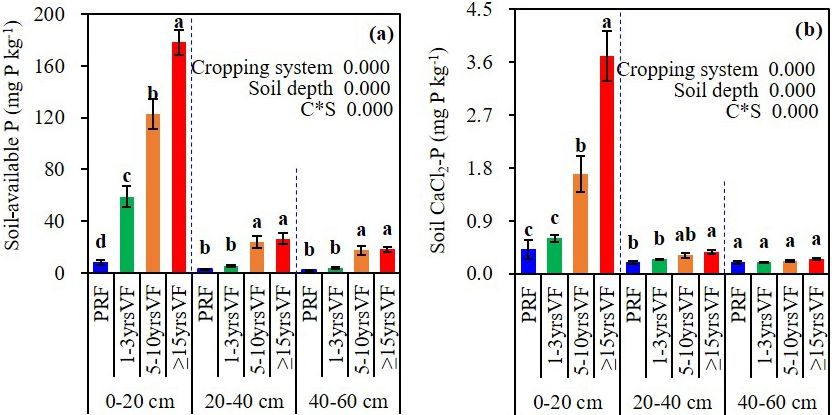
334                                  M. Lu et al.: Significant soil degradation is associated with intensive vegetable cropping

1   Introduction                                                       For instance, in southern China, the paddy soil is normally
                                                                    in areas of long-term flooding, has a relatively higher in-
Land use changes are an important anthropogenic perturba-           put of carbon, and receives two deep tillage operations an-
tion that can cause soil degradation (Lal, 2004, 2015), but         nually (Wang et al., 2014). In contrast, the vegetable fields
the impacts of land conversion from growing cereals to veg-         will be tilled three to four times per year, resulting in se-
etables have received little attention. From 1997to 2017, to-       vere disturbances in the surface soil layer (0–20 cm). Wang
tal vegetable production increased by 98 % worldwide, and           et al. (2014) also found that the SOC content and the C/N
the area harvested increased by 59 % (FAO, 2017). These in-         ratio in open-field vegetable systems converted from paddy
creases were driven by economic growth and an increased             fields were decreased by 19.7 % and 27.8 %, respectively,
demand for vegetables associated with a raised awareness of         which was mainly attributable to soil aggregate fragmenta-
their health benefits (Yan et al., 2012). The expansion of ter-     tion. However, there is no information available on the effects
restrial vegetable production is particularly significant in the    of land use changes, from cereals to vegetable production, on
tropics and subtropics because these regions have a longer          the status of SOC and TN in southwestern China.
growing season compared to temperate regions (Fischer et               Additionally, high inputs of N fertilizers to vegetable crops
al., 2012). On average, the sown area of non-grain crops            and the crop removal of base cations, such as calcium (Ca)
has increased by > 12 % since 1980 in China, with a cor-            and magnesium (Mg), are expected to trigger soil acidi-
responding decrease in grain crop cultivation (Chen et al.,         fication (Guo et al., 2010; Zhang et al., 2016). Neverthe-
2016). In contrast to cereal crops, vegetable production re-        less, according to our preliminary farmer survey in south-
quires more intensive management, including higher tillage          western China, agricultural production commonly received
frequencies and fertilization rates, and higher nutrient and        large inputs of Ca and Mg from various fertilizers. More-
water inputs due to the shallow root systems of most veg-           over, increasing research is being done to overcome crop
etable species (Wang et al., 2018a, b; Yan et al., 2013; Zhang      yield gaps by ameliorating soil micronutrient status (White
et al., 2017). Thus, vegetable production is associated with        and Broadley, 2009; Cakmak and Yazici, 2010). To date, the
a relatively higher risk of environmental pollution. For in-        combined impacts of these inputs and the removal of base
stance, Zhang et al. (2012) found that the per unit area of         cations on soil pH and other properties in vegetable produc-
nutrient inputs in vegetable production are 0.81–1.20 times         tion systems have not been studied.
greater than those for the cereal production system in China           Systematic surveys to elucidate the effects of different
and 1.5–12 times greater than those for vegetable cropping in       cropping systems on soil properties are needed for a clear
the rest of the world. In particular, overuse or misuse of fer-     understanding of the impacts of vegetable production and the
tilizers in vegetable fields is a long-standing problem across      proper development of sustainable, high-yield vegetable sys-
the world (Conley et al., 2009).                                    tems that do not cause environmental damage. The objectives
    Soil organic carbon (SOC) is widely regarded to be the          of this study were to assess the impacts of the land use con-
most reliable indicator for monitoring soil degradation (Lal,       version from a paddy–rape rotation to vegetable production
2015). Bünemann et al. (2018) reviewed soil quality assess-         on soil pH, SOC, TN, the soil C/N ratio, available P (AP),
ment approaches and summarized the indicators used; after           CaCl2 -soluble P (CaCl2 -P), and available base cations (K,
SOC, the most frequently used chemical indicators were soil         Ca, and Mg). In the present study, paddy rice–oilseed rape
pH, available phosphorus (P), available potassium (K), to-          rotation fields were used as a reference because all vegetable
tal nitrogen (TN), and bulk density. Numerous studies have          fields in this region were converted from paddy soil. This will
reported on the severity of soil degradation in greenhouse          allow the comparison between the conditions in areas that
vegetable fields converted from a maize–wheat rotation in           changed to open-field vegetable production with surround-
the North China Plain due to high fertilizer inputs and the in-     ing areas that have remained under paddy rice–oilseed rape
creased frequency of soil cultivation, resulting in a significant   rotations.
decrease in soil C/N ratio and pH, enrichment of P and K,
and salinization (Ju et al., 2007; Yan et al., 2012). However,
the impacts of land conversion from cereal cropping to veg-         2     Materials and methods
etable production may be more adverse in tropical and sub-
                                                                    2.1    Site descriptions and cropping systems
tropical regions compared to temperate regions due to higher
temperatures and rainfall combined, low organic inputs, and         The field study sites were located in the Jinping county in the
the high frequency of tillage practices (National Bureau of         eastern Guizhou province at 26◦ 230 –26◦ 460 N and 108◦ 480 –
Statistics, 2017; Powlson et al., 2016; Sarker et al., 2018).       109◦ 240 E (Fig. 1a). In this area, vegetables are produced
Based on the background information, here we hypothesize            on 4814 ha, representing an increase of 24 % between 2009
that the conversion of cereals to vegetable production would        and 2015, and the production increased by 132 % between
result in significant degradation in agricultural soils in south-   2011 and 2018 (84 886 t). The area covered by cereal crops
western China.                                                      (14 408 ha at the time of our study) decreased by 9 % from
                                                                    2009 to 2018 (official statistics from http://www.jinping.gov.

SOIL, 7, 333–346, 2021                                                                  https://doi.org/10.5194/soil-7-333-2021
Significant soil degradation is associated with intensive vegetable cropping in a subtropical area: a case study in southwestern China
M. Lu et al.: Significant soil degradation is associated with intensive vegetable cropping                                   335

cn/xxgk/zdgk/tjxx/tjgb/; last access: 1 April 2020). The re-         To investigate the effect of conventional fertilization on
gion is characterized by a typical subtropical humid monsoon      nutrient surplus, enrichment and/or depletion, and leaching
climate with an annual average precipitation of 1160 mm for       them into the soil profile of vegetable field, a multistage sam-
the 2007–2017 period, of which 85 % occurs between April          pling technique was used to select representative fields for
and October, and a mean annual air temperature of 15.9 ◦ C        sampling soils from each cropping system. First, we ran-
(Fig. 1b). The highest temperatures and rainfall occur in the     domly collected 36 soil samples from a total of 133 com-
same season. The main type of soil in this region is a typical    mercial vegetable fields that were converted from paddy–
Ultisol with a loamy clay texture (with an average content of     rape rotation 1–3 years (n = 12), 5–10 years (n = 12), and
sand 11.5 %, silt 43.5 %, and clay 45 %) and alluvial parent      ≥ 15 years (n = 12) ago. Second, 12 paddy–rape rotation
material based on the USDA (United States Department of           fields and the adjacent (< 100 m) vegetable fields were also
Agriculture) soil classification system. The soil depth is gen-   randomly sampled for comparison. The soil type of the se-
erally > 90 cm. The main crops grown are open-field vegeta-       lected sites and the local/regional climatic conditions and
bles, paddy rice, oilseed rape, and fruit trees.                  agricultural production practices were similar (Ju et al., 2017;
   Open-field vegetable production accounts for 70 %–80 %         Yan et al., 2012). Soil samples were collected from six spots
of the total area of dryland agricultural production, and the     at 20 cm depth intervals to a depth of 60 cm within each plot,
most common planting pattern (71 % of the total vegetable         and they were pooled by depth. Samples were collected at all
fields) is a pepper–Chinese cabbage rotation system. In this      selected vegetable and paddy fields from 25 to 31 Septem-
cropping system, peppers are transplanted in April and har-       ber 2018, after the crops (i.e., paddy rice and Chinese cab-
vested in mid-August. Then, non-heading Chinese cabbage is        bage) were harvested (Fig. 1b). In addition, three other soil
grown continually for three seasons, from August to January       cores (diameter 50.46 mm; length 200 mm) were collected
of the following year, followed by a fallow period until April    randomly from each field type for bulk density. The bulk den-
(Fig. 1b). During the annual rainfed cropping period, tillage     sity was measured using the cutting ring method. Each single
is performed four times (mainly tilled with a mini-sized fuel-    soil sample in this study incorporates 20 cm soil depth.
rotary cultivator at the depth of ca. 20 cm in the soil layer),
and fertilizers are applied 10 times (four times for pepper and   2.3   Soil analysis
twice for each Chinese cabbage crop). Conventional farming
practices commonly used throughout the region were used           In this study, the moist composite field samples were air dried
for all crops. In the paddy rice–oilseed rape double-cropping     and passed through a 1 mm sieve for the analysis of soil pH,
system, paddy rice is grown from late May to September, and       CaCl2 -P, available P (AP), water-soluble K, Ca, and Mg and
then oilseed rape is grown from mid-October to early May of       exchangeable K, Ca, and Mg. The samples were then passed
the following year.                                               through a 0.15 mm sieve for SOC and TN analysis (Yan et al.,
                                                                  2012; Wang et al., 2014; Gómez et al., 2020). Soil analysis
2.2   Farmer surveys and soil sampling
                                                                  methods for specific parameters and their corresponding soil
                                                                  size preparation standards (described previously) were used
In this study, the focus was only on the typical vegetable pro-   in this study (Lu, 2000). Soil pH in water with a 1 : 2.5 soil-
duction (pepper – Chinese cabbage – Chinese cabbage – Chi-        to-water ratio was measured using a potentiometer. SOC was
nese cabbage – fallow rotation) and the paddy rice–oilseed        measured using ferric sulfate titration after dichromate di-
rape rotation. A survey of management practices was con-          gestion. Soil TN was measured by the semi-automatic Kjel-
ducted through face-to-face interviews with farmers in Jin-       dahl method after sulfuric acid digestion. Soil AP (Bray-
ping county in Guizhou province. Based on the farmers’ sur-       P) content was measured by the molybdovanado phosphate
vey methodology (Jia et al., 2013), two of the most impor-        method following soil extraction with 0.03 mol L−1 NH4 F
tant vegetable production townships in Jinping county, Xin-       and 0.025 mol L−1 HCl and using a 1 : 10 ratio (w/v) of soil
hua and Dunzhai, were selected in this area. In each town-        to solution. CaCl2 at 0.01 mol L−1 and a 1 : 5 soil to solu-
ship, four villages were randomly selected, and 15–20 farm-       tion ratio were used to determine the soil CaCl2 -P content
ers from each village who had managed paddy–rape rota-            using a UV-visible spectrophotometer. Soil-water-soluble K,
tion before switching to the vegetable cropping system were       Ca, and Mg were determined after extraction with water
randomly surveyed. Survey questions were related to crop          (soil-to-water ratio of 1 : 5), and exchangeable K, Ca, and
varieties and the management of the two cropping systems,         Mg were extracted with 1 mol L−1 neutral NH4 OAc (w/v,
including sowing rate, fertilizer (chemical or organic) appli-    1 : 12.5) and measured using an ICP-OES (inductively cou-
cation rate, tillage frequency, crop residue management, crop     pled plasma optical emission spectroscopy).
growth cycle, cropping duration, and yield. A total of 24 sur-
veys were related to paddy–rape rotation management and           2.4   Calculation of nutrient inputs and balance
133 surveys for vegetable production. The field sizes of the
paddy–rape rotation and vegetable cropping were 0.03–0.13         Detailed records were made for the farm management prac-
and 0.01–0.08 ha, respectively.                                   tices employed in each field from 2017 to 2018, and we con-

https://doi.org/10.5194/soil-7-333-2021                                                                SOIL, 7, 333–346, 2021
Significant soil degradation is associated with intensive vegetable cropping in a subtropical area: a case study in southwestern China
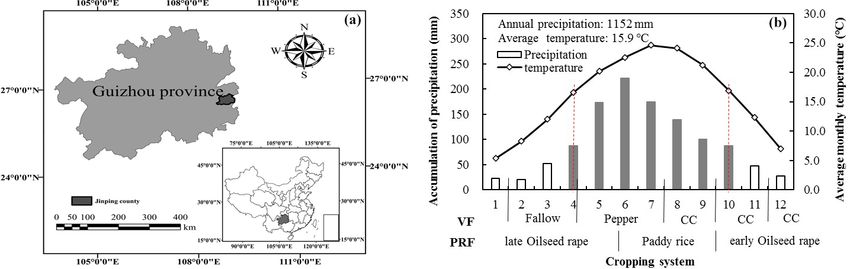
336                                  M. Lu et al.: Significant soil degradation is associated with intensive vegetable cropping

Figure 1. The location (a), meteorological conditions (values averaged between 2007 and 2017), and typical cropping systems (b) of the
study area. CC – non-heading Chinese cabbage; VF – vegetable production; PRF – paddy rice–oilseed rape rotation.

firmed that the management history of each field was simi-            on soil properties. Differences in soil nutrient contents and
lar to the management practices employed during the survey            stock among cropping systems were assessed using one-way
year. The main mineral fertilizers used in this region were           ANOVA, and mean values were compared using the least
urea, potassium sulfate, compound or mixed fertilizers, cal-          significant difference test with a significance level of 5 %.
cium superphosphate and fused calcium–magnesium phos-                 Correlations were analyzed using a two-tailed Pearson test
phate. Organic fertilizers included crop residues and com-            with a significance level of 5 %. The linear-plateau model
mercial organic fertilizer, animal manure (from chickens,             in SAS (version 9.2 for Windows; SAS Institute, Cary, NC,
cows, and pigs and rapeseed meal). In the paddy–rape rota-            USA) was used to analyze the relationship between SOC and
tion, rice straw was directly returned after the grains were          tillage frequency in the 0–20 cm surface layer in vegetable
harvested, whereas oilseed rape straw was burned in the               soil, and the two-segment linear model in SigmaPlot (ver-
fields. Most above- and belowground residues in the veg-              sion 12.5 for Windows; Systat Software, Inc, San Jose, CA,
etable production were removed during harvest. Besides, nu-           USA) was used to analyze the relationship between soil AP
trient removal due to grain harvest or the removal of above-          and CaCl2 -P.
ground crop parts was calculated using yields reported by
farmers and the published nutrient contents typical of the re-
gion. Nutrient surplus was calculated by subtracting nutrient         3     Results
removal through grain and vegetable harvest from total fer-
                                                                      3.1    Yields, fertilizer application, and nutrient balance
tilizer inputs (Ju et al., 2007).
                                                                      Total annual inputs of N, P, Ca, and Mg in the vegetable crop-
2.5   Calculation of SOC and TN stock, accumulation of P              ping were several times higher than those in the paddy–rape
      surplus, and changes in soil AP                                 rotation (2.38, 2.97, 4.40 and 7.14 times, respectively), but
                                                                      the total annual K inputs were similar (Table 1). K, Ca, and
The SOC and TN stocks in the paddy–rape rotation and veg-             Mg inputs were mainly from organic sources in the paddy–
etable fields were calculated by multiplying SOC and TN               rape rotation, i.e., a combination of organic fertilizers and
contents with bulk density and depth. Accumulation of P               crop residues, representing 65 %, 80 %, and 65 % of the total
surplus was calculated as the annual P surplus multiplied by          inputs, respectively, while chemical fertilizer supplied 61 %
years since conversion to vegetable production, and changes           and 72 % of total N and P inputs. In contrast, in the vegetable
in soil AP in vegetable field were calculated as soil AP in           production, these nutrients were mainly supplied by chemi-
paddy–rape field subtracted from that in the vegetable field.         cal fertilizers, which comprised 75 %, 86 %, 71 %, 75 %, and
                                                                      79 % of the total inputs for N, P, K, Ca, and Mg, respectively.
2.6   Statistical analysis                                            Fertilizer application rates did not differ significantly in the
                                                                      vegetable system according to the time since conversion from
SPSS software (IBM SPSS Statistics for Windows, version               paddy–rape rotation, and its yields also did not differ signifi-
21.0; IBM Corporation, Armonk, NY, USA) was used for                  cantly (Table 1).
statistical analysis. A two-way repeated measures analy-                 In the paddy–rape rotation crop, straw was returned
sis of variance (ANOVA) was performed to assess the ef-               to the field after grain harvest, while all plant biomass
fects of cropping systems, soil depth, and their interactions         was completely removed during harvest in the vegetable

SOIL, 7, 333–346, 2021                                                                     https://doi.org/10.5194/soil-7-333-2021
Significant soil degradation is associated with intensive vegetable cropping in a subtropical area: a case study in southwestern China
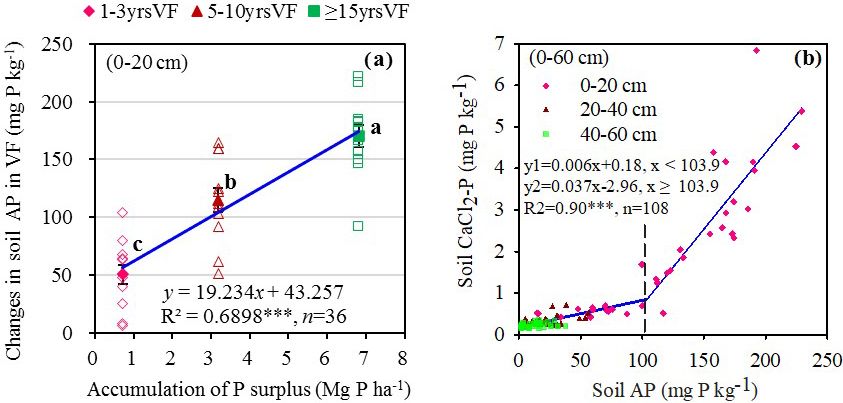
M. Lu et al.: Significant soil degradation is associated with intensive vegetable cropping                                                                    337

Table 1. Average annual nutrient inputs, outputs, and surplus in paddy rice–oilseed rape rotation, and vegetable production converted from
paddy–rape rotation 1–3, 5–10, or ≥ 15 years ago in southwestern China. Values are means ± standard deviation.

                 Cropping system                                       Paddy rice–oilseed                        Vegetable production
                                                                               rape rotation          1–3 years         5–10 years         ≥ 15 years
                 Inputs (kg ha−1 yr−1 )
                 Organic fertilizersa
                   N                                                              175 ± 17.4         314 ± 135          151 ± 104           344 ± 137
                   P                                                             35.2 ± 4.40        69.7 ± 33.3        32.5 ± 19.3        58.8 ± 26.7
                   K                                                              383 ± 26.4         155 ± 69.3         101 ± 58.5         210 ± 72.7
                   Ca                                                             188 ± 22.3         262 ± 150          144 ± 118           388 ± 147
                   Mg                                                            20.4 ± 2.87        50.7 ± 24.8        25.1 ± 19.1        65.4 ± 24.6
                 Chemical fertilizers
                   N                                                              272 ± 24.7          843 ± 185         882 ± 332           672 ± 138
                   P                                                             90.6 ± 5.98         305 ± 93.9          399 ± 103         256 ± 73.3
                   K                                                              206 ± 37.3         480 ± 106          363 ± 122          315 ± 87.0
                   Ca                                                            47.9 ± 21.1         457 ± 315         1271 ± 322           598 ± 305
                   Mg                                                            10.8 ± 4.76         103 ± 71.0         287 ± 72.6         135 ± 68.9
                 Total fertilizers
                   N                                                              447 ± 35.3        1153 ± 186         1030 ± 323         1013 ± 185
                   P                                                             125 ± 8.60         375 ± 95.2           431 ± 100        314 ± 71.9
                   K                                                             589 ± 55.0          634 ± 129          463 ± 129           526 ± 100
                   Ca                                                            236 ± 33.3          719 ± 383         1414 ± 328          985 ± 68.0
                   Mg                                                            31.1 ± 6.06        153 ± 78.6          311 ± 72.8         200 ± 316
                 Outputs (yr−1 )
                 Crop yield (Mg ha−1 )b                                          8.69 ± 0.31        99.5 ± 8.89        81.3 ± 9.46        95.6 ± 8.01
                 Nutrient removal at harvest (kg ha−1 )c
                   N                                                              112 ± 3.77         287 ± 46.2         255 ± 49.1         284 ± 41.6
                   P                                                             41.7 ± 1.45        32.0 ± 4.18        27.5 ± 4.44        31.4 ± 3.76
                   K                                                             33.8 ± 1.20         321 ± 48.0         281 ± 51.1         316 ± 43.2
                   Ca                                                            17.1 ± 0.57         261 ± 18.1         208 ± 19.3         248 ± 27.1
                   Mg                                                            13.6 ± 0.46        65.1 ± 8.45        55.8 ± 8.98        63.5 ± 7.60
                 Nutrient surplus (kg ha−1 yr−1 )
                   N                                                              335 ± 32.2          866 ± 217         775 ± 337           728 ± 187
                   P                                                             84.0 ± 7.52         343 ± 95.6         404 ± 87.5         283 ± 70.4
                   K                                                              555 ± 53.9         313 ± 172          182 ± 148           210 ± 106
                   Ca                                                             219 ± 32.9         458 ± 398         1206 ± 323           737 ± 314
                   Mg                                                            17.6 ± 5.74        88.6 ± 85.5         256 ± 72.0         137 ± 67.1
               a Organic fertilizers included crop residues, commercial organic fertilizers, animal manure (from chickens, cows, and pigs), and rapeseed
               meal. In the paddy–rape rotation, rice straw was directly returned after the grains were harvested, whereas oilseed rape straw was burned in
               the fields. Most above- and belowground residues in the vegetable production were removed during harvest. b Vegetable yields are
               expressed as the annual sum of fresh weights per season, and yields in the paddy–rape rotation are expressed as the annual sum of air-dried
               weights per season. c Only grains were harvested in the paddy–rape rotation and most of the above- and belowground residues were
               returned to the fields. All vegetable parts were removed from the fields during harvest.

cropping. Consequently, 2.46, 9.05, 14.0, and 4.52 times                                 3.2     Changes in SOC and soil TN
more N, K, Ca, and Mg were removed, respectively,
from the vegetable field than that of the paddy–rape,
                                                                                         The contents (or value) of SOC, TN, the C/N ratio, and
but the P removal rate was slightly lower. Large sur-
                                                                                         C and N stocks were compared between the two cropping
pluses of N (790 kg N ha−1 yr−1 ), P (343 kg P ha−1 yr−1 ),
                                                                                         systems (Table 2). Conversion from paddy–rape rotation to
K (235 kg K ha−1 yr−1 ), Ca (800 kg Ca ha−1 yr−1 ), and Mg
                                                                                         open-field vegetable led to a significant decrease in both TN
(161 kg Mg ha−1 yr−1 ) were observed in the vegetable field
                                                                                         content and stock in the topsoil (0–20 cm), with mean de-
(Table 1).
                                                                                         creases of 15.8 % and 17.6 % (P < 0.05), respectively, while
                                                                                         no significant changes in TN in the two deeper soil layers
                                                                                         (20–60 cm) were observed in the vegetable field. However,

https://doi.org/10.5194/soil-7-333-2021                                                                                                    SOIL, 7, 333–346, 2021
Significant soil degradation is associated with intensive vegetable cropping in a subtropical area: a case study in southwestern China
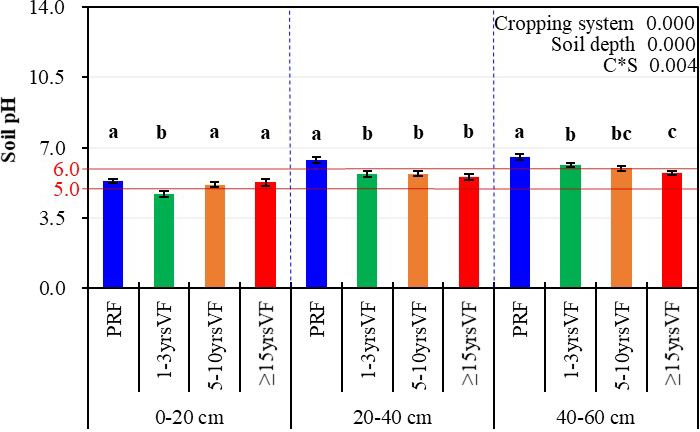
338                                 M. Lu et al.: Significant soil degradation is associated with intensive vegetable cropping

intensive vegetable production led to a significant decrease      3.4   Changes in soil-available K, Ca, and Mg
in topsoil SOC content and stock, even after only 1–3 years.
                                                                  The K nutrient removed via harvested crops in the
The C stock in the 0–20 cm soil layer decreased by 10.3 % af-
                                                                  paddy–rape rotation (33.8 kg K ha−1 yr−1 ) was only 11 %
ter 1–3 years and increased to 24.3 % after 5–10 years. Sim-
                                                                  of that removed from the vegetable production (average –
ilar trends were observed in the 20–40 and 40–60 cm soil
                                                                  306 kg K ha−1 yr−1 ; Table 1). Thus, the K surplus in the
layers. Because proportional decreases in SOC were slightly
                                                                  paddy–rape was, on average, 2.36 times that of the veg-
greater than those for TN, the soil C/N ratio became slightly
                                                                  etable field. However, soil-available K levels (water-soluble
smaller following the conversion of paddy–rape field to veg-
                                                                  and exchangeable fractions) were considerably higher in the
etable field, with the trend most apparent in the 40–60 cm soil
                                                                  vegetable field for all three soil layers (Fig. 5a and d). The
layer. The C/N ratio, however, decreased by 24.3 % after 5–
                                                                  depth distribution of soil-available K indicated that there was
10 years.
                                                                  substantial downward movement of K. The accumulation of
   The average bulk density in the topsoil tended to decrease
                                                                  available K, but not exchangeable K, in each soil layer in-
upon the land use conversion but did not change significantly
                                                                  creased with the number of planting years since the conver-
following years of vegetable production. On average, C stock
                                                                  sion to vegetable production. Water-soluble K contents in the
in the 0–60 cm soil layer over all vegetable fields was 16.4 %
                                                                  0–20, 20–40, and 40–60 cm soil layers in the vegetable sys-
(P < 0.05) less than that in the paddy–rape rotation, with
                                                                  tem which had continuous vegetable farming over 15 years
values ranging between 97.8 and 117 Mg C ha−1 yr−1 .
                                                                  were 26 %, 40 %, and 275 % higher, respectively, than those
   One major reason for the SOC decline after the conversion
                                                                  of new vegetable fields (cultivated for 1–3 years) but were
to a vegetable field was that the organic C input in the paddy–
                                                                  also 193 %, 180 %, and 650 % higher than those in paddy–
rape rotation was 1.35-fold higher than that of the vegetable
                                                                  rape rotation, respectively.
cropping (Fig. 2a). Tillage operations were performed more
                                                                     Water-soluble Ca was significantly higher in the vegetable
frequently in the vegetable fields, i.e., four times per year
                                                                  field (0–60 cm), and its level increased in the first 10 years
instead of two in the paddy–rape rotation, and it clearly af-
                                                                  after conversion from paddy–rape rotation but not thereafter
fected topsoil SOC (0–20 cm) but not in the deeper layers
                                                                  (Fig. 5b). Similarly, the exchangeable Ca in the topsoil (0–
(Fig. 2b). Moreover, soil N stock in the vegetable fields gen-
                                                                  20 cm) also increased with farming duration (Fig. 5e). The
erally decreased in line with SOC stock, with a slight varia-
                                                                  soil-available Mg (water-soluble and exchangeable fractions)
tion in this trend observed in the 40–60 cm layer (Fig. 2c).
                                                                  content was also increased after conversion from paddy–rape
                                                                  rotation conversion to vegetable production and followed the
                                                                  same general trend as that of Ca (Fig. 5c and f).
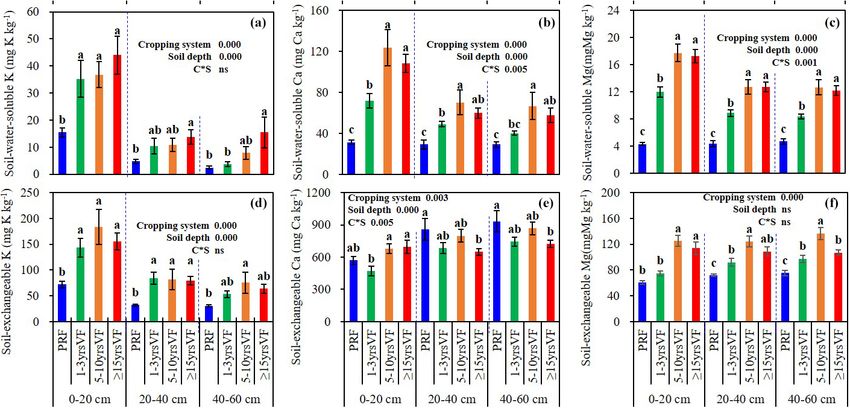
3.3   Change in soil-available P

Soil AP and CaCl2 -P content in the 0–60 cm soil layer were       3.5   Change in soil pH and its effect factors
significantly higher in the vegetable field than in the paddy–    Soil in the paddy–rape rotation system was slightly acidic,
rape soil, with levels increasing with time since the conver-     especially in the topsoil (0–20 cm), with an average pH of
sion to vegetable production (Fig. 3). For example, compared      5.34 across the fields sampled. It initially decreased to ap-
to the paddy–rape rotation, soil AP and CaCl2 -P were 22-         proximately pH 4.7 after conversion to the vegetable field
and 9-fold higher, respectively, in the vegetable production      but recovered eventually (Fig. 6). The initial pH was higher
system, where vegetables were farmed continuously over            in the deeper soils (ca. pH 6.5) than in the 0–20 cm layer in
15 years. These increases in deeper soil layers are indicative    the paddy–rape rotation, but it was significantly lower in the
of downward movement of P. In term of the surface layer           vegetable field. The soil-exchangeable Ca and soil pH were
(0–20 cm) in the vegetable field, the accumulation of P sur-      significantly and positively correlated in both the vegetable
plus (P inputs minus crop offtake) was significantly and pos-     field and paddy–rape rotation system, particularly in the veg-
itively correlated with differences in soil AP between veg-       etable cropping system (Table 3), while soil-exchangeable
etable cropping system and paddy–rape rotation at the end of      Mg exhibited the same trend in the vegetable field. In addi-
the growing season (Fig. 4a). For every 100 kg ha−1 of P sur-     tion, excessive N and K surplus were significantly correlated
plus in the vegetable field, the AP content in the 0–20 cm soil   with decreased soil pH in the 0–20 cm soil layer. Conversely,
layer was increased by 1.92 mg kg−1 . The phenomenon of a         the enrichment of soil P had a negative effect on soil pH.
change point has previously been observed in the relation-
ship between soil AP and CaCl2 -P (Hesketh and Brookes,
2000) and is used as an indicator of the risk of P loss. In the
vegetable field, AP and CaCl2 -P values of 0–20 cm soil at
the change point, as calculated using a two-segment linear
model, were 104 and 0.80 mg P kg−1 , respectively (Fig. 4b).
Above the change point, soil CaCl2 -P increased rapidly with
increasing AP.

SOIL, 7, 333–346, 2021                                                                https://doi.org/10.5194/soil-7-333-2021
M. Lu et al.: Significant soil degradation is associated with intensive vegetable cropping                                                                                 339

Table 2. Soil organic carbon (SOC) and total nitrogen (TN) contents, soil C/N ratio, C and N stocks, and soil bulk density in the 0–20,
20–40, and 40–60 cm soil layers in paddy rice–oilseed rape rotation and vegetable production converted from paddy–rape rotation 1–3, 5–10,
or ≥ 15 years ago in southwestern China.

         Soil depth       Cropping         Bulk density                   SOC              C stock                   TN             N stock          Soil C/N ratio
         (cm)             system              (g cm−3 )             (g C kg−1 )        (Mg C ha−1 )           (g N kg−1 )       (Mg N ha−1 )
         0–20             PRF              1.34 ± 0.01a          21.5 ± 0.37a          57.5 ± 0.99a         1.95 ± 0.04a         5.21 ± 0.10a          11.1 ± 0.15a
                          1–3yr VF         1.31 ± 0.01b          19.6 ± 0.58b          51.2 ± 1.51b         1.78 ± 0.07b         4.64 ± 0.19b          11.1 ± 0.27a
                          5–10yr VF        1.30 ± 0.00b          16.7 ± 0.60c          43.4 ± 1.54c         1.54 ± 0.02c         4.00 ± 0.06c          10.9 ± 0.40b
                          ≥ 15yr VF        1.30 ± 0.01b          16.9 ± 0.56c          43.8 ± 1.45c         1.59 ± 0.03c         4.14 ± 0.08c          10.6 ± 0.31b
         20–40            PRF              1.37 ± 0.00a          12.8 ± 0.55a          35.1 ± 1.50a         1.22 ± 0.04a         3.34 ± 0.10a          10.5 ± 0.20a
                          1–3yr VF         1.36 ± 0.01a         12.3 ± 0.52ab         33.4 ± 1.42ab         1.25 ± 0.04a         3.39 ± 0.11a          9.83 ± 0.19b
                          5–10yr VF        1.37 ± 0.00a         11.6 ± 0.29ab          31.6 ± 0.78b         1.18 ± 0.03a         3.24 ± 0.08a          9.77 ± 0.15b
                          ≥ 15yr VF        1.36 ± 0.01a          11.3 ± 0.30b          30.6 ± 0.83b         1.25 ± 0.02a         3.39 ± 0.06a          9.01 ± 0.20c
         40–60            PRF              1.39 ± 0.02a          8.67 ± 0.42a          24.0 ± 1.16a         0.89 ± 0.03a         2.47 ± 0.08a          9.84 ± 0.58a
                          1–3yr VF         1.37 ± 0.01a          6.98 ± 0.32b          19.1 ± 0.89b         0.94 ± 0.03a         2.57 ± 0.08a          7.41 ± 0.19b
                          5–10yr VF        1.37 ± 0.01a         7.77 ± 0.32ab          21.2 ± 0.88b         0.93 ± 0.03a         2.53 ± 0.09a          8.44 ± 0.38b
                          ≥ 15yr VF        1.37 ± 0.01a          7.02 ± 0.21b          19.2 ± 0.59b         0.98 ± 0.03a         2.68 ± 0.09a          7.27 ± 0.32b
         Source of variation
         Cropping systems (C)                       0.000                 0.000                 0.000                0.000                0.000                 0.000
         Soil depth (S)                             0.000                 0.000                 0.000                0.000                0.000                 0.000
         C ·S                                          ns                 0.000                 0.000                0.000                0.000                 0.003
       Values (± standard deviation) were averaged over 12 replicates. The least significant difference test was performed to compared values in each soil layer, and
       different lowercase letters indicate significant differences at P < 0.05 among cropping systems. ANOVA results are shown at the bottom. Note: ns – no significant
       difference; PRF – paddy rice–oilseed rape rotation; VF – vegetable production.

Figure 2. Organic C inputs in paddy rice–oilseed rape rotation and vegetable production (a), the relationship between SOC content and the
accumulative number of tillage operations since conversion to the vegetable cropping system (b), and the relationship between soil N stock
and soil C stock in the 0–20, 20–40, and 40–60 cm soil layers in the vegetable production (c). Error bars represent the standard deviation.
Significance levels are ∗ P < 0.05, ∗∗ P < 0.01, and ∗∗∗ P < 0.001. Note: ns – non-significant difference; VF – vegetable production; PRF
– paddy rice–oilseed rape rotation.

4     Discussion                                                                            ern China. The annual application rates of fertilizer N, P,
                                                                                            and K in the vegetable production (Table 1) were much
4.1    Nutrient balance                                                                     higher than those recommended (N – 600–765 kg ha−1 ; P
                                                                                            – 79–144 kg ha−1 ; K – 398–498 kg ha−1 ) based on crop re-
Through the farmer surveys, we obtained a considerable                                      quirements and soil properties (i.e., the agriculture extension
amount of data on the fertilizer application rates in the                                   agencies; Zhang et al., 2009). In the paddy–rape rotation, fer-
paddy–rape rotation and vegetable production systems.                                       tilizer N and K inputs were also much higher than the recom-
These two cropping systems are mainly used in southwest-

https://doi.org/10.5194/soil-7-333-2021                                                                                                       SOIL, 7, 333–346, 2021
340                                   M. Lu et al.: Significant soil degradation is associated with intensive vegetable cropping

Figure 3. Changes in soil-available phosphorus (P) (a) and CaCl2 -P (b) in the 0–20, 20–40, and 40–60 cm soil layers in the paddy rice–
oilseed rape rotation and vegetable production converted from the paddy–rape rotation in southwestern China 1–3, 5–10, or ≥ 15 years ago.
For each soil layer, different lowercase letters indicate significant differences at P < 0.05. Error bars represent standard deviation. ANOVA
results are shown at the top right corner. Note: VF – vegetable production; PRF – paddy rice–oilseed rape rotation.

Figure 4. The relationship between the change in soil-available phosphorus (AP) in vegetable production after conversion from paddy rice–
oilseed rape rotation and the accumulation of P surplus in the 0–20 cm soil layer (a) and the change point (dashed line) in the relationship
between soil CaCl2 -P and AP in the 0–20 cm soil layer in the vegetable production (b). Different lowercase letters indicate significant
differences at P < 0.05 among cropping systems (conversion to vegetable fields 1–3, 5–10, or ≥ 15 years ago). Error bars represent standard
deviation. Note: ∗∗∗ P < 0.001; VF – vegetable production; PRF – paddy rice–oilseed rape rotation.

mended levels (N – 255–330 kg ha−1 ; K – 12–174 kg ha−1 ),               even lower than the values reported previously (15 %–20 %;
but the annual fertilizer P rate was close to the local recom-           Conley et al., 2009; Yan et al., 2013; Zhang et al., 2008).
mended rate (P – 33–79 kg ha−1 ; Zhang et al., 2009). Con-                   Vegetable yields and fertilizer use efficiency in southwest-
sequently, nutrients surplus developed under both cropping               ern China could be due to relatively little support from local
systems but were especially large in the vegetable produc-               extension services (Ju et al., 2007), including a lack of fer-
tion. Thus, on average, N, P, K, Ca, and Mg use efficiencies             tilization recommendations and farmer education materials,
(nutrients removed in the harvested crop expressed as a per-             remoteness of advisers from the production fields, and a lack
centage of nutrient input) were 26 %, 8 %, 56 %, 23 %, and               of training for most farmers. It also could be ascribed to the
28 %, respectively. Vegetable crops at the national scale have           small farm size, with the average farm size in this region be-
an estimated N use efficiency of 26 ± 13 % in China, which               ing 0.07 to 0.1 ha (Zhang, 2017). Field size is often used as
is consistent with our finding (Ti et al., 2015). The low P use          a proxy for the level of professionalism exhibited by farm-
efficiency of vegetable crops found in the present study is              ers and awareness of efficient nutrient management practices
                                                                         (Ju et al., 2016; Wu et al., 2018), while smallholder farmers

SOIL, 7, 333–346, 2021                                                                         https://doi.org/10.5194/soil-7-333-2021
M. Lu et al.: Significant soil degradation is associated with intensive vegetable cropping                                             341

Figure 5. Soil-water-soluble potassium (K) (a), water-soluble calcium (Ca) (b), water-soluble magnesium(Mg) (c), soil-exchangeable (in-
cluding the water-soluble fraction) K (d), exchangeable Ca (e), and exchangeable Mg (f) in the 0–20, 20–40, and 40–60 cm soil layers in
the paddy rice–oilseed rape rotation and vegetable production converted from the paddy–rape rotation in southwestern China 1–3, 5–10,
or ≥ 15 years ago. For each soil layer, different lowercase letters indicate significant differences at P < 0.05 among the cropping systems.
Error bars represent standard deviation. The ANOVA result is shown in the blank space of the plot. Note: ns – no significant difference; VF
– vegetable production; PRF – paddy rice–oilseed rape rotation.

                                                                        in China generally have a low awareness of fertilizer-saving
                                                                        practices, and farm size significantly influences the usage in-
                                                                        tensity and efficiency of agricultural chemicals.
                                                                            Previous work in our group has shown that there is con-
                                                                        siderable scope for increasing yields and decreasing fer-
                                                                        tilizer use in vegetable production. For instance, Wang et
                                                                        al. (2018b) investigated the status quo of pepper produc-
                                                                        tion in the same subtropical region of China and found
                                                                        that both nutriment management (in particular, decreasing
                                                                        the application of N and P fertilizer) and crop management
                                                                        (mainly planting density) account for the yield difference
                                                                        among four groups of pepper considerably, and nutrient dis-
                                                                        charge remains the major contributor of environmental dis-
                                                                        turbances (e.g., global warming potential, eutrophication po-
                                                                        tential, and acidification potential). Furthermore, integrated
                                                                        soil–crop system management approaches (ISSM) based on
Figure 6. Soil pH in 0–20, 20–40, and 40–60 cm soil layers in           advanced crop and nutrient management have been success-
the paddy rice–oilseed rape rotation and vegetable production con-      fully developed for cereal cropping in China (Chen et al.,
verted from the paddy–rape rotation in southwestern China 1–3,          2014). The grain yields of maize, rice, and wheat can be
5–10, or ≥ 15 years ago. For each soil layer, different lowercase       increased by 35 % (n = 5406), 18 % (n = 6592), and 24 %
letters indicate significant differences at P < 0.05 among cropping     (n = 6940), respectively, with no increase in fertilizer in-
systems. Error bars represent the standard deviation. The ANOVA         puts and, often, achieve a decrease in fertilizer use instead
result is shown in the top right corner. Note: VF – vegetable pro-      when using the ISSM approach (Chen et al., 2014). An in-
duction; PRF – paddy rice–oilseed rape rotation.                        tegrated management system has been developed for green-
                                                                        house pepper production in the Yangtze River basin (Wang
                                                                        et al., 2020). After implementing ISSM for 2 years, pep-

https://doi.org/10.5194/soil-7-333-2021                                                                        SOIL, 7, 333–346, 2021
342                                                                                                                                                                                                                                                                     M. Lu et al.: Significant soil degradation is associated with intensive vegetable cropping

                                                                                                                                                                                                                                                                                                                                                                                                                                                                                                          per yield was increased by 16 %, and the N application rate
       PRF – paddy rice–oilseed rape rotation; VF – vegetable production. Significance levels are ∗ P < 0.05 and ∗∗ P < 0.01.
       SOC – soil organic carbon; TN – total nitrogen; AP – soil-available phosphorus; Ws-K (Ca, Mg) – soil water-soluble potassium (calcium, magnesium); Ex-K (Ca, Mg) – soil exchangeable K (Ca, Mg; includes the water-soluble fraction);

                                                                                                                                                                                                                                                                                         rape rotation fields.
                                                                                                                                                                                                                                                                                                                 Table 3. Pearson correlation analysis of the relationships between soil properties and soil pH in the 0–20, 20–40, and 40–60 cm soil layers in vegetable fields and paddy rice–oilseed
                                                                                                                                                                                                                                               PRF (n = 12)

                                                                                                                                                                                                                                                              VF (n = 36)
                                                                                                                                                                                                                                                                            (cm)
                                                                                                                                                                                                                                                                            Soil depth
                                                                                                                                                                                                                                                                                                                                                                                                                                                                                                          was decreased by 54 %, which is a cumulative outcome of

                                                                                                                                                                                                                                                 40–60 cm
                                                                                                                                                                                                                                                 20–40 cm
                                                                                                                                                                                                                                                 0–20 cm

                                                                                                                                                                                                                                                               40–60 cm
                                                                                                                                                                                                                                                               20–40 cm
                                                                                                                                                                                                                                                               0–20 cm
                                                                                                                                                                                                                                                                                                                                                                                                                                                                                                          optimized soil management, plant population, and nutrient
                                                                                                                                                                                                                                                                                                                                                                                                                                                                                                          management (Wang et al., 2020). Thus, local extension ser-
                                                                                                                                                                                                                                                                                                                                                                                                                                                                                                          vices could provide support and resources for applying in-
                                                                                                                                                                                                                                                                                                                                                                                                                                                                                                          tegrated soil–crop system management methods to increase

                                                                                                                                                                                                                                                              −0.46∗∗
                                                                                                                                                                                                                                                               −0.313
                                                                                                                                                                                                                                                                                                                                                                                                                                                                                                          vegetable production, minimize nutrients surplus, and miti-

                                                                                                                                                                                                                                                                −0.40

                                                                                                                                                                                                                                                                                 SOC
                                                                                                                                                                                                                                               0.05
                                                                                                                                                                                                                                               0.30
                                                                                                                                                                                                                                               0.21

                                                                                                                                                                                                                                                                                                                                                                                                                                                                                                          gate soil degradation of vegetable fields in the study region.
                                                                                                                                                                                                                                                              −0.54∗∗
                                                                                                                                                                                                                                                              −0.45∗∗
                                                                                                                                                                                                                                                                                                                                                                                                                                                                                                          4.2   SOC and N stocks
                                                                                                                                                                                                                                                               −0.02
                                                                                                                                                                                                                                               0.01
                                                                                                                                                                                                                                               0.51
                                                                                                                                                                                                                                               0.35

                                                                                                                                                                                                                                                                                 TN
                                                                                                                                                                                                                                                                                                                                                                                                                                                                                                          Our study provides unequivocal evidence for a sharp decline
                                                                                                                                                                                                                                                                                                                                                                                                                                                                                                          in SOC and TN content and stocks after converting the long-
                                                                                                                                                                                                                                                              −0.34∗
                                                                                                                                                                                                                                               −0.22

                                                                                                                                                                                                                                                                                                                                                                                                                                                                                                          established paddy–rape rotation to open-field vegetable pro-
                                                                                                                                                                                                                                               0.69∗

                                                                                                                                                                                                                                                                            C/N
                                                                                                                                                                                                                                                                            ratio
                                                                                                                                                                                                                                                0.02

                                                                                                                                                                                                                                                                0.05
                                                                                                                                                                                                                                                                0.10

                                                                                                                                                                                                                                                                                                                                                                                                                                                                                                          duction. The trend was clearest in the topsoil, where initial
                                                                                                                                                                                                                                                                                                                                                                                                                                                                                                          levels of SOC and TN were the highest, but it was also ap-
                                                                                                                                                                                                                                                              −0.44∗
                                                                                                                                                                                                                                                              −0.37∗

                                                                                                                                                                                                                                                                                                                                                                                                                                                                                                          parent in the 20–40 and 40–60 cm soil layers (Table 2). SOC
                                                                                                                                                                                                                                               −0.48
                                                                                                                                                                                                                                               −0.07
                                                                                                                                                                                                                                               −0.13

                                                                                                                                                                                                                                                                0.30

                                                                                                                                                                                                                                                                                 AP

                                                                                                                                                                                                                                                                                                                                                                                                                                                                                                          was depleted further during the vegetable farming, particu-
                                                                                                                                                                                                                                                                                                                                                                                                                                                                                                          larly in the first 10 years (Table 2), but the decrease observed
                                                                                                                                                                                                                                                              −0.63∗∗

                                                                                                                                                                                                                                                                                                                                                                                                                                                                                                          thereafter was generally small. The low input of organic C
                                                                                                                                                                                                                                                               −0.25

                                                                                                                                                                                                                                                               −0.32

                                                                                                                                                                                                                                                                                 Ws-K

                                                                                                                                                                                                                                                                                                                                                                                                                                                                                                          from organic fertilizers and crop residues (Fig. 2a) and high
                                                                                                                                                                                                                                               0.17
                                                                                                                                                                                                                                               0.32
                                                                                                                                                                                                                                               0.47

                                                                                                                                                                                                                                                                                                                                                                                                                                                                                                          tillage frequency (Fig. 2b) were two factors responsible for
                                                                                                                                                                                                                                                                                                                                                                                                                                                                                                          causing this change. Our results agreed with the findings of
                                                                                                                                                                                                                                                              −0.39∗

                                                                                                                                                                                                                                                                                 Ws-Ca
                                                                                                                                                                                                                                               0.81∗∗

                                                                                                                                                                                                                                                               −0.13
                                                                                                                                                                                                                                                0.65∗

                                                                                                                                                                                                                                                                                                                                                                                                                                                                                                          Wang et al. (2014), who reported that SOC content decreased
                                                                                                                                                                                                                                                 0.57

                                                                                                                                                                                                                                                                0.22

                                                                                                                                                                                                                                                                                                                                                                                                                                                                                                          by 25 % following the conversion from paddy soil to a veg-
                                                                                                                                                                                                                                                                                                                                                                                                                                                                                                          etable field in southern China. We estimated that the aver-
                                                                                                                                                                                                                                                                                 Ws-Mg
                                                                                                                                                                                                                                                              −0.39∗
                                                                                                                                                                                                                                                               −0.04

                                                                                                                                                                                                                                                                                                                                                                                                                                                                                                          age annual C input in the vegetable cropping was 25 % less
                                                                                                                                                                                                                                               0.06
                                                                                                                                                                                                                                               0.15
                                                                                                                                                                                                                                               0.08

                                                                                                                                                                                                                                                                0.27

                                                                                                                                                                                                                                                                                                                                                                                                                                                                                                          than that of the paddy–rape rotation (Fig. 2a). A higher fre-
                                                                                                                                                                                                                                                                                                                                                                                                                                                                                                          quency of tillage operation generally results in the breakup
                                                                                                                                                                                                                                                              −0.38∗
                                                                                                                                                                                                                                                              −0.37∗

                                                                                                                                                                                                                                                                                                                                                                                                                                                                                                          of soil macro-aggregates, soil structure damage (Chivenge et
                                                                                                                                                                                                                                               −0.05

                                                                                                                                                                                                                                                               −0.01

                                                                                                                                                                                                                                                                                 Ex-K
                                                                                                                                                                                                                                                0.19
                                                                                                                                                                                                                                                0.35

                                                                                                                                                                                                                                                                                                                                                                                                                                                                                                          al., 2007; Pires et al., 2017; Six et al., 2000; Gómez et al.,
                                                                                                                                                                                                                                                                                                                                                                                                                                                                                                          2020), and an increase in soil aeration, which promotes the
                                                                                                                                                                                                                                                              0.480∗∗

                                                                                                                                                                                                                                                                                                                                                                                                                                                                                                          microbial decomposition of SOC (Sarker et al., 2018). Ac-
                                                                                                                                                                                                                                               0.72∗∗

                                                                                                                                                                                                                                                               0.58∗∗
                                                                                                                                                                                                                                                               0.89∗∗

                                                                                                                                                                                                                                                                                 Ex-Ca
                                                                                                                                                                                                                                                0.66∗
                                                                                                                                                                                                                                                0.59∗

                                                                                                                                                                                                                                                                                                                                                                                                                                                                                                          celerated SOC decomposition by high air temperatures and
                                                                                                                                                                                                                                                                                                                                                                                                                                                                                                          soil moisture levels in subtropical regions has been reported
                                                                                                                                                                                                                                                                                                                                                                                                                                                                                                          (Zhang et al., 2013).
                                                                                                                                                                                                                                                                                 Ex-Mg
                                                                                                                                                                                                                                                              0.58∗∗
                                                                                                                                                                                                                                                              0.81∗∗
                                                                                                                                                                                                                                               −0.43
                                                                                                                                                                                                                                               −0.10

                                                                                                                                                                                                                                                               0.40∗

                                                                                                                                                                                                                                                                                                                                                                                                                                                                                                              The present study also indicated that soil TN content de-
                                                                                                                                                                                                                                                0.29

                                                                                                                                                                                                                                                                                                                                                                                                                                                                                                          clined proportionally less than the SOC content after conver-
                                                                                                                                                                                                                                                                                                                                                                                                                                                                                                          sion to vegetable cropping. This was accompanied by marked
                                                                                                                                                                                                                                                              −0.48∗∗

                                                                                                                                                                                                                                                                            surplus

                                                                                                                                                                                                                                                                                                                                                                                                                                                                                                          changes in the soil C/N ratio (Table 2). For instance, com-
                                                                                                                                                                                                                                                                0.39∗
                                                                                                                                                                                                                                                                 0.10

                                                                                                                                                                                                                                                                                                                                                                                                                                                                                                          pared to the paddy–rape rotation, the soil C/N ratio in the
                                                                                                                                                                                                                                                                                 N
                                                                                                                                                                                                                                               –
                                                                                                                                                                                                                                               –
                                                                                                                                                                                                                                               –

                                                                                                                                                                                                                                                                                                                                                                                                                                                                                                          20–40 cm layer depth decreased from 10.5 to 9.01 in the veg-
                                                                                                                                                                                                                                                                            surplus

                                                                                                                                                                                                                                                                                                                                                                                                                                                                                                          etable field, which had continuous farming over 15 years,
                                                                                                                                                                                                                                                              −0.09
                                                                                                                                                                                                                                                               0.23
                                                                                                                                                                                                                                                               0.14

                                                                                                                                                                                                                                                                                                                                                                                                                                                                                                          and a larger change was observed in the 40–60 cm depth
                                                                                                                                                                                                                                                                                  P
                                                                                                                                                                                                                                               –
                                                                                                                                                                                                                                               –
                                                                                                                                                                                                                                               –

                                                                                                                                                                                                                                                                                                                                                                                                                                                                                                          soil layer. Though the changes were significant, the absolute
                                                                                                                                                                                                                                                              −0.45∗∗

                                                                                                                                                                                                                                                                                                                                                                                                                                                                                                          quantities of C and N in the deeper soil layers were small (Ta-
                                                                                                                                                                                                                                                                            surplus

                                                                                                                                                                                                                                                                                                                                                                                                                                                                                                          ble 2); thus, experimental errors from sampling and analysis
                                                                                                                                                                                                                                                                 0.27
                                                                                                                                                                                                                                                                 0.03

                                                                                                                                                                                                                                                                                 K

                                                                                                                                                                                                                                                                                                                                                                                                                                                                                                          could easily be magnified when calculating ratios. However,
                                                                                                                                                                                                                                               –
                                                                                                                                                                                                                                               –
                                                                                                                                                                                                                                               –

                                                                                                                                                                                                                                                                                                                                                                                                                                                                                                          the C/N ratio did seem to exhibit a decreasing trend, which
                                                                                                                                                                                                                                                                            surplus
                                                                                                                                                                                                                                                              −0.11

                                                                                                                                                                                                                                                                                                                                                                                                                                                                                                          has been noted in other studies of land use conversion from
                                                                                                                                                                                                                                                               0.05
                                                                                                                                                                                                                                                               0.32

                                                                                                                                                                                                                                                                                Ca

                                                                                                                                                                                                                                                                                                                                                                                                                                                                                                          cereal to vegetable cropping (Ju et al., 2007; Yan et al., 2012).
                                                                                                                                                                                                                                               –
                                                                                                                                                                                                                                               –
                                                                                                                                                                                                                                               –

                                                                                                                                                                                                                                                                                                                                                                                                                                                                                                          As this is effected by a large N surplus (Table 1), it is perhaps
                                                                                                                                                                                                                                                                            surplus
                                                                                                                                                                                                                                                              −0.08

                                                                                                                                                                                                                                                                                                                                                                                                                                                                                                          conceivable that a fraction of the inorganic N in the soil pro-
                                                                                                                                                                                                                                                               0.06
                                                                                                                                                                                                                                                               0.28

                                                                                                                                                                                                                                                                                Mg

                                                                                                                                                                                                                                                                                                                                                                                                                                                                                                          file was immobilized into soil organic matter under the con-
                                                                                                                                                                                                                                               –
                                                                                                                                                                                                                                               –
                                                                                                                                                                                                                                               –

                                                                                                                                                                                                                                                                                                                                                                                                                                                                                                          ditions prevailing in the vegetable production, thus counter-

SOIL, 7, 333–346, 2021                                                                                                                                                                                                                                                                                                                                                                                                                                                                                                         https://doi.org/10.5194/soil-7-333-2021
M. Lu et al.: Significant soil degradation is associated with intensive vegetable cropping                                   343

acting the loss of N that accompanied the observed SOC loss.      and Graham, 2002; Zhang et al., 2019). Besides, exudates in
The slightly lower pH in subsoil in the vegetable field com-      combination with organic residues better protect soils against
pared to that in the paddy–rape rotation might have slowed        structural destabilization by increasing particle cementation
nitrification such that part of the inorganic N remained in the   and decreasing rapid soil wetting and porosity (Oleghe et al.,
ammonium form sufficiently long enough for some immobi-           2019).
lization to occur (Fig. 6; Marschner, 2012). However, Nieder         CaCl2 -P serves as an indicator of the risk of P loss from
et al. (2011) indicated that the ammonium fixing capacity of      leaching (Hesketh and Brookes, 2000). Previous studies have
the Ultisol, the type of soil used in this study, is extremely    reported a change point in the graph of soil-available P
low. This may increase the risk of ammonium losses in this        against CaCl2 -P, above which the risk of P leaching increases
region, which is a potential environmental issue that warrants    greatly (Bai et al., 2013; Shen et al., 2018; Yan et al., 2013).
more attention in the future.                                     Here, in terms of the 0–20 cm soil layer for a vegetable field,
   We did not directly measure N losses at the study sites,       though the critical value of soil AP exceeds the observation
but the large N surplus strongly implies that the losses          value, in a few other vegetable experimental reports, due to
would have been substantial. Zhang et al. (2017) found that       the difference in soil type, excessive P fertilizer application
36 % of the N applied (at a rate of 139 kg N ha−1 ) dur-          should be reduced and the P surplus should be zero to avoid
ing the growing season of bitter gourd was lost by leach-         P movement to waterbodies.
ing in the same subtropical region. In other intensive veg-
etable cropping systems, Wang et al. (2018a, 2019) mea-           4.4   Soil pH responded to land use change
sured a loss of 3.91 kg N2 O-N ha−1 per season and a runoff
of 16.5 kg N ha−1 per year. Therefore, losses of this order are   At the national scale, long-term intensive farming has been
to be expected in our study region. Hence, to minimize N          shown to cause soil acidification, with an average decline of
loss, which leads to undesirable environmental impacts, such      0.50 units in pH value in the topsoil of major Chinese crop-
as water pollution, eutrophication, and greenhouse gas emis-      lands from 1980 to 2000 (Guo et al., 2010). Soil acidifica-
sions, rational N fertilizer management for intensive veg-        tion is caused by the excessive application of N fertilizers
etable production in high-rainfall, subtropical environments      and the loss of base cations via leaching (Guo et al., 2010;
is urgently needed.                                               Zhang et al., 2016), which leads to decreased crop produc-
                                                                  tion and quality (Cakmak and Yazici, 2010). After the con-
4.3   P enrichment
                                                                  version from paddy–rape rotation to vegetable cropping, soil
                                                                  pH at all depths decreased, especially 1–3 years after land
P enrichment in farmland soils in China has been a serious        conversion, by 0.64, 0.68, and 0.40 pH units in 0–20, 20–40,
problem for many years, as the movement of phosphate to           40–60 cm, respectively (Fig. 6). With increasing farming du-
surface waters causes environmental pollution (Bai et al.,        ration, the pH in the 0–20 cm soil layer increased slightly and
2013; Cao et al., 2012; Li et al., 2011; Yan et al., 2013).       either stayed as it is or decreased very slightly in the deeper
On average, the annual P input (373 kg P ha−1 ; Table 1) in       soil layers. Meanwhile, exchangeable Mg and, to a lesser ex-
the present study was 2.6–4.7 times higher than those rec-        tent, Ca, accumulated due to the types of fertilizers used in
ommended for vegetable production agriculture (Zhang et           the vegetable production. This apparently sets the trend to-
al., 2009). Soil AP varied widely and ranged from 14.9 to         wards acidification, as shown by the correlation between Mg
229 mg P kg−1 (mean, 120 mg P kg−1 ) in the 0–20 cm soil          and Ca accumulation and soil pH (Table 3). In this sense,
layer, with a large variation which is several times higher       the current fertilization practice does confer benefits in terms
than the critical AP based on yield for fruit vegetables          of improving soil quality. However, the greater accumulation
(58 mg P kg−1 ) and leafy vegetables (46 mg P kg−1 ; Yan et       rate of Mg compared to Ca is likely to cause physiological
al., 2013). It has been noted that when the soil pH reaches       damage to crops due to the antagonism between the two el-
values less than 5.3, as occurred with the conversion to veg-     ements. An imbalance of soil mineral nutrients in vegetable
etable production, the presence of aluminum and iron in           field has been observed in other fields in southwestern China.
clay minerals of Ultisols can precipitate P fixation. There-         In this study, mean content of soil-exchangeable Mg in
fore, available P content in the 0–20 cm soil has increased       the new vegetable field which was farmed for 1–3 years
by 1.92 mg kg−1 for every 100 kg ha−1 of P surplus in the         is considered deficient (73.2 mg kg−1 ), as it is much lower
vegetable field. Compared to other cropping systems in dif-       than the critical threshold (Bai et al., 2004). Cationic antago-
ferent type of soils, this increasing coefficient ranged from     nism is also an important influencing factor of mineral nutri-
1.44 to 5.74 mg kg−1 (Cao et al., 2012). A high level of P en-    ent bioavailability (Tisdale et al., 1993; Marschner, 2012).
richment in the soil is detrimental to plant growth because it    With increasing farming duration (1–10 years), the soil-
inhibits the rhizosphere manipulation processes employed by       exchangeable K, Ca, and Mg content gradually increased
plants to efficiently acquire P, including the colonization of    (Fig. 5). The ratio of ex-K / ex-Mg decreased from 1.92 to
roots by arbuscular mycorrhiza fungi and the exudation of or-     1.37 and can be observed as the accumulation ratio of each
ganic acids or phosphatase enzymes (Dong et al., 2004; Ryan       nutrient was not consistent (K > Mg > Ca), while the ratio

https://doi.org/10.5194/soil-7-333-2021                                                                SOIL, 7, 333–346, 2021
344                                   M. Lu et al.: Significant soil degradation is associated with intensive vegetable cropping

of ex-Ca / ex-Mg remained at 6.14–6.29 with little change.            cedure and the farmer survey, with the input of SL. ML, DSP, and
However, it has been reported that plant Mg absorption                DL also did the statistics, prepared the paper, with valuable con-
would be inhibited by soil K and Ca when the value of soil            tributions of DRC and XC, and undertook the revisions during the
ex-K / ex-Mg and ex-Ca / ex-Mg greater than 0.6 and 7.0,              reviewing process.
respectively (Tisdale et al., 1993; Morton et al., 2008). Thus,
the current vegetable cropping practices can easily result in
Mg deficiency (Yan et al., 2016). Nowadays, more attention            Competing interests. The authors declare that they have no con-
                                                                      flict of interest.
has been paid to Mg in the soil–plant–human continuum and,
with intensive vegetable rotation in southwestern China, an
optimal Mg fertilization strategy is urgently needed.
                                                                      Disclaimer. Publisher’s note: Copernicus Publications remains
                                                                      neutral with regard to jurisdictional claims in published maps and
5   Conclusions                                                       institutional affiliations.

Under conventional agricultural practices, intensive open-
field vegetable production in southwestern China can result           Financial support. This research has been supported by funding
in significant soil degradation and potential environmental           from the National Natural Science Foundation of China (grant no.
pollution after conversion from paddy rice to an oilseed rape         31902117), the National Key Research and Development Program
rotation. Application of fertilizers in the current vegetable         of China (grant no. 2018YFD0800600), the China Postdoctoral Sci-
                                                                      ence Foundation (grant no. 2018M643393), the State Cultivation
production is often far higher than the crop requirement or
                                                                      Base of Eco-Agriculture for Southwest Mountainous Land (South-
even the recommendation by the local extension service. Ex-
                                                                      west University), and UK Research and Innovation (UKRI) through
cessive fertilization has led to substantial soil enrichment of       the UK Biotechnology and Biological Sciences Research Council
P, K, Ca, and Mg. In this study, a trend of soil acidification        (BBSRC).
at 0–60 cm soil layer depths was observed, although it was
partially alleviated by the accumulation of Mg and Ca. Addi-
tionally, SOC decreased rapidly after conversion to vegetable         Review statement. This paper was edited by Fuensanta García-
cropping, and its levels continued to decrease over time. This        Orenes and reviewed by Lukas Kohl, Paul Hallett, and one anony-
was attributed to decreased C inputs from organic fertilizer          mous referee.
and crop residues and increased operation frequency of deep
tillage compared to the paddy–rape rotation, as well as the
high temperatures and moisture levels prevalent under sub-            References
tropical climatic conditions. The reduction in SOC inevitably
causes a decline in soil physical and biological properties,          Bai, Y., Jin, J., and Yang, L.F: Study on the content and distribution
with potential long-term impacts on the sustainability of the           of soil available magnesium and foreground of magnesium fer-
                                                                        tilizer in China, Soil Fert. Sci. China, 2, 3–5, 2004 (in Chinese).
vegetable production agriculture. The C/N ratio was found
                                                                      Bai, Z., Li, H., Yang, X., Zhou, B., Shi, X., Wang, B., Li, D.,
to decrease in deeper soil layers in the vegetable field. Man-          Shen, J., Chen, Q., Qin, W., Oenema, O., and Zhang, F.: The
agement practices likely to slow or reverse soil degradation            critical soil P levels for crop yield, soil fertility and environ-
and prevent environmental pollution in the vegetable system             mental safety in different soil types, Plant Soil, 372, 27–37,
include increasing organic inputs (as either manure, organic            https://doi.org/10.1007/s11104-013-1696-y, 2013.
fertilizers, or crop residues, possibly through a change in the       Bünemann, E. K., Bongiorno, G., Bai, Z., Creamer, R. E., Deyn, G.
crop rotation to include some cereals with the possibility of           D., Goede, R., Fleskens, L., Geissen V., Kuyper, T. W., Mäder,
incorporating straw), optimizing fertilizer application to bet-         P., Pulleman, M., Sukkel, W., Groenigen J. W., and Brussaard,
ter match crop requirements, decreasing tillage frequency,              L.: Soil quality – A critical review, Soil Biol. Biochem., 120,
and changing the types of chemical fertilizers used to avoid            105–125, https://doi.org/10.1016/j.soilbio.2018.01.030, 2018.
an imbalance between Mg and Ca. These may be achieved                 Cakmak, I. and Yazici, A. M.: Magnesium: a forgotten element in
                                                                        crop production, Better Crops Plant Food, 94, 23–25, 2010.
by applying ISSM concepts through the development of ef-
                                                                      Cao, N., Chen, X., Cui, Z., and Zhang, F.: Change in
fective agriculture extension strategies to deliver information         soil available phosphorus in relation to the phosphorus
to farmers.                                                             budget in China, Nutr. Cycl. Agroecosys., 94, 161–170,
                                                                        https://doi.org/10.1007/s10705-012-9530-0, 2012.
                                                                      Chen, X., Cui, Z., Fan, M., Vitousek, P., Zhao, M., Ma, W., Wang,
Data availability. The data that support the findings of this study     Z., Zhang, W., Yan, X., Yang, J., Deng, X., Gao, Q., Zhang, Q.,
are available on request from the corresponding author (Dunyi Liu).     Guo, S., Ren, J., Li, S., Ye, Y., Wang, Z., Huang, J., Tang, Q.,
                                                                        Sun, Y., Peng, X., Zhang, J., He, M., Zhu, Y., Xue, J., Wang,
                                                                        G., Wu, L., An, N., Wu, L., Ma, L., Zhang, W., and Zhang, F.:
Author contributions. DL and XC designed the experimental               Producing more grain with lower environmental costs, Nature,
setup. ML and YL did soil sampling and led the lab analysis pro-        514, 486–492, https://doi.org/10.1038/nature13609, 2014.

SOIL, 7, 333–346, 2021                                                                      https://doi.org/10.5194/soil-7-333-2021
You can also read