Simultaneous in vivo imaging with PET and SPECT tracers using a Compton PET hybrid camera
←
→
Page content transcription
If your browser does not render page correctly, please read the page content below
www.nature.com/scientificreports
OPEN Simultaneous in vivo imaging
with PET and SPECT tracers using
a Compton‑PET hybrid camera
Mizuki Uenomachi1,10, Miwako Takahashi2,10, Kenji Shimazoe3,4,10*, Hiroyuki Takahashi5,
Kei Kamada6, Tadashi Orita7, Kenichiro Ogane8,9 & Atsushi B. Tsuji2
Positron-emission tomography (PET) and single-photon-emission computed tomography (SPECT) are
well-established nuclear-medicine imaging methods used in modern medical diagnoses. Combining
PET with 18F-fluorodeoxyglucose (FDG) and SPECT with an 111In-labelled ligand provides clinicians with
information about the aggressiveness and specific types of tumors. However, it is difficult to integrate
a SPECT system with a PET system because SPECT requires a collimator. Herein, we describe a novel
method that provides simultaneous imaging with PET and SPECT nuclides by combining PET imaging
and Compton imaging. The latter is an imaging method that utilizes Compton scattering to visualize
gamma rays over a wide range of energies without requiring a collimator. Using Compton imaging
with SPECT nuclides, instead of the conventional SPECT imaging method, enables PET imaging
and Compton imaging to be performed with one system. In this research, we have demonstrated
simultaneous in vivo imaging of a tumor-bearing mouse injected with 18F-FDG and an 111In-antibody
by using a prototype Compton-PET hybrid camera. We have succeeded in visualizing accumulations
of 18F-FDG and 111In-antibody by performing PET imaging and Compton imaging simultaneously. As
simultaneous imaging utilizes the same coordinate axes, it is expected to improve the accuracy of
diagnoses.
Since the beginning of research on nuclear-medicine imaging technology in the 1950s, single-photon-emission
computed tomography (SPECT)1 and positron-emission tomography (PET)2,3 have become important imaging
methods in both medical research and diagnosis. SPECT uses a collimator to define the direction of incom-
ing gamma rays. Therefore, low-energy gamma rays (50–400 keV) are used for SPECT. Conversely, PET uses
positron-emitting nuclides and detects the coincidence between two 511 keV gamma rays emitted in oppo-
site directions when a positron annihilates with an electron. Therefore, PET imaging can visualize only a PET
tracer. However, since PET does not require a collimator, its sensitivity is higher than that of SPECT. PET with
18
F-fluorodeoxyglucose (FDG) is most widely used to detect malignant tumors via imaging glucose metabo-
lism, which is accelerated with more aggressive tumors4,5. However, glucose metabolic imaging is less specific
to individual types of tumors. Tumor-specific imaging is now available using SPECT with 111In-labeled ligands,
such as the anti-CD20 antibody that targets CD20 positive lymphoma, or pentetreotide that targets somatostatin
receptors6,7. The combination of PET with 18F-FDG and SPECT with an 111In-labelled ligand is helpful both in
guiding the method of treatment as well as in diagnosis. However, since the PET and SPECT modalities require
separate devices and the resolutions are considerably different, the matching of lesion positions is based on
experience. As simultaneous imaging with PET and SPECT nuclides yields images on the same coordinate axes,
the accuracy of the diagnosis can be significantly improved by combining these techniques.
1
Department of Nuclear Engineering and Management, School of Engineering, The University of Tokyo, 7‑3‑1,
Hongo, Bunkyo‑ku, Tokyo, Japan. 2National Institute of Radiological Sciences, National Institutes for Quantum and
Radiological Science and Technology, 4‑9‑1, Inage, Chiba, Chiba, Japan. 3Department of Bioengineering, School of
Engineering, The University of Tokyo, 7‑3‑1, Hongo, Bunkyo‑ku, Tokyo, Japan. 4JST, PRESTO, Saitama 332‑0012,
Japan. 5Institute of Engineering Innovation, School of Engineering, The University of Tokyo, 2‑11‑16, Yayoi,
Bunkyo‑ku, Tokyo, Japan. 6Tohoku University, 2‑1‑1, Katahira, Sendai, Miyagi, Japan. 7Kavli Institute for the Physics
and Mathematics of the Universe (WPI), The University of Tokyo, Kashiwa, Chiba, Japan. 8Department of Surgery,
Graduate School of Medicine, The University of Tokyo, 7‑3‑1, Hongo, Bunkyo‑ku, Tokyo, Japan. 9Department
of Nuclear Medicine, International University of Health and Welfare, 1‑4‑3, Minato‑ku, Tokyo, Japan. 10These
authors contributed equally: Mizuki Uenomachi, Miwako Takahashi and Kenji Shimazoe *email: shimazoe@
bioeng.t.u-tokyo.ac.jp
Scientific Reports | (2021) 11:17933 | https://doi.org/10.1038/s41598-021-97302-7 1
Vol.:(0123456789)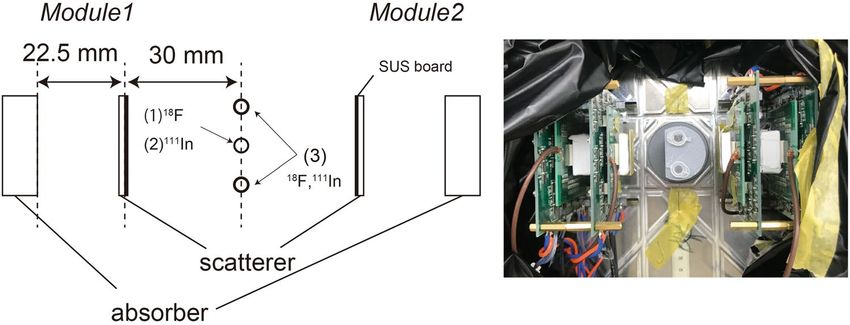
www.nature.com/scientificreports/
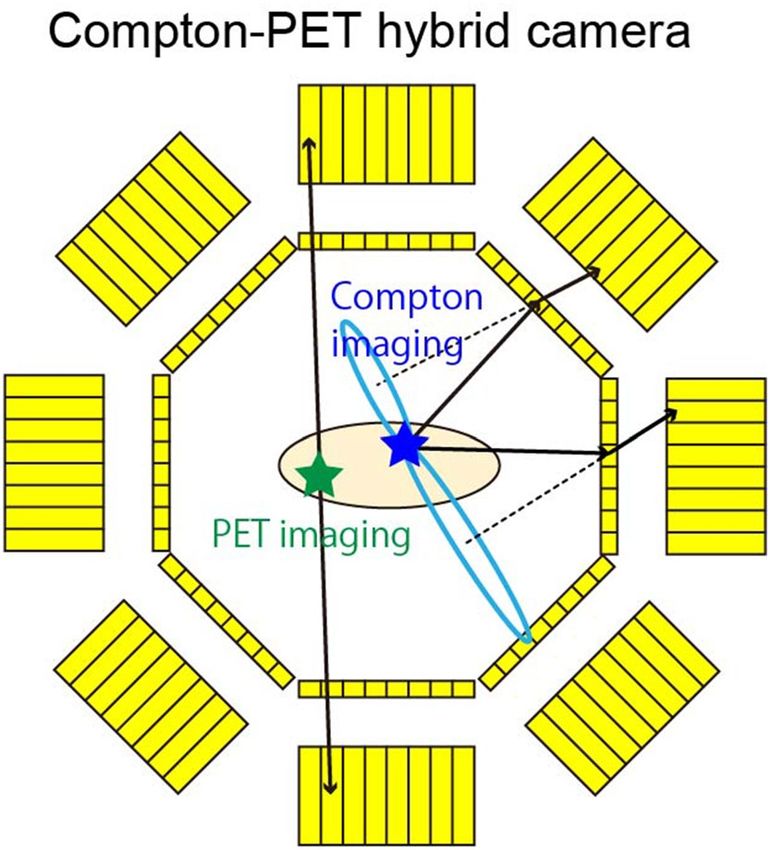
Figure 1. Concept of the Compton-PET hybrid camera. The PET tracers are visualized using coincidence
detection of annihilation gamma rays through opposing absorbers. The SPECT tracers are visualized using
coincidence detection of a Compton-scattered gamma ray (in a scatterer) and a fully absorbed gamma ray
(in an absorber). Green and blue stars represent PET and SPECT tracers, respectively. The solid black lines
represent two gamma rays, here scattered by separate scatterers (thin yellow boxes) before being absorbed in
separate absorbers (thick yellow boxes). The dashed lines represent the axes of the two Compton cones, and the
blue ovals represent their bases. The figure was created using the software (Adobe Illustrator, Illustrator CC 24,
https://www.adobe.com/products/illustrator.html).
Although the technology to enable simultaneous imaging with PET and SPECT nuclides is required in nuclear
medicine, it is difficult to integrate a SPECT system with a PET system because SPECT requires a collimator.
Studies of multi-tracer imaging have been conducted by using the conventional SPECT imaging method8–11.
Typically, multi-tracer SPECT imaging is performed for nuclides that emit low-energy gamma r ays8–10. A SPECT
system that can visualize both PET tracers and SPECT tracers has also been developed11. However, since this
system uses collimators in detecting the 511 keV gamma-rays originating from a PET tracer as single photons,
the sensitivity of the PET tracer is reduced compared with that obtained by PET imaging11. Recently, Compton
imaging12 based on Compton scattering has been studied for applications in the fields of s pace13,14, nuclear15–17,
and medical r esearch18–21. Compton imaging has the capability for multi-nuclide imaging without requiring a
collimator. Some groups have reported in vivo multi-tracer imaging by using Compton imaging18–21. In par-
ticular, references 10 and 11 reported simultaneous in vivo Compton imaging with a PET tracer and a SPECT
tracer using a Si/CdTe Compton camera. However, simultaneous in vivo multi-tracer imaging that employs
the principles of both PET imaging and Compton imaging has not yet been reported, although PET imaging
can visualize a PET tracer with higher sensitivity and spatial resolution than those of Compton imaging. We
have recently proposed a new simultaneous multi-nuclide imaging technology that combines PET imaging
and Compton imaging22. Figure 1 shows the concept of the Compton-PET hybrid camera. It uses conventional
PET imaging with coincidence detection of annihilation gamma rays to visualize the PET nuclides. The SPECT
nuclides are visualized using Compton imaging. By detecting the coincidence between a Compton-scattered
gamma ray of energy Es and a fully absorbed gamma ray of energy Ea , the angle of incidence θ of the gamma
rays can be obtained via the following equation:
1 1
cos θ = 1 + m0 c 2 Es +Ea
− Ea , (1)
where m0 is the electron rest mass and c is the speed of light. Hence, the location of a source can be restricted to a
conical surface (the Compton cone) from information about the energies and positions of the Compton-scattered
gamma rays and the fully absorbed gamma rays. In this system, coincidence events between 511 keV gamma
rays from two scatterer–absorber modules are regarded as PET events, whereas coincidence events between a
scatterer and an absorber module are regarded as Compton events. The PET events are used for PET imaging
by overlaying lines of response (LORs) to visualize the PET tracers, and Compton events are used for Compton
imaging by overlaying Compton cones to visualize the SPECT tracers. In a previous report22, we demonstrated
simultaneous imaging with 18F (PET nuclide) and 111In (SPECT nuclide) for proof of principle with a prototype
of Compton-PET hybrid camera, which was optimized for low energy gamma-ray (150–400 keV) Compton
imaging and PET imaging. In this study, we show the feasibility of such a Compton-PET hybrid camera through
simultaneous in vivo imaging with PET and SPECT tracers of a tumor-bearing mouse injected with 18F-FDG
(PET tracer) and an 111In-labeled ligand (SPECT tracer).
Scientific Reports | (2021) 11:17933 | https://doi.org/10.1038/s41598-021-97302-7 2
Vol:.(1234567890)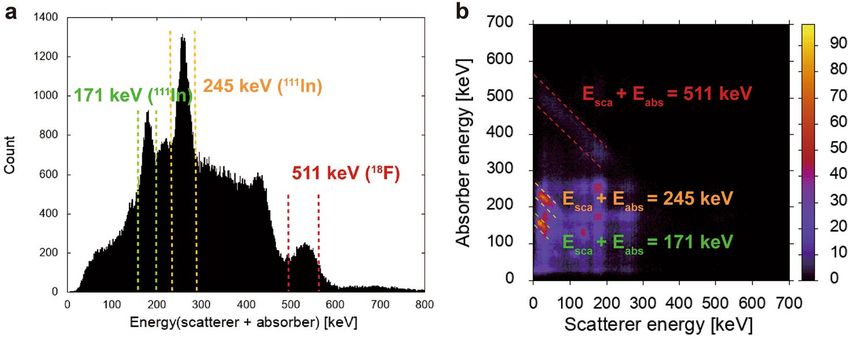
www.nature.com/scientificreports/
Figure 2. Imaging results for 22Na and 18F point sources. (a) PET image of a 22Na point source obtained using
the BP method. (b) Compton image of an 18F point sources obtained with the MLEM method at a distance of
30 mm.
Results
Basic performance. We evaluated the energy resolution, the angular resolution measure (ARM), the spa-
tial resolution, and the time resolution of the prototype system. The detector configuration to evaluate ARM
and spatial resolution is described in the Method section. The energy resolution of scatterers was approximately
18.2% (full width at half maximum: FWHM) at 59.54 keV. The energy resolution of gamma rays above 100 keV
was approximately 11–15% (FWHM) and was limited by the voltage range of the ADCs. The ARM is com-
monly used as a parameter to represent the angular resolution of Compton camera. We calculated it from the
difference between the angle calculated from deposited energies and the angle from interaction positions. The
ARM includes uncertainties caused by the position resolution, energy resolution and Doppler broadening effect.
The angular resolutions at 245 keV and 511 keV using point sources of 111In and 18F were 17.2° (FWHM) and
11.6° (FWHM), respectively. The calculated ARMs were considered in the Compton imaging reconstruction.
Figure 2a shows the reconstructed PET image of a 22Na point source at a distance of 30 mm by using the back-
projection (BP) method. We evaluated the spatial resolution by measuring the 22Na point source and evaluating
a point-spread-function of the reconstructed image. The spatial resolutions of PET imaging at 511 keV along
the horizontal and vertical axes were 3.3 mm (FWHM) and 3.3 mm (FWHM), respectively. Figure 2b shows the
reconstructed Compton image of an 18F point source at a distance of 30 mm by using the maximum-likelihood
expectation–maximization (MLEM) m ethod23 after 60 iterations. The spatial resolutions of Compton imaging
at 511 keV along the horizontal and vertical axes were 4.2 mm (FWHM) and 3.8 mm (FWHM), respectively.
The time resolution was 47.7 ns and was mostly restricted by the slew rate of the CMOS amplifiers on the signal-
processing boards.
Simultaneous imaging of PET and SPECT nuclides with micro tubes. We performed simultane-
ous 18F-FDG (PET nuclide) and 111In (SPECT nuclide) imaging with microtubes before conducting in vivo imag-
ing. The detail of imaging system and experimental setup are described in the Method section. The nuclide 18F
is a positron emitter, which yields a pair of annihilation gamma rays with an energy of 511 keV. The nuclide
111
In emits gamma rays with energies of 171 keV and 245 keV. As the gamma-ray energies from the SPECT
nuclides are lower than 511 keV—the gamma-ray energy of the PET nuclides—crosstalk is caused by the scat-
tered 511 keV gamma rays, and this affects Compton-image reconstruction using low-energy gamma r ays24.
We measured the count ratio of 18F-FDG to 111In using various combinations of each radioactivity. Figure 3a
shows the count ratio calculated by dividing 111In Compton events measured with 18F by that measured with no
18
F source and Fig. 3b shows the count ratio calculated by dividing 18F Compton events or PET events by those
of a 0.13 MBq 18F source. For all the measurements, the radioactivity of 111In was nearly constant (~ 1 MBq);
however, as the radioactivity of 18F increased, so did the Compton events involving 245 keV gamma rays from
111
In, which was used for image reconstruction. This indicates that the effect of crosstalk, which cannot be dis-
tinguished by the energy and time windows, increases with the 18F radioactivity. Conversely, we assume that
the 511 keV Compton events have few crosstalk elements, because the rate of increase in the 511 keV Compton
events is approximately the same as that of the PET events.
Scientific Reports | (2021) 11:17933 | https://doi.org/10.1038/s41598-021-97302-7 3
Vol.:(0123456789)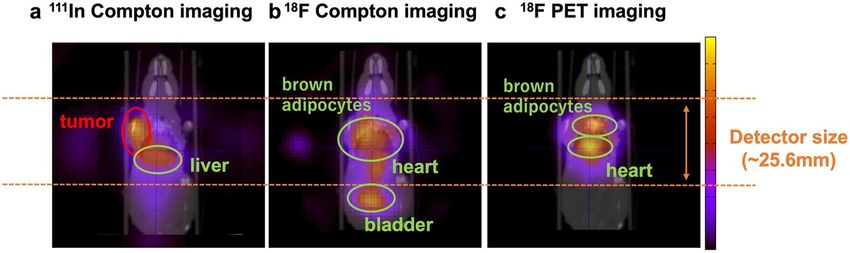
www.nature.com/scientificreports/

                                            Figure 3.  Relation between Compton events and 18F radioactivity. (a) Relation between the 245 keV Compton
                                            events used for Compton imaging and 18F radioactivity. The y-axis represents the ratio of 111In Compton events
                                            measured with 18F to Compton events measured with no 18F source. As the 18F radioactivity increases, Compton
                                            events due to 245 keV gamma rays also increase. (b) Relation between Compton events (PET events) at 511 keV
                                            used for Compton imaging (PET imaging) and 18F radioactivity. The y-axis is the ratio of Compton events (PET
                                            events) measured with various 18F sources to Compton events measured with a 0.13 MBq 18F source.

                                            Figure 4.  Results for Compton events. (a) The spectrum of energies deposited in the scatterer and absorber by
                                            Compton events. (b) A 2D map of the scattered energy and the absorbed energy of Compton events. The area
                                            between the red dotted lines corresponds to Compton events due to 511 keV gamma rays from 18F-FDG. The
                                            areas between the green and orange dotted lines correspond to Compton events produced by the 171 keV and
                                            245 keV gamma rays from 111In.

                                                Figures 4 and 5 show the results from a simultaneous 18F and 111In imaging experiment with radioactivities
                                            of 0.2 MBq and 1.0 MBq, respectively. Figure 4a shows the spectrum of energies deposited in the scatterer and
                                            absorber from Compton events. The peak in the area between the red dotted lines corresponds to Compton
                                            events due to the 511 keV gamma rays from 18F-FDG. The peaks in the areas between the green and orange dot-
                                            ted lines correspond to Compton events produced by the 171 keV and 245 keV gamma rays from 111In. The peak
                                            around 420 keV indicates the chance coincidence between 171 and 245 keV photoelectric absorption events. A
                                            2D map of the scattered energy and the absorbed energy owing to Compton events is shown in Fig. 4b. Owing
                                            to the setup geometry of the scatterer and absorber, the scattered energy detected was limited. In particular, the
                                            energies deposited in the scatterer by low-energy 171 keV and 245 keV gamma rays were only 50 keV or less.
                                            For 245 keV gamma-ray imaging, Compton events with scattered energies of 50 keV or less were used to reduce
                                            the background for reconstruction. Besides, there are three hot spots in Fig. 4b, which were mostly derived
                                            from chance coincidences of 111In: between 171 and 245 keV photoelectric absorption events, between 171 keV
                                            photoelectric absorption events, between 245 keV Compton edge events (~ 125 keV). Figure 5 shows the recon-
                                            struction results for 18F-FDG and 111In obtained from PET imaging and Compton imaging. The Compton images
                                            were reconstructed by using the maximum-likelihood expectation–maximization (MLEM) method. The PET
                                            image was reconstructed using the back-projection (BP) method. Figure 5a, b show Compton imaging results

          Scientific Reports |   (2021) 11:17933 |               https://doi.org/10.1038/s41598-021-97302-7                                                  4

Vol:.(1234567890)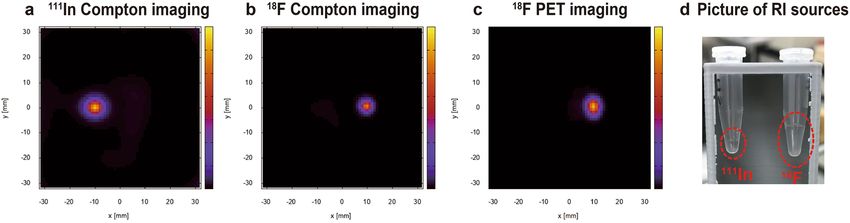
www.nature.com/scientificreports/
Figure 5. Simultaneous 111In and 18F imaging results. (a) A reconstructed image of an 111In radioisotope
obtained by Compton imaging, using 245 keV gamma rays for the reconstruction. (b) A reconstructed image
of an 18F radioisotope obtained by Compton imaging, using 511 keV gamma rays for the reconstruction. (c)
A reconstructed image of the 18F radioisotope obtained by PET imaging. (d) A picture of RI sources in micro
tubes.
Figure 6. Simultaneous 111In and 18F in vivo imaging results. (a) A reconstructed image of the 111In antibody
obtained by Compton imaging. The CT image and the reconstructed image are superimposed. The location of
the tumor and the liver are visualized. (b) A reconstructed image of 18F-FDG obtained by Compton imaging.
The location of the bladder is strongly visualized. (c) A reconstructed image of 18F-FDG obtained by PET
imaging. The accumulation in the field of view (FOV), which is determined by the detector size, is visualized.
obtained using the 245 keV gamma rays (from 111In) and 511 keV gamma rays (from 18F), and Fig. 5c shows the
PET imaging results. The location of each source appears clearly in these images. Although 18F can be visualized
with both Compton imaging and PET imaging, the shape of the 18F source was more clearly visualized in the
PET image than in the Compton image.
Simultaneous in vivo imaging with PET and SPECT tracers. Next, we demonstrated simultane-
ous in vivo imaging with a male nude mouse bearing an SY tumor, a small-cell lung-cancer cell line. As the
PET tracer and the SPECT tracer, we used 18F-FDG and an 111In-antibody (67A2; anti-c-kit mouse monoclonal
antibody25), respectively. The mouse was placed on the stage in an upright position during the measurement.
The imaging results are shown in Fig. 6. The Compton images and PET image were reconstructed by using the
MLEM method and the BP method, respectively. We also took a CT scan of the mouse in a horizontal position.
The tumor was on the left shoulder. The reconstructed images are superimposed on the CT image. Figure 6a
is the reconstructed 111In image obtained by Compton imaging with 245 keV gamma rays. The 111In-antibody
accumulated strongly in the tumor, and accumulation in the liver is also visualized. Figure 6b, c show the 18F-
FDG images. The tracer 18F-FDG is visualized in several organs—for example, in the bladder, heart, and brown
adipocytes. The reconstructed image obtained by Compton imaging with 511 keV gamma rays shows the 18F-
FDG accumulation in the whole body. In Fig. 6b, the accumulation in the heart, brown adipocytes, and bladder
is visualized. Conversely, PET imaging visualized the heart and brown adipocyte clearly; however, the bladder
was not visualized because the PET field of view (FOV) is limited by the detector size (Fig. 6c). The accumula-
tion of 18F-FDG in the tumor was not clearly visible in either of these images. A low uptake of 18F-FDG in an
SY tumor was also reported in r eferences26,27. After in vivo imaging, we also measured the radioactivity of some
organs in the same mouse for an experiment and those in another mouse injected with only an 111In-antibody by
using an auto-well gamma counter (Table 1). The amount of 111In anti-body injected into two mice was almost
same (detailed in Method section), and these measurements were conducted approximately 3 days after the
injection. For both mice the highest 111In radioactivity was located in the tumor, with a secondary accumulation
in the liver. This result corresponds to the 111In Compton-imaging result. However, the radioactivity of 18F in
Scientific Reports | (2021) 11:17933 | https://doi.org/10.1038/s41598-021-97302-7 5
Vol.:(0123456789)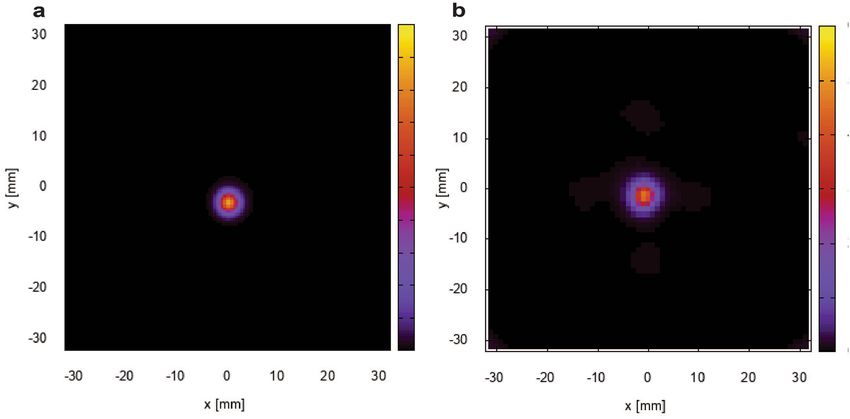
www.nature.com/scientificreports/
Mouse with 18F and 111In Mouse with only 111In
Organ 111
In (kBq/g) 111
In (kBq/g)
Blood 67.4 71.3
Heart 16.8 17.8
Lung 36.6 38.7
Liver 74.6 78.9
Spleen 34.8 36.7
Kidney 19.8 21.0
Bone 9.6 10.2
Colon 9.0 9.5
Bladder 15.6 16.5
Tumor 174.1 184.0
Table 1. The 111In radioactivity of some organs and the tumors measured by an auto-well gamma counter after
excision from tumor-bearing mice.
organs was not accurately measured by the gamma counter because of a pile-up caused by the 111In radiation
energies. This experiment was approved by the Committee of Care and Use of Laboratory Animals of National
Institute of Radiological Sciences and was performed in compliance with the institutional guidelines.
Discussion
Herein, we have demonstrated simultaneous in vivo imaging with PET and SPECT nuclides of a tumor-bearing
mouse using our Compton-PET hybrid camera. The PET nuclides can be visualized using both Compton imaging
and PET imaging; however, PET imaging can visualize the shape of 18F source more clearly than Compton imag-
ing. The spatial resolution of the PET imaging obtained with our Compton-PET hybrid camera is not as good as
that of commercial small-animal PET scanners28,29; however, this prototype Compton-PET hybrid camera is not
sufficiently optimized for PET imaging. Consequently, there is room to improve the spatial resolution in terms of
the detector pixel size—which mostly determines the spatial resolution—the time resolution, and the method of
reconstruction. With respect to the system design, a ring system—which is the general design of PET—is ideal
for quantitative imaging in the future. This also contributes to the improvement of Compton imaging as well
as PET imaging. In general measurement from one angle by using one Compton camera, the spatial resolution
in the direction vertical to the detector is inferior. Recently, its improvement by multi-angle measurement was
reported30, and Tashima et al.31 succeeded to perform high quality in vivo Compton imaging by using the ring
system. We are going to build a ring Compton-PET hybrid camera as the second prototype imaging system.
Moreover, PET imaging is a well-established method, and the spatial resolution has been improved by using
information about the depth of interaction (DOI)32–34 and the time-of-flight (TOF)35–37. These techniques also
can be applied to our Compton-PET hybrid camera to improve the spatial and the time resolution.
In this research, the radioactivities of 18F and 111In for in vivo imaging were determined to be less affected
by 511 keV scattered photons; however, this crosstalk was not corrected here. Although the Compton images of
111
In-antibody and 18F-FDG visualized their accumulation, some artifacts appeared. In principle, energy infor-
mation of Compton scattering gives us only the angle information of incoming gamma-ray unlike a PET event
that determines the direction. There, Compton imaging is performed by drawing Compton cones, of which a
part contributes to artifacts in the reconstructed image. Besides, crosstalk events caused by higher gamma-rays
also contributes to artifacts in multi-tracer imaging. In in vivo imaging of larger animals or humans, the photons
scattering within the body will contribute to additional crosstalk in the Compton events as well as backgrounds
in PET events, therefore, the scatter correction is required. The scatter correction method for Compton imag-
ing has not been studied so much yet, whereas that for PET imaging has been developed and widely used in
the field of PET imaging. Recently, we demonstrated the scatter correction method in the Compton imaging
system by setting arbitrary scattering points on the attenuating material38. As the method to reduce crosstalk
artifacts, Sakai et al.24 demonstrated a dual-energy-window scatter correction, which is used in SPECT imaging,
for multi-nuclide Compton imaging. Another candidate as crosstalk reduction method, especially for 111In, is
the double photon coincidence m ethod39–42. 111In emits successive gamma-rays of 171 keV and 245 keV via an
intermediate state, therefore, the coincidence detection of these gamma-rays could result in the drastic crosstalk
reduction. By using these techniques, the scattered photons and crosstalk events could be reduced, resulting in
the improvement of Compton images.
Not only SPECT nuclides but also therapeutic nuclides can be visualized simultaneously with PET nuclides.
For example, 131I—which mainly emits 364 keV gamma rays—is widely used for thyroid-cancer t herapy43, and
177
Lu—which mainly emits 113 keV and 208 keV gamma rays—is a promising therapeutic nuclide that is used
for neuroendocrine-tumor t herapy44. The energies of these gamma rays are suitable for low-energy gamma-ray
Compton imaging; therefore, our Compton-PET hybrid camera can afford simultaneous imaging of therapeutic
and diagnosis nuclides, thus eliminating the effects of organ movement. In addition to improving the accuracy
of diagnosis and reducing the patients’ burden caused by several exams, the Compton-PET hybrid camera may
become a useful modality for research into promising therapeutic nuclides.
Scientific Reports | (2021) 11:17933 | https://doi.org/10.1038/s41598-021-97302-7 6
Vol:.(1234567890)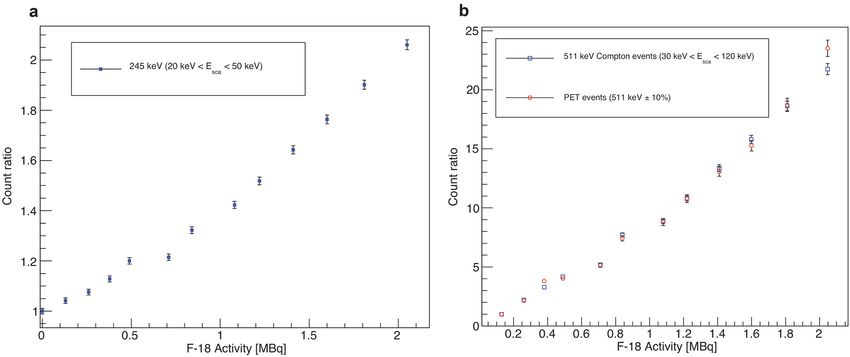
www.nature.com/scientificreports/
Methods
Detector. The detector configuration of the prototype Compton-PET hybrid camera comprises two modules
of scatterers and absorbers, each containing pixelated scintillator arrays and silicon photomultipliers (SiPMs).
To visualize a SPECT tracer using Compton imaging requires suitable energy resolution. Therefore, we chose
a high-resolution-type Ce:Gd3Al2Ga3O12 (HR-GAGG) s cintillator45 for this study. A GAGG scintillator has the
characteristics of desirable energy resolution (4% with an avalanche photodiode [APD]), high light yield (56,000
photons/MeV), high density (6.63 g/cm3), moderate decay time (150 ns), non-deliquescence, and non-self-
irradiation. The scattering layer was an 8 × 8 HR-GAGG array of 2.5 mm × 2.5 mm × 1.5 mm scintillators that was
used to detect Compton scattering of low-energy gamma rays from SPECT nuclides, and the absorbing layer was
an 8 × 8 HR-GAGG array of 2.5 mm × 2.5 mm × 9 mm scintillators that was used to detect photon absorption of
the 511 keV gamma rays from the PET nuclides. The scatterer thickness was decided so that a Compton scatter-
ing possibility would be more than 15% for an energy of 150 keV and less than 10% for an energy of 511 keV22.
The pitch size was 3.2 mm, and each crystal was separated by BaSO4 reflectors. Each GAGG array was coupled to
an 8 × 8 array of SiPMs (Hamamatsu MPPC S13361-3050) and was then wrapped with Teflon tape.
Signal processing. The 64 channels of charge signals from the SiPMs were processed in parallel by using
dynamic time-over-threshold (dToT) method46,47-based circuits. The ToT method48–50 offers several advan-
tages—such as low power consumption and multi-channel parallel signal processing—over conventional pulse-
height measurements with analog-to-digital converters (ADCs). Moreover, by using a dynamic threshold, the
dToT method improves the non-linearity between the time width and the radiation energy, which is a disad-
vantage of the conventional ToT method. The dynamic threshold is determined by the rise and delay times.
Each dToT-based circuit is comprised of an amplifier, a dynamic-threshold generator, and a comparator. The
dynamic-threshold generator consists of two monostable multivibrators containing resistors and capacitors,
which determine the rise and delay times. These parameters were optimized at 660 ns and 136 ns, respectively,
by measuring the shapes of outputs from an amplifier for gamma rays with energies of 31 keV, 81 keV, 356 keV,
384 keV (from 133Ba), 59.54 keV (from 241Am), and 122 keV (from 57Co). The 64-channel dToT circuits are
implemented on a board that enables parallel signal processing. The operating voltage is 3.3 V.
Data‑acquisition system. The 128-channel ToT outputs from a scatterer and an absorber are transferred
to a 144-channel field-programmable gate array (FPGA, Xilinx Kinetex7 XC7k70T) data-acquisition (DAQ)
system through KEL coaxial cables. The time stamp, channel number, and ToT pulse width are recorded in list
mode in a solid-state drive (SSD) with 2.5 ns accuracy. As the prototype Compton-PET camera requires two
DAQs, external clocks with a frequency of 1 kHz generated by a function generator are also transferred to the
DAQs, utilizing an unused channel to synchronize the two DAQs. Time stamps are corrected using external
clocks during offline analysis for extracting PET events.
Analysis. As the nonlinearity between ToT width and energy is caused by the scintillators and SiPMs and
dToT circuits, we measured the spectrum of several sources for calibration. The energy from the ToT response
was calibrated by using the peak-position energies of several gamma rays: 31 keV, 81 keV, 356 keV, 384 keV
(from 133Ba), 59.54 keV (from 241Am), 122 keV (from 57Co), 171 keV, 245 keV (from 111In), 511 keV (from 22Na),
and 662 keV (from 137Cs).
The data-analysis flow is shown in Fig. 7. Scatterer–absorber coincidence events within a time difference of
250 ns were selected from the list-mode data as Compton events after sorting by the time stamps. In addition,
fully absorbed gamma-ray events within the energy range 511 keV ±10% full width at half maximum (FWHM)
and 1 kHz sync-signal events were extracted from the list-mode data. The time stamps of the 511 keV gamma-
ray events were corrected by using the time stamps of the 1 kHz sync signal to adjust the time stamps of the data
between the two cameras. The 511 keV gamma-ray events from the two cameras were integrated and sorted
using the corrected time stamps. Then, coincidence events of the 511 keV annihilation gamma rays—within
a time difference of 80 ns—were selected as PET events. The Compton events and PET events were used for
Compton imaging and PET imaging to visualize the SPECT tracers and the PET tracers, respectively. The x, y,
z coordinates of the positions of energy deposition were determined from the configuration of the detectors. In
this paper, Compton images were reconstructed by using the MLEM method, and the PET images were recon-
structed with the BP method.
Experimental setup. We evaluated the basic performance of (1) PET-nuclide imaging and (2) SPECT-
nuclide imaging, and (3) we demonstrated simultaneous 18F-FDG (PET nuclide) and 111In (SPECT nuclide)
imaging using micro tubes. For the simultaneous-imaging experiment, 18F-FDG was used as the PET nuclide,
and 111In was used as the SPECT nuclide. Figure 8 shows the experimental setup with the prototype Compton-
PET hybrid camera. Two scatterer–absorber modules were placed in opposing positions. The distance between
the center and the scatterer surface was 30 mm, and the distance between the scatterer surface and the absorber
surface was 22.5 mm. The distance between the scatterer and the absorber was determined to be as close as pos-
sible because the detection efficiency of higher energy Compton scattering events becomes worse depending on
the distance. Although ARM becomes worse as the distance gets closer because of the geometry uncertainty, the
detection efficiency of Compton scattering events of 245 keV gamma-ray was more priority in this experiment.
The intrinsic detection efficiency of one Compton camera for 245 keV gamma-rays is approximately 0.039%. For
experiments (2) and (3) using 111In, a 0.5-mm-thick steel use stainless (SUS) board was placed in front of each
scatterer to eliminate the 22 keV X-rays from 111In.
Scientific Reports | (2021) 11:17933 | https://doi.org/10.1038/s41598-021-97302-7 7
Vol.:(0123456789)www.nature.com/scientificreports/
Figure 7. Analysis flow. List-mode data from each module contain information about the pixel channel, time
stamp, and ToT width. First, all events from each module are sorted by time. Next, Compton events (events
within 250 ns in a scatterer and an absorber), 511 keV gamma-ray-peak events, and sync-signal time stamps
are extracted from each module’s data. Compton events are used for SPECT-tracer imaging. PET events (events
within 80 ns in opposing absorbers) are extracted from the integrated photo peak events in the two modules
after correcting the time stamps using the sync signals. PET events are used for PET-tracer imaging.
Evaluation of basic performance. The energy resolutions, spatial resolutions and time resolu-
tion (FWHM) were calculated from Gaussian fits. The ARM was evaluated as FWHM of the distribution of
θEne − θGeo, where θEne is the angle calculated from Eq. (1), and θGeo is the angle defined by the geometric loca-
tions of the radioisotopes and the energy-deposition positions. The voigt function was used to determine the
ARM. A 22Na point source was used for the evaluation of spatial resolutions of the PET image and time resolu-
tion. A 18F source and 111In source in 0.2 mL micro tubes were used for the evaluation of spatial resolutions of
the Compton image and the ARM.
Mouse preparation. We used a male nude mouse (BALB/c-nu/mu; 7 weeks old; JapanSLC) bearing an
SY tumor, a small-cell lung-cancer cell line. This experiment was approved by the Committee of Care and Use
of Laboratory Animals of National Institute of Radiological Sciences and was performed in accordance with
the institutional guidelines and regulations. The experiment protocol complied with the ARRIVE guidelines. A
tumor ∼10 mm in diameter was located on the left shoulder. We used 18F-FDG and 111InCl3 as the PET tracer and
SPECT tracer, respectively. In this experiment, we injected 1.8 MBq of 111In-labeled antibody (67A2; anti-c-kit
mouse monoclonal antibody) into the mouse approximately 3 days before the measurement. We also injected
0.2 MBq of 18F-FDG into the mouse 20 min before the measurement. The 18F radioactivity was lower than that
Scientific Reports | (2021) 11:17933 | https://doi.org/10.1038/s41598-021-97302-7 8
Vol:.(1234567890)www.nature.com/scientificreports/
Figure 8. Experimental setup. Two scatterer–absorber modules were placed in opposing positions. The distance
between the source and the surface of a scatterer was 30 mm, and the distance between the surface of a scatterer
and that of an absorber was 22.5 mm. For the basic performance experiments, radionuclide sources were placed
in the center between the two modules. SUS boards were placed in front of each scatterer to shield it from the
111
In X-rays.
of 111In in order to suppress artifacts in the images caused by crosstalk elements. The experimental setup of the
two modules was the same as in Fig. 8, and the mouse was placed at the center between the two modules, and
scanned under anesthesia (isoflurane inhalation of 1.0–1.5% in air).
Received: 22 January 2021; Accepted: 24 August 2021
References
1. Knoll, G. F. Single-photon emission computed tomography. Proc. IEEE 71, 320–329. https://doi.org/10.1109/PROC.1983.12590
(1983).
2. Brownell, G. L. Theory of radioisotope scanning. Int. J. Appl. Radiat. Isot. 3, 181–192. https://doi.org/10.1016/0020-708X(58)
90142-X (1958).
3. Ter-Pogossian, M. M. et al. A positron-emission transaxial tomograph for nuclear imaging (PETT) 1. Radiology 114, 89–98. https://
doi.org/10.1148/114.1.89 (1975).
4. Kaida, H. et al. Glucose transporter expression of an esophageal gastrointestinal tumor detected by F-18 FDG PET/CT. Clin. Nucl.
Med. 35, 505–509. https://doi.org/10.1097/RLU.0b013e3181e05d79 (2010).
5. Adekola, K. et al. Glucose transporters in cancer metabolism. Curr. Opin. Oncol. 24, 650. https://d oi.o
rg/1 0.1 097/C
CO.0 b013e 3283
56da72 (2012).
6. Iagaru, A., Gambhir, S. S. & Goris, M. L. 90Y-ibritumomab therapy in refractory non-Hodgkin’s lymphoma: Observations from
111In-ibritumomab pretreatment imaging. J. Nucl. Med. 49, 1809–1812. https://doi.org/10.2967/jnumed.108.052928 (2008).
7. Delpassand, E. S. et al. Safety and efficacy of radionuclide therapy with high-activity In-111 pentetreotide in patients with progres-
sive neuroendocrine tumors. Cancer 23, 292–300. https://doi.org/10.1089/cbr.2007.0448 (2008).
8. Caobellii, F. et al. Simultaneous dual-isotope solid-state detector SPECT for improved tracking of white blood cells in suspected
endocarditis. Eur. Heart J. 38, 436–443. https://doi.org/10.1093/eurheartj/ehw231 (2017).
9. Hijnen, N. M., de Vries, A., Nicolay, K. & Grüll, H. Dual-isotope 111In/177Lu SPECT imaging as a tool in molecular imaging tracer
design. Contrast Media Mol. Imaging 7, 214–222. https://doi.org/10.1002/cmmi.485 (2012).
10. Wagenaar, D. J., et al. In vivo dual-isotope SPECT imaging with improved energy resolution. 2006 IEEE Nuclear Science Symposium
Conference Record. 6, 3821–3826. IEEE. https://doi.org/10.1109/NSSMIC.2006.353824 (2006).
11. Goorden, M. C. et al. VECTor: A preclinical imaging system for simultaneous submillimeter SPECT and PET. J. Nucl. Med. 54,
306–312. https://doi.org/10.2967/jnumed.112.109538 (2013).
12. Todd, R. W., Nightingale, J. M. & Everett, D. B. A proposed γ camera. Nature 251, 132–134. https://doi.org/10.1038/251132a0
(1974).
13. Watanabe, S. et al. A Si/CdTe semiconductor Compton camera. IEEE Trans. Nucl. Sci. 52, 2045–2051. https://doi.org/10.1109/
TNS.2005.856995 (2005).
14. Takeda, A. et al. Observation of diffuse cosmic and atmospheric gamma rays at balloon altitudes with an electron-tracking Compton
camera. Astrophys. J. 733, 13. https://doi.org/10.1088/0004-637X/733/1/13 (2011).
15. Sato, Y. et al. Radiation imaging using a compact Compton camera inside the Fukushima Daiichi Nuclear Power Station building.
J. Nucl. Sci. Technol. 55, 965–970. https://doi.org/10.1080/00223131.2018.1473171 (2018).
16. Lee, W. & Lee, T. A compact Compton camera using scintillators for the investigation of nuclear materials. NIMA 624, 118–124.
https://doi.org/10.1016/j.nima.2010.09.009 (2010).
17. Jiang, J. et al. A prototype of aerial radiation monitoring system using an unmanned helicopter mounting a GAGG scintillator
Compton camera. J. Nucl. Sci. Technol. 53, 1067–1075. https://doi.org/10.1080/00223131.2015.1089796 (2016).
18. Motomura, S. et al. Multiple molecular simultaneous imaging in a live mouse using semiconductor Compton camera. J. Anal. At.
Spectrom. 23, 1089–1092. https://doi.org/10.1039/B802964D (2008).
19. Kishimoto, A. et al. First demonstration of multi-color 3-D in vivo imaging using ultra-compact Compton camera. Sci. Rep. 7,
1–7. https://doi.org/10.1038/s41598-017-02377-w (2017).
20. Sakai, M. et al. In vivo simultaneous imaging with 99mTc and 18F using a Compton camera. Phys. Med. Biol. 63, 205006. https://
doi.org/10.1088/1361-6560/aae1d1 (2018).
21. Nakano, T. et al. Imaging of 99mTc-DMSA and 18F-FDG in humans using a Si/CdTe Compton camera. Phys. Med. Biol. 65, 05LT01.
https://doi.org/10.1088/1361-6560/ab33d8 (2020).
22. Shimazoe, K. et al. Development of simultaneous PET and Compton imaging using GAGG-SiPM based pixel detectors. NIMA
954, 1641499. https://doi.org/10.1016/j.nima.2018.10.177 (2020).
Scientific Reports | (2021) 11:17933 | https://doi.org/10.1038/s41598-021-97302-7 9
Vol.:(0123456789)www.nature.com/scientificreports/
23. Wilderman, S. J., et al. List-mode maximum likelihood reconstruction of Compton scatter camera images in nuclear medicine.
1998 IEEE Nuclear Science Symposium Conference Record. 1998 IEEE Nuclear Science Symposium and Medical Imaging Conference.
(Cat. No. 98CH36255). Vol. 3 IEEE, 1998. https://doi.org/10.1109/NSSMIC.1998.77387 (1998).
24. Sakai, M. et al. Crosstalk reduction using a dual energy window scatter correction in Compton imaging. Sensor 20, 2453. https://
doi.org/10.3390/s20092453 (2020).
25. Yoshida, C. et al. Therapeutic efficacy of c-kit-targeted radioimmunotherapy using 90Y-labeled anti-c-kit antibodies in a mouse
model of small cell lung cancer. PLoS ONE 8, e59248. https://doi.org/10.1371/journal.pone.0059248 (2013).
26. Tsuji, A. B. et al. Comparison of 2-amino-[3-11C] isobutyric acid and 2-deoxy-2-[18F] fluoro-D-glucose in nude mice with xeno-
grafted tumors and acute inflammation. Nucl. Med. Commun. 33, 1058–1064. https://doi.org/10.1097/MNM.0b013e328356efb0
(2012).
27. Kato, K. et al. An efficient and expedient method for the synthesis of 11C-labeled α-aminoisobutyric acid: A tumor imaging agent
potentially useful for cancer diagnosis. Bioorg. Med. Chem. Lett. 21, 2437–2440. https://d oi.org/1 0.1 016/j.b mcl.2 011.0 2.0 65 (2011).
28. Visser, E. P. et al. Spatial resolution and sensitivity of the Inveon small-animal PET scanner. J. Nucl. Med. 50, 139–147. https://doi.
org/10.2967/jnumed.108.055152 (2009).
29. Wang, Y. et al. Performance evaluation of the GE healthcare eXplore VISTA dual-ring small-animal PET scanner. J. Nucl. Med.
47, 1891–1900 (2006).
30. Kishimoto, A. et al. Demonstration of three-dimensional imaging based on handheld Compton camera. J. Instrum. 10, P11001.
https://doi.org/10.1088/1748-0221/10/11/P11001 (2015).
31. Tashima, H. et al. 3D Compton image reconstruction method for whole gamma imaging. Phys. Med. Biol. 65, 2238. https://doi.
org/10.1088/1361-6560/abb92e (2020).
32. Yamaya, T. et al. Preliminary resolution performance of the prototype system for a 4-layer DOI-PET scanner: JPET-D4. IEEE
Trans. Nucl. Sci. 53, 1123–1128. https://doi.org/10.1109/TNS.2006.871901 (2006).
33. Kishimoto, A. et al. Development of a dual sided readout DOI-PET module using large-area monolithic MPPC-arrays. IEEE Trans.
Nucl. Sci. 60, 38–42. https://doi.org/10.1109/TNS.2012.2233215 (2013).
34. Lee, M. S. et al. Prototype pre-clinical PET scanner with depth-of-interaction measurements using single-layer crystal array and
single-ended readout. Phys. Med. Biol. 62, 3983. https://doi.org/10.1088/1361-6560/aa64c7 (2017).
35. Moses, W. W. & Derenzo, S. E. Prospects for time-of-flight PET using LSO scintillator. IEEE Trans. Nucl. Sci. 46, 474–478. https://
doi.org/10.1109/23.775565 (1999).
36. Vandenberghe, S. et al. Recent developments in time-of-flight PET. EJNMMI Phys. 3, 3. https://d oi.o rg/1 0.1 186/s 40658-0 16-0 138-3
(2016).
37. Hsu, D. F. C. et al. Studies of a next-generation silicon-photomultiplier-based time-of-flight PET/CT system. J. Nucl. Med. 58,
1511–1518. https://doi.org/10.2967/jnumed.117.189514 (2017).
38. Kim, D., Uenomachi, M., Shimazoe, K. & Takahashi, H. Evaluation of single scattering correction method in compton imaging
system. NIMA https://doi.org/10.1016/j.nima.2021.165568 (2021).
39. Shimzoe, K. et al. Double photon emission coincidence imaging using GAGG-SiPM pixel detectors. J. Instrum. 12, C12055. https://
doi.org/10.1088/1748-0221/12/12/c12055 (2017).
40. Uenomachi, M. et al. Double photon emission coincidence imaging with GAGG-SiPM Compton camera. NIMA 954, 161682.
https://doi.org/10.1016/j.nima.2018.11.141 (2020).
41. Orita, T. et al. Double-photon emission imaging with high-resolution Si/CdTe Compton cameras. IEEE Trans. Nucl. Sci. https://
doi.org/10.1109/tns.2021.3086799 (2021).
42. Uenomachi, M., Shimazoe, K., Ogane, K. & Takahashi, H. Simultaneous multi-nuclide imaging via double-photon coincidence
method with parallel hole collimators. Sci. Rep. https://doi.org/10.1038/s41598-021-92583-4 (2021).
43. Sarkar, S. D. et al. Comparison of 123I and 131I for whole-body imaging in thyroid cancer. J. Nucl. Med. 43, 632–634 (2002).
44. Garkavij, M. et al. 177Lu-[DOTA0, Tyr3] octreotate therapy in patients with disseminated neuroendocrine tumors: Analysis of
dosimetry with impact on future therapeutic strategy. Cancer 116, 1084–1092. https://doi.org/10.1002/cncr.24796 (2010).
45. Kamada, K. et al. Cz grown 2-in. size Ce:Gd3(Al, Ga)5O12 single crystal; relationship between Al, Ga site occupancy and scintilla-
tion properties. Opt. Mater. 36, 1942–1945. https://doi.org/10.1016/j.optmat.2014.04.001 (2014).
46. Shimazoe, K. et al. Dynamic time over threshold method. IEEE Trans. Nucl. Sci. 59(6), 3213–3217. https://doi.org/10.1109/TNS.
2012.2215338 (2012).
47. Orita, T., Shimazoe, K. & Takahashi, H. The dynamic time-over-threshold method for multi-channel APD based gamma-ray
detectors. NIMA 775, 154–161. https://doi.org/10.1016/j.nima.2014.12.014 (2015).
48. Kipnis, I. et al. A time-over-threshold machine: The readout integrated circuit for the BABAR Silicon Vertex Tracker. IEEE Trans.
Nucl. Sci. 44, 289–297. https://doi.org/10.1109/23.603658 (1997).
49. Powolny, F. et al. A novel time-based readout scheme for a combined PET-CT detector using APDs. IEEE Trans. Nucl. Sci. 55,
2465–2474. https://doi.org/10.1109/TNS.2008.2004036 (2008).
50. Deng, Z. et al. Development of an eight-channel time-based readout ASIC for PET applications. IEEE Trans. Nucl. Sci. 58, 3212–
3218. https://doi.org/10.1109/TNS.2011.2165557 (2011).
Acknowledgements
This work was supported by AMED under Grant Number 18hm0102040h0003, JSPS KAKENHI Grant Numbers
19J13733, and JST PRESTO Grant number JPMJPR17G5. The authors wish to thank the organization for their
financial support. The basic performance experiments with micro tubes were conducted under the support of
Isotope Science Center, The University of Tokyo. The in vivo imaging was conducted at the National Institutes
for Quantum and Radiological Science and Technology (NIRS). We thank Dr. A. Sugyou and Mr. H. Wakizaka
at the NIRS for their contributions regarding supports of the mouse experiment. The authors would like to thank
Enago (www.enago.jp) for the English language review.
Author contributions
The new modality of Compton-PET hybrid camera was conceived by K.S. The in vivo experiment was conducted
by M.U. and M.T., and other experiments and analysis of all data was conducted by M.U. All authors contributed
to developing the imaging system and discussing the results.
Competing interests
The authors declare no competing interests.
Additional information
Correspondence and requests for materials should be addressed to K.S.
Scientific Reports | (2021) 11:17933 | https://doi.org/10.1038/s41598-021-97302-7 10
Vol:.(1234567890)www.nature.com/scientificreports/
Reprints and permissions information is available at www.nature.com/reprints.
Publisher’s note Springer Nature remains neutral with regard to jurisdictional claims in published maps and
institutional affiliations.
Open Access This article is licensed under a Creative Commons Attribution 4.0 International
License, which permits use, sharing, adaptation, distribution and reproduction in any medium or
format, as long as you give appropriate credit to the original author(s) and the source, provide a link to the
Creative Commons licence, and indicate if changes were made. The images or other third party material in this
article are included in the article’s Creative Commons licence, unless indicated otherwise in a credit line to the
material. If material is not included in the article’s Creative Commons licence and your intended use is not
permitted by statutory regulation or exceeds the permitted use, you will need to obtain permission directly from
the copyright holder. To view a copy of this licence, visit http://creativecommons.org/licenses/by/4.0/.
© The Author(s) 2021
Scientific Reports | (2021) 11:17933 | https://doi.org/10.1038/s41598-021-97302-7 11
Vol.:(0123456789)You can also read