SINGAPORE PUBLIC SECTOR OUTCOMES 2014
←
→
Page content transcription
If your browser does not render page correctly, please read the page content below

SINGAPORE
PUBLIC SECTOR
OUTCOMES
REVIEW          2014
About the
Singapore Public
Sector Outcomes
Review (SPOR)

The biennial SPOR takes stock of how
Singapore has fared in key areas of national
interest. It focuses on whole-of-government
outcomes and indicators that reflect the
current and emerging policy concerns and
issues. Coordinated by the Ministry of Finance
with inputs from all Ministries, SPOR provides
a report on the strategies, programmes and
resources that are employed by our public
agencies to achieve these outcomes.

MINISTRY OF FINANCE
Republic of Singapore
August 2014
Overview

Singapore has entered a new phase of development, as          We are making significant enhancements in social policy,
a maturing economy and society.                               to build and sustain a fair and equitable society. We are
                                                              providing stronger support for those who start off with
We are focused on achieving quality growth, driven by         less, and investing in diverse and flexible pathways to
innovation and productivity, so as to sustain rising living   enable everyone to earn their own success. Our social
standards for all Singaporeans. While unemployment            safety nets are also being strengthened to help the
remains low and the labour market tight, the necessary        vulnerable. Importantly, as Singapore approaches its 50th
upgrading of productivity continues to be work in progress,   year, special recognition is being given to the Pioneer
with gaps especially in services and construction. We         Generation of Singaporeans who helped bring the
need to press on with economic restructuring, and             country to where it is today.
provide businesses with strong support for initiatives
to boost productivity. Our Continuing Education and           Good and affordable healthcare is a key concern
Training (CET) system is also being strengthened to           on Singaporeans’ minds. The Government will keep
help Singaporeans upgrade their skills and achieve their      healthcare affordable through government subsidies,
career aspirations.                                           Medisave top-ups and the new MediShield Life which will
                                                              be in place from end-2015. In addition, our healthcare
Lower- and middle-income households enjoy significantly       capacity is being significantly expanded. Between now
higher incomes today, after accounting for inflation,         and 2020, one new hospital and polyclinic will open
compared to five years ago. Income inequality has also        every year, on average.
fallen. However, domestic cost pressures and a rising
cost of living remain key challenges going forward.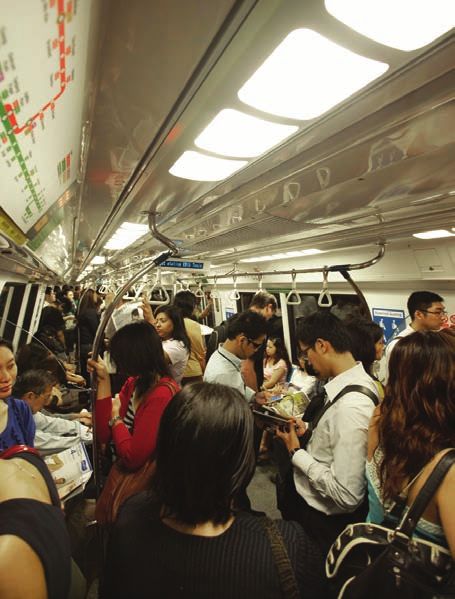
We are strengthening the Central Provident Fund (CPF) by Singapore. Learning from these incidents, the
system further to help Singaporeans retire with peace Government will be improving policing capabilities to deal
of mind. In recent years, we introduced more Workfare with rioting incidents and bolstering our cyber defences.
benefits for lower-income workers and increased the
CPF contribution rates for older workers. We will be strengthening National Service (NS), including
setting up the Singapore Armed Forces (SAF) Volunteer
The housing market is stabilising, following a sharp Corps where women, Permanent Residents (PRs) and
run-up in prices in recent years. Buyers of Housing & new citizens can contribute. Beyond our shores, we
Development Board (HDB) flats have also benefitted from continue to maintain strong ties with our international
a significant increase in flat supply, more choices and partners. Singapore has been actively participating in
enhanced government grants. Much work lies ahead in the the G20 and United Nations (UN) forums, and is working
upgrading of existing towns, as well as the enhancement with its neighbours to establish an ASEAN Community
of the parks, sports facilities, and arts and cultural by end-2015.
activities that make Singapore a better home for all.
Good governance is crucial in keeping Singapore a
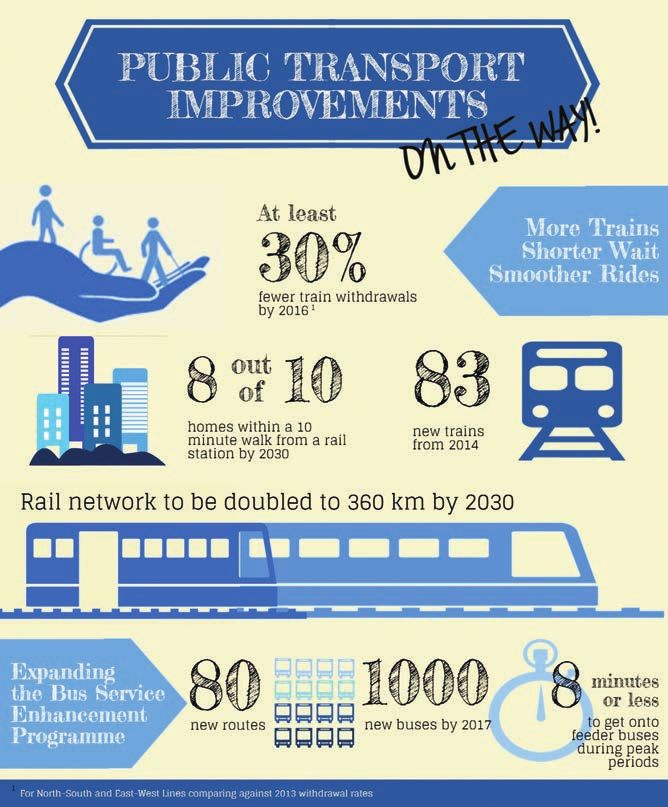
Public transport remains an area for improvement, amid dynamic city and inclusive society. The Government must
concerns about the reliability and overcrowding of train remain effective and maintain the trust of Singaporeans.
services. We are investing heavily to increase capacity Firm actions have been taken to prosecute errant public
and raise service standards. By 2017, 1,000 new buses officers, regardless of seniority, and we will not hesitate
will be on the roads, and the Mass Rapid Transit (MRT) to take further measures to uphold the integrity of our
Downtown Line will be fully operational. public institutions. We are also stepping up efforts to
enhance citizen engagement and improve public service
While crime rates fell to a record 30-year low in 2013, delivery.
the Little India Riot and cyber attacks on government
websites in end-2013 highlight other risks faced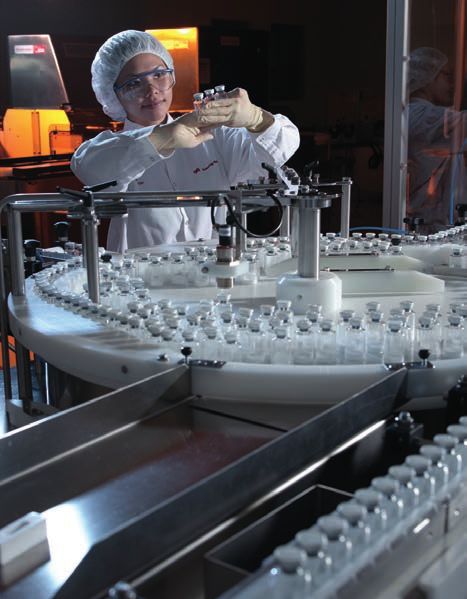
Contents

Chapter 1: A Nation of Opportunity
Quality Growth to Benefit All Singaporeans
   •
   •
       Feature Box: Helping Businesses with Costs and Resources
       Feature Box: Ensuring a Stable Property Market for Sustainable Growth
                                                                                04
Abundant Work and Education Opportunities

Chapter 2: A Caring and Cohesive Society
Singaporeans at the Heart of Population Policies
Assurance of Good and Affordable Healthcare
                                                                                12
   •   Feature Box: MediShield Life: Better Protection. For All. For Life.
Enabling Our Seniors to Enjoy Active and Confident Ageing
A Caring Community
   •   Feature Box: Youth Corps Singapore: A Boost to Youth Volunteerism

Chapter 3: A City to Call Home
Better Public Housing for All
Enhancing Transport and Connectivity
   •   Feature Box: More Responsive Bus Services
                                                                                24
Vibrant Social Spaces for All
   •   Feature Box: Re-igniting the Kampung Spirit: Kampung Admiralty
   •   Feature Box: ActiveSG: Helping Singaporeans Live Better through Sports
A Better Environment for the Present and Future
   •   Feature Box: Stepping Up Measures on Water and Energy Conservation

Chapter 4: A Safe, Secure and Credible Singapore
Protecting our Nation
Maintaining a Safe and Secure Home
   •   Feature Box: Heightening IT Security
                                                                                37
   •   Feature Box: Disruption to Public Order: Little India Riot

Chapter 5: An Effective and Trusted Government
Upholding Good Governance
Enhancing Public Service Delivery
   •   Feature Box: One Public Service: Citizens at the Centre
                                                                                42
Sound and Sustainable Fiscal System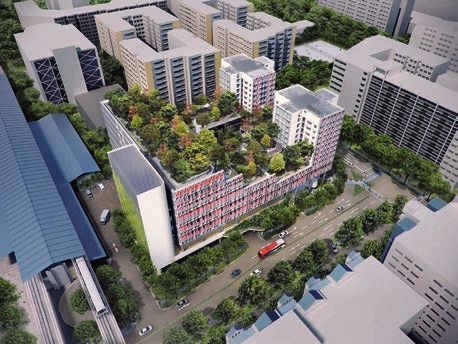
01
 A Nation of Opportunity

           Helping Every Child Succeed

   Greater focus on holistic education, emphasising values,
   sports, art and music

   Better career prospects for polytechnic and ITE students
   through stronger industry linkages and apprenticeship

   New applied degree pathways and stronger focus on
   practical application

      Upgrading Skills, Enhancing Incomes

   Economic restructuring for better quality jobs:
   A journey ahead

   A more progressive fiscal system to mitigate inequality

   Stronger push for Continuing Education and Training:
   1 in 3 workers now participate

   Helping Businesses Improve Productivity

   More than 50,000 companies have benefitted from productivity
   support, with more smaller enterprises coming onboard

   40% of employees’ wage increase co-funded by
   Wage Credit Scheme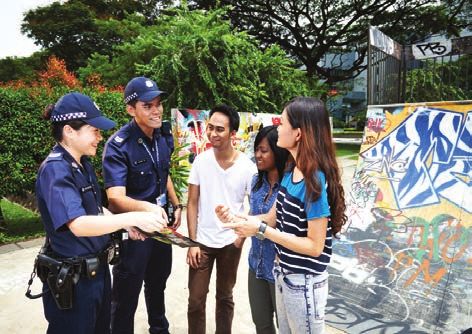
A Nation of / 5
                                                                                                                                 Opportunity

Quality Growth to Benefit All Singaporeans

DESIRED OUTCOMES

•   Sustainable Income Growth
•   Macroeconomic Stability
•   Thriving, Vibrant Enterprise Ecosystem
•   Globally Competitive Workforce

Singapore has made significant shifts in recent years to                       Economic growth picked up in 2013
achieve quality growth, driven by innovation and improved               Real Gross Domestic Product Growth Rate
productivity. This is necessary to enable us to sustain                              (at 2010 prices) (%)
rising incomes for all Singaporeans. It will also allow us to                     15.2
reduce our dependence on foreign workers.
                                                                                             6.1
In support of these efforts, we have tightened foreign worker                                             2.5
                                                                                                                    3.9    3.4
policies in progressive steps since 2010, and introduced              -0.6        15.2
                                                                  00
major incentives for firms to improve productivity.
                                                                        2009      2010       6.1
                                                                                            2011
                                                                                               2012      2013    *2014
Even though Singapore’s economic growth spiked in                                                2.5
                                                                                                          3.9     3.4
2010 due to a strong recovery from the global financial            * Based on advance estimates, up to Jun 2014
                                                                    -0.6
crisis, growth has moderated since then. While the                                        Source: Department of Statistics
external environment has been sluggish, the underlying                  2009      2010      2011      2012         2013   *2014
                                                                         4.3
factors behind slower growth have been the tight labour
                                                                                 Unemployment remained low
market and weak productivity growth. Unemployment has
                                                                                  Resident Unemployment Rate
remained low at less than 3%.
                                                                                   3.1 (annual average) (%)
                                                                                            2.9           2.8       2.8    2.8
                                                                        4.3
In the near future, we expect the global economic outlook
to improve slightly. However, it is essential that we continue
                                                                        2009      2010      2011      2012         2013   *2014
our restructuring efforts to raise productivity in order to
                                                                                   3.1
sustain quality growth. This is fundamentally the only way                                  2.9           2.8       2.8    2.8
that companies can cope with the tight labour market and
rising costs.                                                           2009      11.6
                                                                                  2010      2011      2012         2013   *2014
                                                                   * Refers to seasonally adjusted data for Jun 2014
                                                                   (preliminary)          2.2                             0.9
                                                                 1.8                               Source: Ministry of Manpower
                                                                  0
                                                                                  11.6
                                                                 -3.6
                                                                                                          -1.4     -0.2
                                                                        -3.3
                                                                        2009      2010       2.2
                                                                                            2011      2012         2013   *2014
                                                                                                                           0.9
                                                                                                      -1.4         -0.2
                                                                      -3.3

                                                                        2009      2010      2011      2012         2013   *2014
                                                                                                                 76.4     79.8
                                                                                     75.1
                                                                                                   63.4

                                                                                                                          79.8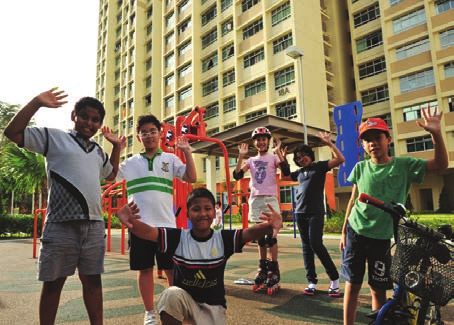
6 / A Nation of
    Opportunity                                                                       15.2

                                                                                                 6.1
                                                                                                                        3.9    3.4
                                                                                                              2.5
                                                                            -0.6
    Economic Restructuring for Quality Growth                           00

    Recent productivity figures have been weak, due partly                    2009     2010     2011      2012         2013   *2014
    to cyclical factors - in particular the strong employment
    growth in less productive sectors such as construction,
    food services and retail.
                                                                              4.3
    However, there are signs of progress on the ground,
    e.g. mature Small and Medium Enterprise (SME)-
    dominated industries like precision engineering and                                 3.1
                                                                                                2.9           2.8       2.8    2.8
    food manufacturing have undergone retooling and are
    experiencing significant productivity growth.
                                                                              2009   Productivity
                                                                                      2010    2011improvements
                                                                                                      2012     not *2014
                                                                                                            2013
    We also recognise the importance of innovation in                                       yet widespread
    achieving quality growth and have committed $16.1 billion                            Labour Productivity Growth
    in funding under the Research, Innovation and Enterprise                         (based on GDP at 2010 prices) (%)
    (RIE) Plan, over FY11-15. This is a 20% increase over the                          11.6
    earlier five-year national RIE plan from FY06-10, and has
    helped to catalyse business investment in Research &                                        2.2                            0.9
                                                                        1.8
    Development (R&D).                                                  0
                                                                       -3.6
                                                                                                              -1.4     -0.2
                                                                              -3.3
                                                                              2009     2010     2011      2012         2013   *2014
                                                                         * Up to Mar 2014
                                                                                                  Source: Department of Statistics

                                                                                                                     76.4     79.8
                                                                                         75.1
                                                                                                       63.4
        HELPING BUSINESSES WITH COSTS AND RESOURCES
        LABOUR                                                    SPACE       34.6

        The Productivity and Innovation Credit (PIC) helps        JTC Corporation’s
                                                                           2009       new industrial
                                                                                    2010    2011     spaces,
                                                                                                     2012     e.g. Food
                                                                                                              2013
        businesses pay for investments that raise productivity.   Hub, allow businesses in the same industry to share
        Over $1 billion of support has been given so far,         services, thus reducing their costs of operations.
        mostly to SMEs. An enhanced PIC+ scheme was
        introduced in 2014 to provide further help for SMEs.      The supply of multiple-user factory space over the
                                                                  next three years will increase substantially to ease
        The Wage Credit Scheme, introduced in 2013 as part        pressure on industrial rents.
        of a three-year Transition Support Package, co-funds
        employees’ wage increases. This helps businesses          TRANSPORTATION
        to share productivity gains with their employees.
                                                                  Road tax rebates were given in 2013.
        The SME talent programme was launched in 2013
                                                                  A further five-year Certificate of Entitlement (COE)
        to attract young talent to SMEs. So far, close to
                                                                  extension was granted for commercial vehicles for
        400 students have been matched with SMEs for
                                                                  which COEs had been renewed once.
        internships and scholarships.
                                                                  The Early Turnover Scheme was enhanced in 2014
                                                                  to lower the replacement costs of old commercial
                                                                  diesel vehicles.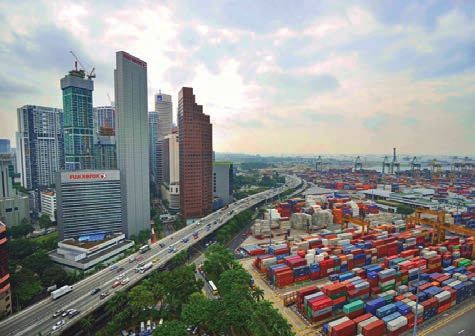
2.5
            -0.6

            2009      2010      2011      2012        2013   *2014

                                                                                                                                                   A Nation of / 7
                                                                                                                                                   Opportunity
             4.3

                       3.1
                                 2.9          2.8      2.8    2.8
Maintaining a Competitive Economy
Singapore
       2009continued
               2010  to rank2012
                     2011    among the world’s
                                 2013  *2014   most
competitive economies:

• Second in the World Economic Forum’s Global
             11.6 Report 2014.
  Competitiveness

• First in the World Bank’s
                     2.2     Ease of Doing
                                         0.9
                                             Business
                                  -0.2
  Report
       -3.32014.           -1.4

Foreign investors maintained their confidence in
Singapore,
        2009with2010
                  inflows
                       2011of foreign
                               2012    direct *2014
                                      2013     investments
reaching a high of $79.8 billion in 2013.

             Investment flows into Singapore stayed firm
                     Foreign Direct Investment ($bil)
                                                    76.4     79.8
                         75.1
                                       63.4

            34.6

             2009       2010           2011         2012     2013
                                Source: Department of Statistics

Maintaining a Stable Cost of Living and                                                              Inflation has moderated
Enhancing Incomes                                                                       Changes in Singapore’s Consumer Price Index (%)
                                                                                                            5.2
                                                                                                                         4.6
Keeping inflation low helps Singaporeans maintain a
quality standard of living. In 2013, government measures
                                                                                                  2.8
to contain price increases in COEs and accommodation                                                                                  2.4
                                                                                                                                             1.7
costs1 led to lower inflation.
                                                                                          0.6
In 2014, inflation is expected to be between 1.5% and
2.5%. Domestic cost pressures, particularly stemming                                     2009     2010      2011         2012     2013      *2014
from a tight labour market, are likely to remain the primary                           * Jan-Jun 2014
source of inflation.                                                                                           Source: Department of Statistics

To facilitate sustainable growth, the Monetary Authority                                                                                    114
                                                                                                                                111
of Singapore (MAS) has maintained a modest, gradual                                                               110
                                                                                                                                            114
appreciation of the Singapore dollar to contain inflation                                             105
                                                                                                                                110
and ensure medium-term price stability.                                                    100                    108
                                                                                                      103
                                                                                           100
                                                                                          2009       2010         2011          2012        2013

                                                                                                                                78.8        78.9
                                                                                                                  78.0
1
    The same trends can be observed if imputed rental (which has no impact on the cash expenditure of 77.0
                                                                                                       most households in Singapore as they already own
    their homes) on owner-occupied accommodation was excluded: inflation fell to 1.9% in 2013 from 3.6% in 2012.
                                                                                          75.6

                                                                                          2009       2010         2011          2012        2013
8 / A Nation of
Opportunity
5.2
Adopting a longer-term and more sustainable approach 4.6
to help Singaporeans (especially the lower- and middle-
income groups) cope with rising costs of living, the 2.8
2.4
Government introduced initiatives to help them upgrade 1.7
their skills, obtain good jobs and earn higher incomes. 0.6
Some of these initiatives include: Incomes
2009 2010have2011
risen steadily
2012 since
2013 2009
*2014
Real Monthly Household Income from Work per
• Enhanced Workfare in 2013 to supplement the Household Member among Citizen Employed
income and retirement savings of older, lower-wage Households
Singaporean workers, and to provide further support Index (2009 = 100) 114
for them to upgrade their skills. 110 111
114
105
• The Progressive Wage Model in the cleaning sector 110
100 108
to provide a pathway for low-wage cleaners to earn
higher wages with better skills and productivity. 103
100
In 2013, Singaporean workers at the 20 percentile and th 2009 2010 2011 2012 2013
median income levels earned $1,800 and $3,480 per 20th Percentile Median
month respectively. This is an increase of 6% and 9% Source: Department of Statistics
respectively since 2009, after accounting for inflation2. 78.8 78.9
78.0
The same trend can be seen at the household level.
Singaporean households, at the 20th percentile and 77.0
median levels, earned $1,011 and $2,114 respectively per
75.6
household member in 2013. This is an increase of 14%
since 2009 for both groups, after accounting for inflation3.
2009 2010 2011 2012 2013
ENSURING A STABLE PROPERTY MARKET FOR SUSTAINABLE GROWTH
60.1
61.5
58.3
Private residential property prices increased by 62% • Raised taxes57.7on property transactions, e.g.
from its low point in 2Q2009 to 3Q2013, driven by Seller’s Stamp Duty and Additional Buyer’s Stamp
low interest rates and continued income growth in Duty. 51.5
Singapore.
• More 2009
land for residential
2010
property
2011 2012
developments.
2013
The Government has introduced several rounds of
measures to cool demand and expand supply, in • Capped mortgage tenures and reduced loan-to-
order to moderate the increase in housing prices value ratios on property loans.
and encourage financial prudence among borrowers.
• A Total Debt Servicing Ratio framework 32.5
for
These include:
property-related loans from financial institutions.
29.0 29.0
27.9
26.9
2009 2010 2011 2012 2013
2
Based on the Consumer Price Index (CPI) All-Items index, which includes imputed rentals (i.e. not involving actual cash expenditure)
0.478 on owner-occupied
accommodation. 0.471 0.472 0.473
0.463
3
Based on the CPI All-Items index for the lowest 20% and middle 60% of households respectively.
0.434
0.424 0.427 0.426
*0.412
2009 2010 2011 2012 2013A Nation of / 9
Opportunity
Abundant Work and
5.2Education Opportunities
4.6
DESIRED OUTCOMES
2.8
2.4
1.7
• Good 0.6
and Diverse Job Opportunities
• Lifelong Learning and Employabilty
• Opportunities
2009 2010for Every
2011 Child
2012 to Excel
2013 *2014
• Holistic Education Centred on Values
5.2 114
4.6 111
110
Our efforts in employment are inclusive and 114 aimed at
2.8 105
helping all Singaporeans, particularly lower-skilled and
110 2.4
100 make progress.108
older workers, Overall, employment
1.7 has
remained0.6healthy, 103
with more Singaporeans able to find
100
jobs and join the workforce in the last five years.
2009 2010 2011 2012 2013
2009 2010 2011 2012 2013 *2014
More Singaporeans have jobs
Employment Rate for Citizens aged 25-64 (%)
78.8 78.9
114
78.0
110 111
77.0 114
105 Over the next three years, about 40,000 to 45,000 young
110
75.6
100 108 Singaporeans are expected to enter the job market each
103 year.
100
2009 2010 2011 2012 2013
2009 2010 2011 2012 2013 To better support their career aspirations, we have taken
Source: Ministry of Manpower
steps to create a range of meaningful jobs. Examples
include:
61.5
More Singaporeans have the potential 60.1 to take on
78.9
78.8 • Moving existing clusters in the manufacturing sector
specialist, managerial
57.7 and leadership
58.3 roles, with the
78.0 up the value chain, supported by R&D to strengthen
education levels of our workforce having improved
capabilities.
significantly over 77.0
the past five years. This trend is
51.5
expected75.6
to continue, alongside our efforts in education • Assisting businesses in the Exportable Services
and lifelong learning. sector4 to enter new, higher-value clusters that play
2009 2010 2011 2012 2013
2009 Education
2010 levels
2011have improved
2012 2013 to the strengths of our workforce (e.g. in the area
of infrastructure services, for which there is high
Resident Labour Force with at least
demand in Asia).
Post-Secondary Qualifications (%)
61.5 We will develop career pathways, applied learning tracks
60.1 32.5
57.7 58.3 and apprenticeship programmes to attract and prepare
29.0 29.0 Singaporeans to take up these good job opportunities.
27.9
26.9 In addition, the Fair Consideration Framework has been
51.5
implemented to encourage companies to consider
2009
2009 2010
2010 2011
2011 2012
2012 2013
2013
Singaporeans fairly for job opportunities. This, together
Source: Ministry of Manpower with the Jobs Bank, will promote a more transparent and
efficient job market.
32.5
0.473 0.478
0.471 0.472
4
29.0transportation and29.0
Includes wholesale trade, 0.463
storage, and information and communications clusters.
27.9
26.9
0.434
0.424 0.427 0.426
*0.412
2009 2010 2011 2012 2013
2009 2010 2011 2012 201310 / A Nation of
Opportunity
Helping Every Child Succeed linkages and ensuring that they receive work-relevant
training. Better education and career guidance will also
be provided, to help students make more informed
choices.
The number of university places will be expanded with
the Singapore Institute of Technology (SIT), our fifth
autonomous university, as well as through the new
publicly-funded full-time degree programmes at UniSIM.
There will be a stronger focus on practical application,
with new applied degree pathways.
The 2012 Organisation for Economic Co-operation
and Development Programme for International
Student Assessment (OECD-PISA) study revealed that
Singaporean students excel in thinking flexibly and
creatively to solve complex and unfamiliar problems.
These are skills that are valued in the 21st century and
the Government is taking further steps to ensure that the
next generation is equipped to take on challenges in an
increasingly volatile and uncertain world.
We will focus on holistic education by increasing
emphasis on values, character and citizenship education. Lifelong Learning to Enhance Employability
For example, the Community Involvement Programme
(CIP) has been reframed as Values-in-Action, to place Learning does not end with formal education in schools.
a stronger emphasis on the nurturing of values through Continuing Education and Training (CET) plays an
community involvement. important role in helping Singaporeans adapt and stay
relevant to changes in our economy. We have made
In addition, our children will have more exposure to significant investments in these areas.
sports, art and music.
Training programmes are heavily subsidised to ensure
Our aim is for each school to be good in its own way, by: that they are accessible to all Singaporeans. From 2012,
we have enhanced training subsidies and absentee
• Nurturing engaged learners.
payroll support for SMEs, to encourage them to send
• Enabling caring and inspiring educators. workers for training.
• Offering varied programmes that cater to our We have expanded CET capacity, from 19 centres
children’s different strengths and interests. in 2008 to 51 in 2014. Two new CET institutes – the
Devan Nair Institute in Jurong and the Lifelong Learning
• Fostering supportive partnerships with parents and Institute in Paya Lebar – will open up more spaces for
the community to achieve the desired outcomes of Singaporeans to upgrade their skills.
education for every child.
These investments, along with increased outreach
There will be diverse and flexible pathways for every child efforts, have raised the proportion of the labour force
to succeed. participating in training each year, to a high of 32.5%
in 2013.
We aim to enhance the academic progression and career
prospects for polytechnic and Institute of Technical The Government will continue to promote lifelong
Education (ITE) students, by strengthening industry learning by injecting a further $500 million into the75.6
77.0
2009 2010 2011 2012 2013
75.6
2009 2010 2011 2012 2013
61.5
60.1 A Nation of / 11
58.3 Opportunity
57.7
61.5
60.1
58.3 51.5
57.7
Lifelong Learning Endowment Fund, bringing the total Lower Income
2009
Inequality
2010
through
2011 2012
an 2013
Fund size51.5
to $4.6 billion. The Fund aims to make the CET Inclusive Approach
system more relevant to the evolving needs of workers
and businesses. The Government’s efforts in economic restructuring and
2009 2010 2011 2012 2013
lifelong learning have contributed to income growth for
More workers getting trained lower- and middle-income Singaporeans. 32.5
Overall Training Participation Rate (percentage of
Resident Labour Force aged 15-64) (%) In addition, we are providing further support for those at
29.0 29.0
32.5 the lower 27.9
end of the income ladder through government
26.9
transfers. Together with Singapore’s progressive fiscal
29.0 29.0 system, we have been able to lower income inequality,
27.9 as measured
2009 by the Gini coefficient
2010 2011
5
.
2012 2013
26.9
Reduced income inequality in 2013
2009 2010 2011 2012 2013 Gini Coefficient based on Household Income From
Work (incl Employer CPF) per Household Member
Source: Ministry of Manpower
among Resident Employed Households
0.473 0.478
0.471 0.472
We will also support SMEs through the Enterprise 0.463
Training Support scheme, with a total funding of $20
0.478 0.434
million to0.471
be made available
0.472 to companies
0.473 from 2013 to 0.424 0.427 0.426
0.463
2015. As of December 2013, this scheme has benefitted *0.412
12,500 local workers from 68 companies,
0.434
of which 71%
are SMEs. 0.424 0.427 0.426 2009 2010 2011 2012 2013
*0.412
*Preliminary
The Government is reviewing the CET Masterplan on
before taxes after taxes
three fronts:
2009 2010 2011 2012 2013 and transfers and transfers
• Greater emphasis and support for self-initiated Source: Department of Statistics
upgrading.
• More help for companies to integrate CET into
business strategy and performance management.
• A more responsive CET system to meet the evolving
needs of growth sectors.
5
The Gini coefficient has a scale of 0 to 1, where 0 indicates perfect income equality and 1 indicates perfect income inequality. The Gini coefficient after
accounting for government taxes and transfers has been revised to incorporate improved coverage of government taxes and transfers.02
A Caring and Cohesive Society
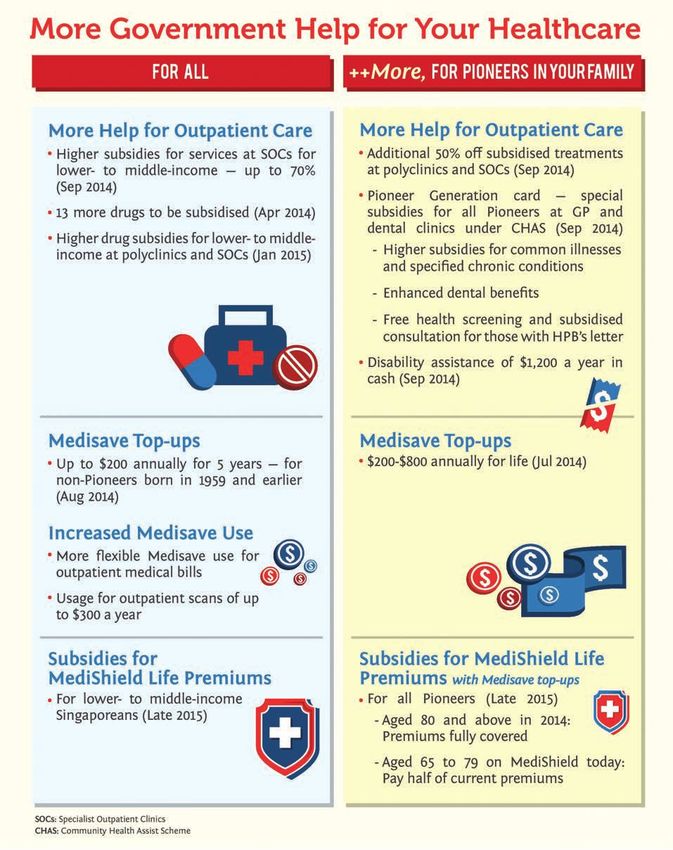
Assurance of Good and Affordable Healthcare
Enhanced subsidies for all and lifelong support for
Pioneer Generation
MediShield Life: Better Protection. For All. For Life.
Growing healthcare capacity and manpower
Helping Singaporeans Retire with Greater Peace of Mind
Increase in CPF contribution rates for older workers
More Workfare benefits for lower-income workers
1% higher Medisave contribution rate by employers
Resilient Families and a Caring Community
Stronger support for marriage and parenthood
Deepening the culture of volunteerism
20 Social Service Offices by 2015 to provide one-stop
social assistanceA Caring and / 13
Cohesive Society
Singaporeans at the Heart of Population Policies
DESIRED OUTCOMES
• Strong Singaporean Core
• Resilient Families and Communities
Our population policies put Singaporeans first, and are Stable core of Singapore Citizens and
centred on nurturing strong families and communities. Permanent Residents
Singapore had the slowest population growth in the last Composition of Total Population (million)
nine years, following the slowdown in foreign worker 2013 3.31 0.53 1.55 5.40
1.6%
growth
growth and tightening of our immigration policy since
2012 3.29 0.53 1.49 5.31
late-2009. Most of the foreign worker growth last year
2.1%
was in the construction sector to support infrastructure 2011 3.26 0.53 1.39 5.18
growth
developments. 2010 3.23 0.54 1.31 5.08
per
year
Singapore’s resident Total Fertility Rate remains well 2009 3.20 0.53 1.25 4.99*
below the replacement rate. We continue to support 2013 3.31 0.53 1.55 5.40
1.6%
Singaporeans in their aspirations to marry and have * Numbers may not add up due to rounding growth
children, and will continue to work with community 2012
Citizens 3.29
PRs 0.53 1.49 5.31
Non-Residents
partners to promote family life. 2011 3.26 Source:0.53
Department
1.39 5.18
of Statistics
2.1%
growth
per
2010 3.23 0.54 1.31
1.29 5.08 year
1.22 1.20 1.19
1.15
2009 Fertility
3.20 still 0.53
too low
1.25 4.99*
Total Fertility Rate (per female)
2009 2010 2011 Rate2012
Replacement = 2.1 2013
2.2
1.8 17.8 18.0
16.7 16.2 16.9
1.29
1.4 1.22 1.20 1.19
1.15
11.5 11.6 12.1 12.1
1.0
11.1
2009 2010 2011 2012 2013
Source: Department of Statistics
2009 2010 2011 201217.8 *201318.0
16.7 16.2 16.9
84.3 84.6
83.7 84.0 84.1
11.5 11.6 12.1 12.1
11.1
2009 2010 80.2
79.2 79.52011 79.82012 *2013
78.9
84.6
200983.7 201084.0 201184.1 201284.3 2013
95 94
92 92
90
79.8 80.2
79.2 79.5
78.9
2009 2010 2011 2012 201314 / A Caring and
Cohesive Society
Supporting Marriage and Parenthood • Enhanced the quality of early childhood services by
improving the curriculum, adopting best practices and
We have introduced more support for Singaporeans in enhancing the Singapore Pre-School Accreditation
their marriage and parenthood journeys: Framework (SPARK).
• Married couples can rent a flat from the Housing & • Created more structured professional development
Development Board (HDB) while waiting for their new pathways for early childhood sector professionals.
flats to be ready, under the Parenthood Provisional
Housing Scheme.
• Engaged couples can apply for a flat in advance
while they wait to register their marriage (within three
months of moving into the flat). This scheme has also
been extended to divorced/widowed persons with
children.
• The Parenthood Priority Scheme gives priority
allocation of direct-purchase HDB flats to first-time
married couples expecting a child or who have a
citizen child below the age of 16.
• The Baby Bonus cash gift has been enhanced to give
more support to parents.
Supporting Resilient Families 1.6%
• Each newborn citizen receives a Medisave grant of 2013 3.31 0.53 1.55 5.40
growth
$3,000. Singaporeans
2012 continue
3.29 to enjoy
0.53 strong
1.49 5.31 family ties. In
2013, 94% of respondents to a Ministry of Social 2.1% and
• MediShield has been extended to cover congenital 2011 3.26 0.53 1.39 5.18
Family Development (MSF) survey agreed thatgrowth they have
and neonatal conditions, to better support children’s a close-knit
2010family. 3.23 0.54 1.31 5.08
per
year
healthcare needs.
2009 3.20 0.53 1.25 4.99*
However, there has been a gradual but steady increase
To give every child a good start, the Government has in divorce rates, with about 7,000 divorces and some
taken significant steps to improve the accessibility, 6,500 children affected by such break-ups every year.
affordability and quality of early childhood services: The MSF and the Ministry of Law will introduce a new
pre-divorce programme, which highlights to couples
• Set up the Early Childhood Development Agency. the importance of prioritising children’s welfare and the
1.29
1.22
• Set up about 70 new childcare centres in 2013. We practical considerations
1.15 of1.20divorce, e.g. housing
1.19 and
will have at least 130 more childcare centres by 2017. care of children.
2009 2010 2011 2012 2013
• Made childcare and kindergarten more affordable Divorce on the rise
to parents through enhancements to the Child Care Cohort Divorce Rates (%)
18.0
Subsidies and the Kindergarten Fee Assistance 16.7 16.2 16.9
17.8
Scheme (KiFAS).
11.5 11.6 12.1 12.1
11.1
Kindergarten Fee
Assistance Scheme (KiFAS)
Monthly fee assistance:
2009 2010 2011 2012 *2013
from $108 to $160
*Preliminary
Qualifying household income:
from $3,500 to $6,000 Before 7th year
84.0
83.7of marriage 84.1 Before th 84.6
84.3 20 year
of marriage
Source: Department of Statistics, Ministry of
Social and Family Development
79.8 80.2
79.2 79.5
78.9
2009 2010 2011 2012 2013
95 94A Caring and / 15
Cohesive Society
We have devoted $40 million between 2013 and 2016
to support FamilyMatters!, a joint effort among schools,
workplaces, businesses and community partners to
promote family life.
To better support work-life harmony and shared parental
responsibility, the Government introduced one week
of government-paid paternity leave and one week of
government-paid shared parental leave. In addition,
employers who implement work-life strategies for their
employees can tap on the Work-Life Grant.
1.6%
2013 3.31 0.53 1.55 5.40
growth
2012 3.29 0.53 1.49 5.31
2.1%
2011 3.26 0.53 1.39 5.18
growth
per
2010 3.23 0.54 1.31 5.08 year
2009 3.20 0.53 1.25 4.99*
Assurance of Good and Affordable Healthcare
DESIRED OUTCOME
• Assurance of Good and Affordable Healthcare
1.29
1.22 1.20 1.19
1.15
2009 2010 2011 2012 2013
Singaporeans enjoy good health outcomes, comparable Promoting Healthy Living
to developed countries like Japan and South Korea.
This is possible because of established
17.8 public
18.0 health The Healthy Living Master Plan was launched in April
16.7 16.9
infrastructure and 16.2
preventive health programmes, high 2014. It aims to make healthy living natural and effortless
standards of public hygiene, and quality healthcare. for Singaporeans, wherever they are:
We continued
11.1 to make
11.5 progress
11.6 on the
12.1 “Healthcare
12.1 2020” • At workplaces: Employees can readily access healthier
Masterplan, which aims to improve the accessibility, meal options and fitness amenities and programmes,
quality and affordability of healthcare. despite their busy work schedules.
2009 2010 2011 2012 *2013 • In the community: Residents can readily access
Singaporeans are living longer
Life Expectancy of Residents at Birth (years) healthier food options and are presented with visual
84.3 84.6 cues to encourage physical activity.
83.7 84.0 84.1
• In schools: Oral care is extended to pre-schoolers
and children are provided with whole grains, fruits and
vegetables through the Healthy Meals Programme in
80.2
79.2 79.5 79.8 childcare centres and schools.
78.9
In addition, a point-of-sale display ban for tobacco will
2009 2010 2011 2012 2013 be implemented in 2016.
95 Male 94
Female
92 92
90
Source: Department of Statistics
2009 2010 2011 2012 2013
64.0 64.8
61.2
58.7
56.916 / A Caring and
Cohesive Society
Improving Healthcare Capacity
End-2013 2020
and Outcomes
We are growing our healthcare capacity and manpower Home 5,400 home 10,000 home
to better cater to an ageing population. These measures Healthcare places places
include:
Home
1,100 home 7,500 home
• One new hospital (acute or community) on average Personal
places places
every year, until 2020. Care
• Six new polyclinics by 2020. Eldercare 2,700 day 6,200 day
Centres places places
• Three new Community Health Centres in 2014 to
support General Practitioners (GPs) with allied health Nursing
and nursing services (e.g. eye screening). 9,700 17,000
Home
beds beds
(Generic)
• More home and community-based care to help our
seniors age gracefully at home.
We are also supporting caregivers as they care for their
• Larger intakes of medical and nursing students. family members at home, with a one-stop call centre and
weekend respite services at our eldercare centres.
• Attracting mid-career professionals and nurses who
are keen to return to active practice.
While our healthcare system provides good health Keeping Healthcare Affordable
outcomes, we will continue to work on our service
standards, particularly in primary care, community-based Singapore’s spending on healthcare is about 4% of GDP.
and home care. We will better integrate health and social This is lower than many developed countries, mainly
care services, and promote enhanced standards to because of our relatively young population and high
improve the quality of care in the long-term care sector. GDP. However, Singapore’s population is ageing and
economic growth may not be as high as before. The
We are implementing measures to enable our seniors to Government’s share of national health expenditure is
age-in-place gracefully when they become frail. Capacity expected to rise from one-third in 2012 to 40% or more
in long-term care services is being expanded. in the future.
The 3Ms (Medisave, MediShield and MediFund)
framework and government subsidies help Singaporeans
pay for healthcare. There are broad-based subsidies
across all healthcare settings, ranging from primary
care and inpatient hospitalisation to specialist outpatient
care and long-term care. After subsidies, the 3Ms help
individuals pay for their share of the bill. On average,
individuals only need to pay cash for less than 10% of a
subsidised hospital bill, after Medisave and MediShield.11.5 11.6 12.1 12.1
11.1
2009 2010 2011 2012 *2013
84.3 84.6 A Caring and / 17
83.7 84.0 84.1
Cohesive Society
79.8 80.2
79.5
Medisave
78.9 and MediShield
79.2 pay for most of We are also improving our healthcare financing
hospital bills but less than before framework:
Average Coverage of Class B2/C Bills by
2009 2010 2011 2012 2013
Medisave and MediShield (%) • Expanding the Community Health Assist Scheme
95 94 (CHAS) so that more Singaporeans can have
92 92
90 subsidised care at over 1,000 participating GP and
dental clinics.
• Enhancing subsidies at Specialist Outpatient Clinics
(SOCs) in our public hospitals for lower- to middle-
income Singaporeans.
2009 2010 2011 2012 2013
Source: Central Provident Fund Board • Expanding the use of Medisave to more categories
64.0 64.8 of outpatient treatment, e.g. more vaccinations and
61.2 chronic conditions. From the first half of 2015, a new
However, our seniors
58.7 may not have enough in their Flexi-Medisave scheme will allow seniors aged 65
56.9
Medisave accounts for their healthcare needs after and above to use up to $200 per year for outpatient
retirement. They may not have been able to accumulate medical treatment at public sector SOCs, polyclinics
enough in Medisave, since the scheme was only and CHAS clinics. From 1Q2015, all Singaporeans
introduced in 1984.
2009 To boost
2010 2011their Medisave
2012 savings, we
2013 can also tap on Medisave for outpatient scans, up to
introduced the following: $300 per year.
48.7 49.4
• The Goods and Services45.0 Tax (GST) Voucher –
Medisave scheme was introduced in 2012 to provide
40.7
most elderly Singaporeans with an annual top-up of Pioneer Generation Package
37.5
between $150-450 to their CPF Medisave account.
To recognise the contributions of the special cohort of
• All Singaporeans
2009 2010aged2011
55 and2012
above 2013
in 2014 and seniors who built Singapore, the Government introduced
who do not enjoy Pioneer Generation benefits will the Pioneer Generation Package which has three key
32.3
receive a Medisave top-up of $100-200 per year, healthcare components:
over the next five years. 23.3 • Outpatient care subsidies.
For employees,
15.2 the CPF employer
15.5 16.9 contribution rate will
• Annual Medisave top-ups.
be increased by 1%-point from 2015, allocated to their
Medisave account. • MediShield Life premiums subsidies.
2004 2006 2008 2010 2012
These benefits are not means-tested and are valid for
1,031 life. In 2014, the Government has set aside $8 billion to
970
fund the package.
896
776
687
0.29
0.25 0.26 0.26
0.24
2009 2010 2011 2012 2013
15,574
13,578
10,688
8,405 7,656
2009 2010 2011 2012 201318 / A Caring and
Cohesive Society
Source: Ministry of HealthA Caring and / 19
Cohesive Society
MEDISHIELD LIFE: BETTER PROTECTION. FOR ALL. FOR LIFE.
From end-2015, MediShield will be enhanced to Limits can continue to fully cover MediShield Life
become MediShield Life. premiums. The additional 1%-point in employer
Medisave contribution from 2015 will also be
• BETTER PROTECTION. Coverage under sufficient to cover the increases in premiums for
MediShield Life will be significantly enhanced, most households.
with higher claim limits and lower co-insurance
rates. This will provide Singaporeans with greater In addition, the Government has committed close
assurance and protection against large hospital to $4 billion over the next five years in premium
bills, as MediShield Life will pay more and patients subsidies and other forms of support. These include
pay less. bearing the bulk of the cost of bringing in those with
pre-existing conditions, as well as:
MediShield Life will reduce out-of-pocket
payments. Today, only one in 10 subsidised Class
B2/C patients with bills exceeding $10,000* pay
less than $3,000 in cash or Medisave. In future, Pioneer Generation subsidies.
with MediShield Life, the number will increase to
six in 10.
Premium subsidies for lower- to
middle-income households.
MEDISHIELD MEDISHIELD LIFE Additional premium support on
a case-by-case basis for the
*2 in 100 subsidised Class B2/C bills exceed $10,000 needy.
• FOR ALL, FOR LIFE. With MediShield Life
providing universal coverage, all Singapore
Citizens and Permanent Residents will be able to Transitional subsidies for the
benefit even if they have pre-existing conditions. first four years for all Singapore
They will also have greater peace of mind with Citizens, regardless of
lifetime coverage. income, to ease the shift from
MediShield to MediShield Life.
• AFFORDABLE PREMIUMS. To fund better
benefits, premiums will have to increase. However,
MOH will ensure that Medisave Withdrawal2012 3.29 0.53 1.49 5.31
2.1%
2011 3.26 0.53 1.39 5.18
growth
per
2010 3.23 0.54 1.31 5.08 year
2009 3.20 0.53 1.25 4.99*
20 / A Caring and
Cohesive Society
1.29
1.22 1.20 1.19
1.15
Enabling Our Seniors to Enjoy Active and Confident Ageing
2009 2010 2011 2012 2013
DESIRED OUTCOME
• Active 16.7
and Confident 16.9
Ageing 17.8 18.0
16.2
11.5 11.6 12.1 12.1
11.1
Keeping Our Seniors Healthy and Active • The Retirement and Re-employment Act helps
workers to remain employed beyond the retirement
The National Wellness Programme has been age of 62, for at least another three years to 65.
implemented
2009 in all2010
87 constituencies
2011 2012and touched
*2013 more
than 340,000 seniors. As part of this programme, seniors The Tripartite Committee on Employability of Older
are encouraged to stay healthy by participating 84.6
in health Workers has been reconvened to undertake five broad
84.3
fitness 84.1
physical84.0
screening,83.7 activities, interest groups and thrusts in helping our older workers:
volunteerism.
• Improve workplace practices and support.
We have also embarked on the City for All Ages project
in 16 constituencies, seeking • Raise productivity and skills of older workers.
79.5 to understand
79.8 80.2the needs
79.2
of seniors78.9in their communities and implementing • Shape positive perceptions of older workers.
programmes to address these needs.
2009 2010 2011 2012 2013 • Enhance employment facilitation.
95 94
92
Helping Older Workers Stay 92
Gainfully
90
• Improve retirement planning.
Employed
With Singaporeans living longer and healthier, many of
our seniors are able and want to continue working.
2009 2010
More older 2011
Singaporeans 2012
can 2013
find work
Employment Rate for Citizens aged 55-64 (%)
64.0 64.8
61.2
58.7
56.9
2009 2010 2011 2012 2013
Source: Ministry of Manpower
49.4
48.7
45.0
We have enhanced 40.7
our support to help older citizens Ensuring Retirement Adequacy
remain gainfully
37.5
employed. For example:
Singaporeans are fortunately living longer. This also means
• The Workfare Income Supplement (WIS) scheme was that we have to save more to take care of basic needs
2009 in 2013,
enhanced 2010 with
2011
a more2012 2013 eligibility
generous in retirement. The Government will continue to improve
criteria and higher payouts, to encourage workers to the CPF system to help Singaporeans achieve this.
32.3
stay employed.
To boost retirement savings, we have made some
23.3
• Employers will receive a one-time Special Employment improvements in recent years:
16.9
Credit 15.2
(SEC) enhancement
15.5 in 2015, to help cope with
• Lifelong Medisave top-ups for the Pioneer Generation
the costs arising from the increase in CPF contribution
(elaborated in the previous section on Pioneer
rates for older workers announced at Budget 2014.
2004 2006 2008 2010 2012 Generation Package).
1,031
970
896
7762009 2010 2011 2012 2013
A Caring and
64.8 / 21
64.0
Cohesive Society
61.2
58.7
56.9
• Increase in CPF contribution rates for older workers. More attained the CPF Minimum Sum
Active
2009 CPF2010
Members 2011
who are Able
2012to Meet2013
the
• More Workfare benefits for lower-income workers. Minimum Sum in Cash and Property at age 55 (%)
48.7 49.4
• Medisave contribution rate by employers will be 45.0
raised by 1%-point by 2015.
40.7
We also plan to further strengthen the CPF system and 37.5
help Singaporeans retire with greater peace of mind:
2009 2010 2011 2012 2013
• Enhance CPF LIFE to help retiree households cope
Source: Central Provident Fund Board
better with the cost of living. 32.3
• Provide greater support in retirement for the lower- 23.3
income groups. 16.9
15.2 15.5
• Help HDB flat-owners to get a stream of money in
their retirement based on the value of their flats. 2004 2006 2008 2010 2012
1,031
970
896
776
687
0.29
A Caring Community 0.25 0.24
0.26 0.26
2009 2010 2011 2012 2013
DESIRED OUTCOMES
15,574
• Support for the Vulnerable 13,578
• Accessible, Citizen-centric Social Services 10,688
8,405
• Harmonious and Gracious Society 7,656
• Active and Caring Citizenry
2009 2010 2011 2012 2013
The Government recognises the importance of forging a We are also developing a Community Dispute
gracious and cohesive society. Since 2013, the Singapore Management Framework to better manage community
Kindness Movement has increased its engagement with disputes among neighbours and to improve
groups that champion kindness and community bonding. neighbourliness.
Through the National Integration Council, we have also
worked with partners in the private and people sectors
to foster greater integration of foreigners and new
immigrants. A series of handbooks has been published to
help newcomers understand and adapt to our way of life.
In addition, the Singapore Citizenship Journey is being
enhanced so that new citizens can better appreciate the
significance of becoming Singaporean.
To promote greater neighbourliness, the People’s
Association (PA) is piloting a series of “chit-chat sessions”
to bring local and new residents together to network and
bond on a more personal basis.37.5
2009 2010 2011 2012 2013
2009 2010 2011 2012 2013
32.3
64.0 64.8
22 / A Caring and
23.3
Cohesive Society 61.2
58.7 16.9
56.9 15.2 15.5
2004 2006 2008 2010 2012
Encouraging
2009
Volunteerism
2010 2011 2012 2013
Culture of giving nascent but taking root
Charitable Giving to IPCs
Our national volunteerism rate has48.7risen steadily
49.4 from 1,031
970
15.2% in 2004 to 32.3% in 2012. It is heartening to note
45.0 896
that people are getting more involved in causes they care
about and helping40.7those in need, reflecting a positive 776
community spirit.
37.5 687
0.29
0.25 0.26 0.26
2009 More are 2011
2010 volunteering
2012 2013 0.24
National Volunteerism Rate (%) 2009 2010 2011 2012 2013
32.3
Amount ($ mil) Percentage of GDP (%)
15,574
23.3 Source: Ministry of Culture, Community
13,578 and Youth
16.9 10,688
15.2 15.5
8,405 7,656
2004 2006 2008 2010 2012 Enhancing Social Service Support
Source: National Volunteer & Philanthropy Centre
We are strengthening social service delivery to ensure
1,031
970
that Singaporeans
2009 receive2011
2010 help when
2012 they2013
need it. For
We aim to sustain this encouraging
896 trend: instance, the Government will:
• The Government 776 is working with the National • Set up a network of about 20 Social Service Offices by
Volunteer & Philanthropy Centre (NVPC) to develop a
687 end-2015, to coordinate and bring social assistance
Volunteer Management 0.26 0.29
Consultants initiative, to help closer to residents in each neighbourhood.
0.25 0.26
0.24
charities sustain volunteer involvement.
2009 2010 2011 2012 2013
• Introduce a new scheme to groom and develop social
• The Caring Assistance for Neighbour programme service leaders, to be launched by end-2014.
was launched in collaboration with the15,574 Agency for
13,578 • Expand and enhance programmes to develop social
Integrated Care. Under this new initiative, seniors who
10,688 service professionals.
are still mobile make regular visits to other seniors,
8,405
befriending them and reminding them to take their
7,656
• Implement an integrated case management system
medication. and database Social Service Net in 2015, to facilitate
information sharing among social service agencies
• The Social Enterprise Mentoring Programme helps
and to provide timely assistance to beneficiaries.
corporations offer coaching support to social
2009 2010 2011 2012 2013
enterprises, in areas such as marketing and business
development.
• The Community Development Councils encourage
community ownership by involving employees
from corporate and community partners as well as
students in their volunteering programmes.
Donations to Institutions of a Public Character (IPCs)
dropped slightly in 2013. We will continue to work with
partners like NVPC to champion a strong giving culture
in Singapore. The Government has set aside $250
million in matching grants to support the Care & Share
Movement, which go towards helping voluntary welfare
organisations raise capabilities, expand capacity and
provide social service programmes to serve needy and
less fortunate Singaporeans.56.9
2009 2010 2011 2012 2013
48.7 49.4
A Caring and / 23
45.0 Cohesive Society
40.7
37.5
2009 2010 2011 2012 2013
YOUTH CORPS SINGAPORE:32.3
A BOOST TO YOUTH VOLUNTEERISM
We launched the Youth Corps Singapore,
23.3 which had them make sustained and meaningful contributions
its pilot intake in June 2014.
16.9
to society.
15.2 15.5
The Youth Corps matches youth volunteers with With these efforts, we hope to empower our youths
critical2004
needs2006
in the2008
community
2010
and
2012
facilitates to remain engaged in the community beyond their
ground-up youth initiatives. It also trains youths in school years.
service-learning and other essential skills, to help
1,031
970
896
776
The number of low-income households helped under Empowering Persons with Disabilities
ComCare 687
has increased over the years, with a range of
assistance tailored to individual 0.29
0.26 circumstances.
0.26
The Enabling Masterplan 2012-2016 aims to address
0.25 0.24 the needs of persons with disabilities at each stage of
2009 More receiving
2010 2011 help
2012 2013 their lives. Initiatives include:
Number of Households Assisted under ComCare
15,574 • Higher subsidies for the Early Intervention Programme
13,578
for Infants and Children (EIPIC) for lower- to middle-
10,688 income families.
8,405 7,656
• More places in Day Activity Centres by end-2014, to
provide care and skills training for adults with higher
care needs.
2009 2010 2011 2012 2013 • New transport subsidies for persons with disabilities
Source: Ministry of Social and Family Development since July 2014, to ease the costs for them to attend
school, work and care services.
To reach out to a wider group of needy residents, the
MSF has continued to make enhancements to ComCare:
• The household income criterion for short-to-medium-
term assistance was increased from $1,700 to $1,900
per month and the per capita income criterion from
$550 to $650 per month.
• The criteria for long-term assistance (also known as
Public Assistance) were widened to cover more needy
elderly. Additional help was also provided for medical
essentials such as adult diapers and commodes.03
A City to Call Home
Better Public Housing for All
Ramped up supply, with 77,000 new flats launched
since 2011
Improved affordability with stable BTO flat prices and easing
of private property prices
Improving Public Transport
Customer Satisfaction
Fixing train breakdowns and stepping up Survey for Public
maintenance Transportation System
93.8% 88.5%
83 new trains from 2014; Downtown Line
fully operational by 2017
1,000 new buses by 2017; bus industry
restructuring for long-term responsiveness
2009 2013
More Vibrant Social Spaces
Free admission to museums for all Singaporeans
More parks and sports facilities within 10-min walk from home
by 2030
25 community arts and cultural nodes across Singapore
by 2025A City to / 25
Call Home
Better Public Housing for All
DESIRED OUTCOMES
• Affordable Homes 90.4 90.1 91.7 91.8
88.8
• Quality Living Environment
Our public housing programme gives Singaporeans HDB flats kept affordable
a stake in the nation and provides different groups of 2009 Weighted
2010Average Debt Servicing
2011 2012 Ratio2013
Singaporeans with quality and affordable homes. (DSR) for First-timer Applicants Buying New
Flats in Non-mature Estates (%)
Buyers of new Housing & Development Board (HDB) flats 22
24 24 24
21
have benefitted from a significant ramp-up in flat supply,
stable prices that have been delinked from fluctuations in
the resale market and new government grants.
Prices in the HDB resale and private housing markets
have risen significantly in recent years. To moderate price
pressures, the Government has ramped up new flat supply 2009 2010 2011 2012 2013
and introduced several rounds of cooling measures to Source: Housing & Development Board
restore balance to the market6. In 2013, HDB resale prices *The DSR refers to the proportion of the monthly
fell for the first time in eight years and continued to soften household income set aside for housing instalments.
It93.8
is derived based
92.2 on the median monthly household
in the first half of 2014.
income of first-timer applicants
90.3 and the selling price of
88.8
new flats offered in the respective years. 88.5
It is calculated
Home ownership remains high based on a 30-year HDB concessionary loan before
Home Ownership among Resident 2013 and a 25-year HDB concessionary loan for 2013
(the maximum loan tenure was revised in Aug 2013),
HDB Households (%)
factoring in the various housing grants. Data is for non-
90.4 90.1 91.7 91.8 mature estates, which form the majority of HDB’s new
88.8 2009
flat supply. 2010 2011 2012 2013
2.0
1.7 1.8 1.7
1.3
2009 2010 2011 2012 2013
Source: Department of Statistics
24 24 24
21 22 2009 2010 2011 2012 2013
76.2%
71.2%
6
For more information on the cooling measures, please refer to the feature box in Chapter 1 on “Ensuring a Stable Property market for Sustainable Growth”.
2009 2010 2011 2012 2013
79.2%
77.5%
93.8
92.226 / A City to
Call Home
MEETING THE NEEDS To ensure a high quality living environment and public
housing, we are:
OF DIFFERENT GROUPS • Developing three new housing areas: Punggol
Matilda, Tampines North and Bidadari, with facilities
that help Singaporeans fulfil their lifestyle and housing
INCOME aspirations.
CEILINGS
• Rolling out improvement and renewal programmes for
existing towns (e.g. Remaking Our Heartland projects,
Home Improvement Programme, Enhancement for
Active Seniors Programme, Neighbourhood Renewal
Programme, Car Park Lift Installation Programme,
Helping young and Selective En bloc Redevelopment Scheme).
Raised income families with the
ceilings for HDB new Parenthood
flats and Executive Priority Scheme and
Condominiums Parenthood Provisional
Housing Scheme
Helping the
Helping singles elderly with the
by allowing them to buy Studio Apartment Priority
two-room BTO flats in Scheme, Silver Housing
non-mature estates Bonus and Enhanced
Lease Buyback Scheme
Helping vulnerable families with
10,000 more public rental flats in the pipeline,
Assistance Scheme for Second-Timers
(Divorced/Widowed Parents) (ASSIST) to
help divorced and widowed parents with
young children secure 2-/3-room BTO flats in
non-mature estates, and shorter three-year
time bar for divorced couples
Supporting
multi-generation
families by introducing
the new Three-Generation
flat that is purpose-built to
meet their needs and lifestyleA City to / 27
Call Home
What's coming up next?
Stronger Support for All
Changes to how we buy and sell HDB flats
to reduce focus on COV
More housing support for elderly, vulnerable
& extended families
Study on reverse mortgage and Lease Buyback
Per-minute charging for motorcycles
at EPS car parks
parking at all HDB/URA car parks
Making Every Town A Better Town
1,500 BTO flats, including 50 3Gen flats,
to be launched in Tampines North
3 more towns to be rejuvenated under
Remaking our Heartland
another 200 more in 2015
35,000 households to benefit from Home
Improvement Programme yearly, up from 28,000
14 new projects under Neighbourhood Renewal
Programme to enhance living environment in HDB estates
EASE reviewed to lower age criterion and additional items
Green City
in Marina Bay in the pipeline
natural environment, heritage & charm
Source: Ministry of National Development28 / A City to
Call Home
Enhancing Transport and Connectivity
90.4 90.1 91.7 91.8
DESIRED OUTCOMES
88.8
• Good Connectivity, Quality Infrastructure
• Reliable and Convenient Transport System
2009 2010 2011 2012 2013
Daily public
90.4 transport usage
90.1 continues
91.7 to91.8
grow, with To further improve the reliability of trains, the Government
88.8
the share of people taking 24public transport
24 during
24 peak is working closely with public transport operators to
22
21 from 63%
hours rising in 2012 to 64% in 2013. replace the older parts of the Mass Rapid Transit (MRT)
infrastructure like old rail sleepers. Maintenance has
Singaporeans’ satisfaction with public transport, also been stepped up. This is starting to bear fruit. Train
however, has dipped to its lowest in five years, primarily withdrawals across all three MRT lines were reduced by
due to concerns about reliability and overcrowding of 25% or more in 2013, compared with 2012. Delays were
train services.
2009 2010 2011 2012 2013 also less frequent (see graph) – the number of train delays
2009 2010 2011 2012 2013 longer than five minutes fell by 20% in 2013 from 2012.
Public transport users less satisfied
24 24 24
21 Customer22 Satisfaction Survey for Public
Transportation System (%)
93.8
92.2
90.3
88.8 88.5
2009 2010 2011 2012 2013
2009 2010 2011 2012 2013
Source: Land Transport Authority
93.8
92.2
2.0 90.3
While delays
1.7 have
1.8 become less frequent,
88.8
1.7 disruptions
88.5
lasting more than an hour occurred on average
1.3 once
every 2.4 months in 2013, compared to once every three
months in 2012.
2009 2010 2011 2012 2013
Trains crowded but more reliable now
2009 2010 2011 2012 2013
No. of Delays more than 5 Minutes per
100,000 Train-km on MRT/LRT Network
2.0
1.7 1.8 1.7 76.2%
1.3
71.2%
79.2%
77.5%
2009 2010 2011 2012 2013
Source: Land Transport Authority
76.2%
83.8 71.2%
81.4
74.8
69.9 79.2%
78.4
78.0
77.5%
68.0
61.0
2003 2006 2009 2013
83.8
81.4You can also read