SINGAPORE Q3 2019 - REAL ESTATE TIMES - Private non-landed residential sector not 'buoyant' but steady despite looming dark clouds - Edmund Tie
←
→
Page content transcription
If your browser does not render page correctly, please read the page content below

REAL ESTATE
                                          TIMES

                                          OCTOBER 2019

SINGAPORE Q3 2019
Private non-landed residential sector not ‘buoyant’ but
steady despite looming dark clouds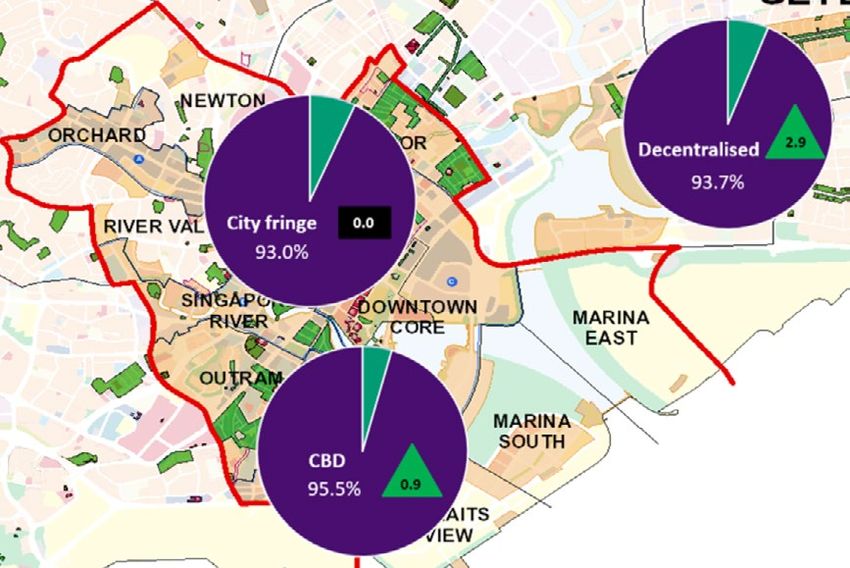
INVESTMENT

Market commentary                               Government Policies
                                                • The development charge rates for the period September 2019
Key market indicators                             to February 2020 have been revised as follows: i) Use Group A
Singapore’s gross domestic product (GDP)          (Commercial) has increased by an average of 1.7 per cent, with
in Q2 2019 slowed to 0.1 per cent year-on-        rates for about half of the 118 sectors increasing by between 3.0
year (y-o-y) down from 1.1 per cent in the        and 7.0 per cent; ii) Use Group B (Residential, non-landed) was
previous quarter. This was the lowest growth      lowered marginally by 0.3 per cent on average, with rates for 7
since Q2 2009 during the global financial         sectors decreasing by 4.0 to 7.0 per cent; and iii) other Use Groups
crisis (GFC). Wholesale and retail trade, and     remained unchanged.
manufacturing were the biggest drag on the
economy, while finance and insurance, and       • The Government announced during the National Day Rally in August
information and communications sectors            that the Greater Southern Waterfront district, which is expected to
were the best performers. Accordingly, the        be developed in the next 5-10 years, will offer more commercial,
2019 GDP growth forecast has been lowered         residential (9,000 housing units) and entertainment options.
for the second time to 0.0 to 1.0 per cent.     Investment sales

Despite the growing global economic             Total investment sales value jumped 33.8 per cent quarter-on-quarter
headwinds and trade tensions, Singapore         (q-o-q) to $8.0bn in Q3 2019 (Figure 1), with the private sector
still attracted some $8.1bn of investment       accounting for the bulk (or 76.5 per cent) of the total investment sales
commitments in manufacturing and services       value, although public investment sales value almost doubled, as more
in H1 2019 compared to $5.3bn over the          residential sites were sold under the Government Land Sales (GLS)
same period in 2018. The top investors          Programme (Table 1 and Figure 2).
continued to come from the USA and
Europe with investments in the technology,      Figure 1: Total investment sales, $bn
chemicals and data services sectors.            35
                                                                                                                                  32.3
                                                                                                                                             30.4
                                                30
                                                                   Past 3-year (2016 - 2018) annual average: $27.4bn

                                                25
                                                                   Past 5-year (2014 - 2018) annual average: $23.5bn

                                                                                                                                                    19.5
                                                20

                                                15

                                                10

                                                 5

                                                 0
                                                     2009

                                                                   2011

                                                                           2012

                                                                                       2013

                                                                                                   2014

                                                                                                               2015

                                                                                                                           2016

                                                                                                                                  2017

                                                                                                                                             2018
                                                            2010

                                                                                                                                                    2019

                                                                                  Q1          Q2          Q3          Q4
                                                                                                   Source: Various sources, EDMUND TIE Research

EDMUND TIE RESEARCH                                                                                                                      1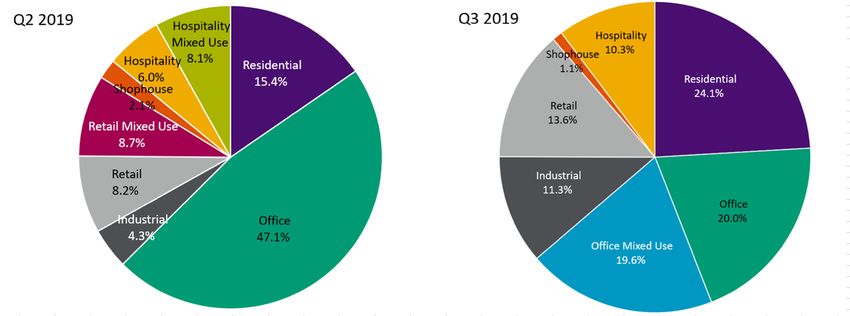
• Singapore’s 2019 GDP growth forecast           Table 1: New sales volume by market segment (Q1 and Q2 2019)
  downgraded for the second time to 0.0 to
                                                  Key investment sale type   Q2 2019 ($m)     Q3 2019 ($m)      Q-o-q change (%)
  1.0 per cent, underpinned by continued
  weakness in the manufacturing sector.           Private                       4,999         6,133 (76.5%)             +22.7
• Demand for housing loans continued to           Office                        2,827         3,180 (39.6%)             +12.5
  slowdown in June 2019, declining for the
                                                  Industrial                    138.7         909.1 (11.3%)             +555
  sixth consecutive month by 0.2 and 0.4 per
  cent month-on-month (m-o-m) and year-           Retail                        1,014         1,093 (13.6%)              +7.7
  on-year (y-o-y) respectively.
                                                  Hospitality                   844.0         823.1 (10.3%)              -2.5
• The Monetary Authority of Singapore
  (MAS) has maintained in June 2019               Residential                   48.0           42.6 (0.5%)              -11.2
  that the current cooling measures               Shophouses                    126.7          85.2 (1.1%)              -32.8
  implemented since July 2018 remain
                                                  Public (GLS)                  997.5         1,888 (23.5%)             +89.3
  appropriate.
                                                  Residential                   875.5         1,888 (23.5%)             +115.7
                                                  Industrial                    122.0               Nil         Not meaningful
                                                  Total                         5,996         8,021 (100%)              +33.8

                                                                                        Source: Various sources, EDMUND TIE Research

Figure 2: Total investment sales by asset type

                                                                                        Source: Various sources, EDMUND TIE Research

EDMUND TIE RESEARCH                                                                                                 2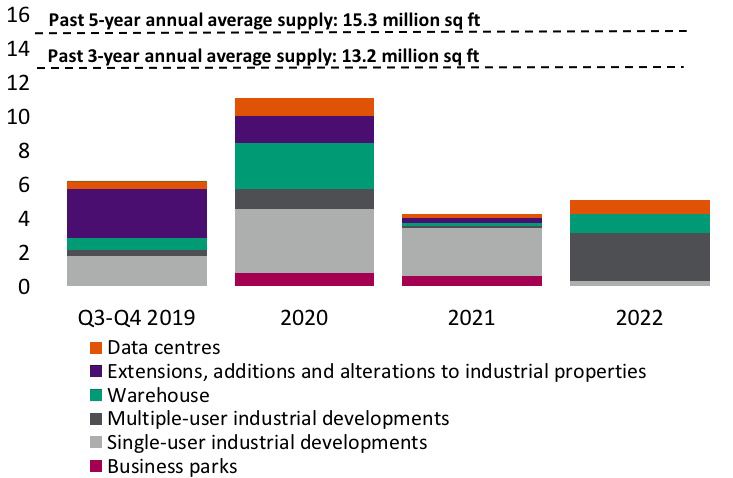
Asset class     Key trends in Q3 2019
 Office          Private investment
                 • Increased for the second consecutive quarter, underpinned by another billion-dollar transaction of DUO Tower -
                   the office and retail components were sold for $1.575bn (or $2,570 psf of net lettable area - NLA) (Table 2), while the
                   hotel component (Andaz Singapore) remained with the owner (M+S Pte Ltd). This is Gaw Capital’s second major office
                   acquisition after purchasing Robinson 77 for $710m (or $2,300 psf NLA) in January this year; but also an expansion of
                   Allianz Real Estate’s office portfolio in Singapore after buying a 20 per cent stake of Ocean Financial Centre late last year.
                 • Another notable transaction was the sale of 71 Robinson Road for $655m (or $2,756 psf NLA) to a local developer Sun
                   Venture. This fully occupied Grade A building had an initial implied yield of approximately 3.5 per cent.
 Industrial      Private investment
                 • Investment sales value more than tripled q-o-q to $909.1m, mainly attributed to the sale of two data centres for
                   $599.5m to Keppel DC REIT (related party transaction) which are considered tightly held assets.
                 • Additionally, there was a sale and leaseback transaction for a newly developed six-storey ramp up warehouse in
                   Jurong for $225m (or $206 psf gross floor area – GFA).
                 Public sales (GLS)
                 • There were no sites awarded in Q3, the last time this occurred was in Q1 2018. Although there were two bids
                   submitted for a site at Senoko Drive in July 2019, they were rejected as they were below the reserve price.
 Retail          Private investment
                 • Investment sales value rose for the third consecutive quarter by 7.7 per cent to almost $1.1bn, due to the sale of 313@
                   Somerset for $1.0bn (or $3,479 psf NLA) to a REIT initial public offering (IPO) – Lendlease Global Commercial REIT,
                   which is expected to list on 2 October 2019.
 Hospitality     Private investment
                 • Although investment sales value declined by 2.5 per cent q-o-q, there were more development sites transacted namely:
                   – Min Yuan Apartments was sold via a collective sale for $141m (or $2,613 psf ppr including an estimated development
                     charge of $19.6m). This was the first en bloc sale in 2019 since Q4 2018. The site was acquired by the Fragrance
                     Group that also owns the adjacent site at 64 Waterloo Street (former Waterloo Apartments bought in Q4 2018).
                     The group intends to amalgamate both sites for a hotel development.
                   – Darby Park Executive Suites was sold for a substantial profit of more than 70.0 per cent (or $160m) just after 10
                     months. In June 2019, the former owner obtained a Written Permission and rezoning from residential use to hotel
                     use from the URA to redevelop the site into an eight-storey hotel building,
 Residential     Private investment
                 • Following the collective sale of a small 5-unit development at Sophia View in Q2 2019, another en bloc site at Phoenix
                   Road comprising 24 apartments and 12 shops was sold for $42.6m (or $630 psf ppr after factoring in the estimated
                   differential premium). The site has a development potential of about 80 units based on an average unit size of 950 sq ft.
                 Public sales (GLS)
                 • Investment sales value doubled q-o-q to $1.9bn, as more sites with higher land prices were sold.
                 • Four sites were awarded in Q3 2019 vis-à-vis just two in Q2 (Table 2), notable transactions included:
                   – The largest transaction was for the Tan Quee Lan Street site sold for $800.2m (or $1,535 psf ppr) to GuocoLand and
                      Hong Leong JV. This was about 5.3 per cent higher than the Middle Road site which was sold for $1,458 psf pps in
                      March this year to Wing Tai Holdings. The site strategically aligns well with the Midtown Bay project across the road
                      currently developed by GuocoLand.
                   – In contrast to the lesser number of bids received for the other three sites, the smaller site at one-north Gateway received
                      the most bids with nine. It was awarded to a Hong Leong Holdings and Mitsui Fudosan Co JV for $155.7m (or $1,001 psf ppr).
                      This site drew more bids likely due to its strategic location amid the growing one-north office and business park
                      precinct which recently attracted high profile companies such as Grab and Razer setting up their headquarters. In
                      addition, the development yield of some 165 units and limited upcoming supply were considered favourable.

EDMUND TIE RESEARCH                                                                                                               3
Table 2: Key private investment sale transactions in Q3 2019 (above $100m)
Tenure /
Development name/location Purchase price Purchaser/investor type
(remaining tenure)
Office/Office Mixed Use
DUO Tower and Galleria 99 years $1.575bn Allianz Real Estate and Gaw Capital Partners
(City fringe) (91 years) ($2,570 psf NLA) (foreign institutional investor)
99 years $655.0m
71 Robinson Road (CBD) Sun Venture (local property company)
(74 years) ($2,756 psf NLA)
99 years $530.0m
Plus, 20 Cecil St (CBD) CapitaLand (local listed property company)
(69 years) ($2,320 psf strata area)
99 years $210.0m Arch Capital Management (foreign institutional
Anson House (CBD)
(76 years) ($2,435 psf NLA) investor)
3 floors at Woods Square 99 years $131.7m Far East Management (local property company –
(Decentralised area) (93 years) ($1,800 psf strata area) related party transaction)
Industrial
Keppel DC Singapore 4 30 +30 years (1 year, $392.3m
(99% stake) with renewal option) ($4,687 psf NLA) Keppel DC REIT (local listed REIT) – related party
$207.2m transaction
1-Net North DC 70 years (17 years)
($969 psf NLA)
$225.0m ESR REIT (local listed REIT) JV – related party
48 Pandan Road 24 years
($206 psf GFA) transaction
Retail/retail mixed-use
313 @ Somerset $1.003bn Keppel DC REIT (local listed REIT) – related party
99 years (85 years)
(Orchard/Scotts Road) ($3,479 psf NLA) transaction
Hospitality/hospitality mixed-use
AMTD Group and Dorsett Hospitality International
Oakwood Premier 99 years $287.1m
(foreign institutional investor and property
OUE Singapore (46 years) ($1.1m per key)
company)
Trade Dragon Global Ltd and Datapulse Technology
$235.0m
Bay Hotel Freehold (foreign institutional investor and local listed
($0.7m per key)
property company)
99 years $160.0m
Darby Park Executive Suites Foreign private entity
(72 years) ($2.1m per key)
$141.0m
Min Yuan Apartments 999 years Fragrance Group (local listed property company)
($2,613 psf ppr)
Source: Various sources, EDMUND TIE Research
EDMUND TIE RESEARCH 4Table 3: Public GLS sales in Q3 2019 (above $100m)
Development name / Site area Tenure Purchase price /
Plot ratio Purchaser/investor type
market segment* (sq ft) (years) ($ psf ppr)
Residential
GuocoLand & Hong Leong Holdings
Tan Quee Lan Street (CCR) 124,116 4.2 99 $800.2m
(local listed and private property companies)
Clementi Avenue 1 (OCR) 178,064 3.5 99 ($1,535) UOL & UIC (local listed property companies)
Hao Yuan Investment
Bernam Street (CCR) 41,400 7.3 99 $491.3m
(private local property developer)
Hong Leong & Mitsui Fudosan
one-north Gateway (RCR) 62,201 2.5 99 ($788)
(private and foreign listed property companies)
* CCR = Core central region, RCR = rest of central region, OCR = outside central region Source: URA, EDMUND TIE Research
Outlook
Despite growing global tensions and uncertainties, a slowing local economy and business confidence falling to near two-
year low in Q4 2019 (according to the latest Business Optimism Index), total investment sales value jumped 33.8 per cent
q-o-q with heightened sales activity for commercial assets by local and foreign institutional investors including REITs.
• Office sector continues to stand out with another major transaction involving the DUO Tower, underpinning investors’
confidence and positive outlook for the sector.
• The related party sale of two data centres to Keppel DC REIT in a tightly held market suggests the growing interests and
demand of data centres as an alternate asset class and Singapore’s status as a gateway and regional hub.
• Residential en bloc sales remained subdued and limited to smaller developments with the bulk of land sales coming
from GLS sites, indicating that developers continue to be cautious amid the growing number of new projects launches
and slowing economy.
With total investment sales value already exceeding our earlier lower bound estimates of $18bn, the forecast for the
remaining Q4 is likely to increase to range between $3bn and $5bn, bringing the total investment sales value in 2019 to
$22bn to $24bn.
EDMUND TIE RESEARCH 5OFFICE
Market commentary Figure 3: Office occupancy rates in Q3 2019
Key market indicators
• The finance and insurance, information
and communications, and business
services sectors continued to contribute
positively to Singapore’s GDP in H1 2019.
Investment market
• Total investment sales value continued
to grow by 12.5 per cent q-o-q with the
sale of DUO Tower and 71 Robinson Road
and Anson House (Tables 1 and 2). These
increased and sustained sale activities
since the beginning of this year indicated
confidence and optimism for the sector
despite global headwinds and a slowing
local economy.
Source: URA, OneMap, EDMUND TIE Research
Office demand and occupancy rates
• Islandwide net absorption increased nearly four-fold to 851,000 sq ft in Q3 2019 and occupancy rate improved 1.2
percentage points (pp) q-o-q to 94.4 per cent.
• Occupancy rates in the decentralised area improved the most, mainly driven by new tenants progressively moving to
their new office premises in Paya Lebar Quarter (PLQ), followed by the CBD and City fringe which remain unchanged
q-o-q (Figure 3).
• Co-working and technology firms continued to be the key occupiers of CBD office space with several international
companies setting up their regional offices in Singapore (Table 4).
Table 4: Key tenant movements in Q3 2019
Building Location Tenant Sector Comments (space occupied)
Marina Bay Financial Marina Bay New office to service South east Asia
Pinterest Technology
Centre Tower 1 (CBD) (SEA) and India
Hong Leong Building Raffles Place Epiq Professional services Relocation
MYP Centre (CBD) WeWork Co-working New location (100,000 sq ft)
Crown at Robinson LiquidX Technology Expansion of Asian HQ office
Shenton Way/
71 Robinson Road Robinson Road/ Digital Reasoning Technology New APAC office
Maxwell Chambers Suites Tanjong Pagar INSOL International Professional services New Asia hub office
(CBD)
Twenty Anson One&Co Co-working New location (13,000 sq ft)
WeWork Co-working New location (70,000 sq ft)
Funan
City fringe Trehaus Co-working New location (12,000 sq ft)
Suntec Tower 1 PCCW Solutions Technology Expansion of SEA HQ (12,000 sq ft)
Vision Exchange GATE Energy Oil & gas New location
Decentralised
PSA Building GeoSpock Technology New Asian HQ office
areas
PLQ Tower 1 Spaces Co-working New location (52,000 sq ft)
Source: Various sources, EDMUND TIE Research
EDMUND TIE RESEARCH 6Rental rates
With tightening vacancy rates and limited new supply, the average gross monthly rents rose across most of the sub-
locations by between 0.0 and 1.5 per cent q-o-q (Table 5).
Table 5: Average monthly gross office rents ($ per sq ft)
Location Grade Q2 2019 Q3 2019^ Q-o-q change (%)
Marina Bay A+ 11.10-13.10 11.25-13.30 1.5
Raffles Place A 9.35-11.35 9.40-11.45 1.0
CBD A+ 9.95-11.95 10.10-12.10 1.5
Shenton Way/ Robinson Road/ Tanjong Pagar A 8.05-10.05 8.10-10.10 0.5
B 6.55-8.55 6.60-8.65 1.0
Marina Centre A 8.90-10.90 8.90-10.90 0.0
A 9.70-11.70 9.80-11.80 1.0
City fringe Beach Road/North Bridge Road
B 6.50-8.00 6.55-8.05 0.5
Orchard Road * 8.55-10.55 8.55-10.55 0.0
one-north/Buona Vista/Harbourfront * 6.50-8.00 6.55-8.05 0.5
Decentralised areas Tampines Regional Centre * 5.10-5.60 5.10-5.60 0.0
Jurong Gateway * 5.50-6.80 5.60-6.90 1.0
* Ungraded office space Source: EDMUND TIE Research
^ Estimated forecasts only
EDMUND TIE RESEARCH 7Supply pipeline Figure 4: CBD office development pipeline, million sq ft
• The total supply pipeline over the next 4 2.4
Past 3-year annual average net supply: 2.1m sq ft
years to 2023 is approximately 4.6m sq ft 2.0 Past 5-year annual average net supply: 1.7m sq ft
(or 1.1m sq ft per annum). This is much
lower than the 3- and 5-year average 1.6
net supply of 2.1m sq ft and 1.7m sq ft 1.2
respectively (Figure 4).
0.8
• 9 Penang Road, 139 Cecil Street and the 0.4
renovation works at China Square Central
are expected to be completed by end 2019. 0.0
Q3-Q4 2019 2020 2021 2022 2023
All these buildings have been fully pre-
Marina Bay
leased, except for China Square Central. Raffles Place
Shenton Way/Robinson Rd/Tanjong Pagar
City fringe
Decentralised areas
Source: URA, EDMUND TIE Research
Outlook
Underpinned by tightening vacancies and increased investment sales activity, the office market continues to outperform the
other asset classes despite weakening market conditions. This appears contrary to the past 10 years (post GFC in 2009) when
the office market was relatively correlated to GDP growth. While average rents and capital values remain below pre-GFC
levels, the fundamental basis for future high single- to double-digit rental growth appears ‘unsustainable’ as the underlying
driver for current rental growth is largely due to the limited existing Grade A stock and future supply pipeline in the CBD.
Hence, CBD rental rates are expected to increase by 5.0 to 10.0 per cent this year with 2020 levels likely to moderate.
EDMUND TIE RESEARCH 8INDUSTRIAL
Market commentary
Key market indicators
The non-oil domestic exports (NODX) and the Purchasing Managers’ Index (PMI) continued to decline in Q3 2019:
Singapore’s NODX and PMI
Key economic indicators June 2019 July 2019 August 2019 Key trends
NODX -17.3% -11.4% -8.9% • Decline of NODX appears to be easing, bolstered by higher gold exports.
Electronics -31.9% -24.2% -25.9% • Electronic NODX dropped further in August weighed down by
integrated circuits (-32.1 per cent), PCs (-28.6 per cent), and disk
media products (-11.9 per cent).
Non-electronics -12.6% -6.7% -2.2% • Non-electronics NODX continued to ease in August 2019 with
pharmaceuticals (-23.6 per cent), petrochemicals (-20.8 per cent)
and primary chemicals (-29.3 per cent) as the main drags.
PMI* 49.6 49.8 49.9 • Both PMI and electronics PMI have been inching upwards after
hitting a near 3-year low in June 2019, although the readings still
indicate contraction.
Electronics 49.2 49.3 49.4 • The slight uptick was due to higher new orders and factory
output with the contraction in inventory slowing. However, the
employment index continued to fall indicating cautious hiring plans.
* Reading above 50 indicates an expansion, while below 50 indicates a contraction. Source: MTI, Enterprise Singapore, SIPMM, EDMUND TIE Research
Investment market Figure 5: Occupancy rates of private industrial space by type
• With no GLS site awarded, private 100%
investment sales value jumped by more 95%
than five times in Q3 2019 mainly due to
90%
the sale of two data centres and a ramp-
up warehouse in Jurong (Tables 1 and 2). 85%
80%
Private demand, occupancy and supply
75%
(Q2 2019)
70%
• Islandwide net absorption continued to
Q2 2010
Q2 2011
Q2 2012
Q2 2013
Q2 2014
Q2 2016
Q2 2017
Q2 2018
Q2 2019
Q2 2015
weaken by 8.5 per cent q-o-q to some
1.6m sq ft, while net supply more than
doubled to 1.4m sq ft in Q2 2019.
Multiple-user factory space Single-user factory space
• Occupancy rates were relatively steady Business park space Warehouse space
for all industrial types with marginal Source: JTC, EDMUND TIE Research
improvements in multi-user factories and
business park (Figure 5).
EDMUND TIE RESEARCH 9• Notable tenant movements/expansion in Table 6: Average monthly gross rents (islandwide)
Q3 included:
Q2 2019 Q3 2019*
Industrial type Q-o-q change (%)
($ per sq ft) ($ per sq ft)
– Google Asia Pacific taking up 344,100
sq ft, in Alexandra Technopark. First-storey:
1.73-1.98 -0.5
Multiple-user 1.74-1.99
– AIMS APAC REIT recently secured a US- factory Upper-storey:
1.38 to 1.58 -0.75
based global medical device company 1.39-1.59
as a master tenant for the four-storey Warehouse/logistics 1.53-1.68 1.51-1.66 -0.1
ramp-up facility at 3 Tuas Avenue 2
Hi-tech industrial 2.85-3.05 2.85-3.05 0.0
(268,000 sq ft GFA).
City fringe:
4.35-4.85 1.0
– Micron Technology’s new and expanded 4.30-4.80
Business park
fabrication plant in Woodlands was Non-city fringe:
3.50-3.80 0.0
opened in August 2019. 3.50-3.80
• Net supply rose led by single-user * Estimated forecasts only Source: JTC, EDMUND TIE Research
factories with the completion of the STT
Defu 2 data centre (DC) for ST Telemedia
Global Data Centres (STT GDC) and a Figure 6: Private monthly industrial gross rents by type
prefabricated construction components
6
factory. In contrast, net supply for multi-
user factories and warehouses fell, while 5
business parks remained unchanged.
4
Rental rates
3
• Rental rates are largely expected
to trend downwards on the back of 2
weakening manufacturing and wholesale
trade sectors, although the easing of 1
Q3 2010
Q3 2011
Q3 2012
Q3 2013
Q3 2015
Q3 2016
Q3 2017
Q3 2018
Q3 2019
Q3 2014
NODX and PMI may indicate a possible
‘bottoming out’. In addition, the limited
supply pipeline may provide some level
of support to rental levels (Table 6 and First-storey Upper-storey Hi-tech Business park(city fringe)
Figure 6). * Estimated forecasts only Source: JTC, EDMUND TIE Research
• On the other hand, rents for city fringe
business parks rose by 1.0 per cent q-o-q
likely due to the limited availability of
suitable existing space and new supply.
EDMUND TIE RESEARCH 10Supply pipeline Figure 7: Private industrial development pipeline (with planning approvals
and GLS sites which are pending approvals), million sq ft
• From now to 2022, there are
approximately 26.7m sq ft NLA (or 7.6m
sq ft per annum) in the supply pipeline.
This is about 40 to 50 per cent lower than
the past 3- and 5-year averages (Figure 7).
• With the completion of STT Defu 2 DC
in Q3, there are still seven data centres
in the pipeline totalling 2.6m sq ft. DC
providers such as Digital Realty Trust
have announced plans to develop
its third DC, while Google and STT
GDC are constructing their third and
seventh DCs in Singapore respectively.
This strong growth of DCs is to meet
the rising demand for cloud business Source: JTC, EDMUND TIE Research
and enterprises undergoing digital
transformation in Singapore.
• Although there are six business park
developments in the pipeline of circa
1.4m sq ft, most of these business park
developments are either owner-occupied
or have been largely pre-committed. The
largest development of approximately
400,000 sq ft is Surbana Jurong’s new
global HQ and Campus at the Jurong
Innovation District.
Outlook
As global headwinds and uncertainties intensify, the industrial sector is expected to remain subdued and under some
pressure with no quick recovery expected, especially for the manufacturing and trade subsectors. This will likely have
broad flow-on impacts on most of the industrial types and to a lesser extent, DCs and business parks.
However, the Government stands ready to support the economy in the event of a downturn and has also reduced the
industrial land supply on the GLS Programme. This, combined with a reduced supply pipeline over the next three years,
will provide some support to occupancy and rental rates. Accordingly, rents for multiple-user factories and warehouses
are expected to face some downward pressure of between -3.0 and 0.0 per cent, while the rental growth for business park
space and hi-tech industrial space are likely to remain relatively positive, ranging between 2.0 and 5.0 per cent in 2019.
EDMUND TIE RESEARCH 11RETAIL
Market commentary Figure 8: Retail Sales Index (ex MV) and F&B Index (up till July 2019)
Key market indicators At current prices (2017 = 100)
120
• Retail sales index excluding motor vehicles
(ex MV) fell for the sixth consecutive
110
month, down 2.4 per cent y-o-y in July 104.3
2019 (Figure 8). Every subsector fell
100
except for medical goods & toiletries
and supermarkets, with the main drags 96.5
90
coming from furniture and household
equipment (-8.3 per cent), computer and
80
technology (-7.7 per cent) and watches
2009
2010
2011
2012
2013
2014
2015
2016
2017
2018
Jan-2019
Jul-2019
Apr-2019
May-2019
Jun-2019
Mar-2019
Feb-2019
and jewellery (-6.2 per cent).
• In contrast, the Food and Beverage
(F&B) Services Index expanded for four Retail sales index (ex MV) F&B services index
consecutive months, up 3.2 per cent y-o-y Source: Department of Statistics Singapore
in July 2019 with all subsectors growing
led by fast food outlets (+5.2 per cent).
• Additionally, tourism receipts for
shopping and F&B in Q1 2019 fell 7.0
per cent y-o-y. However, Mainland
Chinese visitors continued to be the
highest spenders with almost half of total
spending on shopping.
Investment market
• The total investment transaction value grew by 7.7 per cent mainly due to the sale of 313@Somerset for just over
$1.0bn to Lendlease Global Commercial REIT which is expected to be listed on 2 October 2019 (Tables 1 and 2).
Private demand, occupancy and supply
• Net absorption and supply rose significantly largely underpinned by the opening of Jewel Changi Airport and Funan in
Q2 2019 and PLQ Mall in Q3 2019. Totalling more than 1.0m sq ft of retail space, these new malls were more than 90
per cent pre-leased. Accordingly, occupancy rates increased by 1.1 percentage points q-o-q to 91.2 per cent
• Despite the improved occupancy rates, the retail environment remains challenging with further closure and down-
sizing of departmental stores and bookstores. Conversely, F&B appears to be ‘bucking the trend’ and continues to play
an increasingly important component as part of a mall’s retail mix.
EDMUND TIE RESEARCH 12Orchard/Scotts Road (OSR) Other City Areas (OCA) Suburban Areas (SA)
• Net absorption increased from • Net absorption reversed from • Net absorption jumped from
12,000 sq ft to 36,000 sq ft in -16,000 sq ft in Q1 to 382,000 sq 9,000 sq ft to 469,000 sq ft in Q2
Q2 2019. ft in Q2 2019 with the opening of 2019 with the opening of Jewel
Funan on 28 June 2019. Changi on 17 April 2019.
• Occupancy rate inched up 0.4 pp
q-o-q to 94.3 per cent in Q2. • Occupancy fell marginally by 0.1 • Occupancy rate improved 2.0 pp
pp q-o-q to 90.5 per cent in Q2. q-o-q to 90.7 per cent.
• There were a few notable
closures at Centrepoint including • Some notable new tenants in Q3 • PLQ mall started trading on 30
Metro’s flagship store, Times 2019 included: August 2019 with the main retail
Bookstores and TianPo Jewellery. mix by tenants as follows: F&B
– Man Man Unagi (F&B),
However, Decathlon will replace (44.0 per cent), beauty & health
Tendon Kohaku (F&B) in Clarke
Metro as the anchor tenant and (18.0 per cent), fashion (16.0 per
Quay Central
is expected to open in H1 2020. cent) with the anchor tenants
– American dessert shop Beverly being Shaw Theatres (leisure),
• Other new F&B outlets in Q3
Hills Cheesecake (F&B) in FairPrice Finest (supermarket)
2019 included: Japanese Emma
Raffles City and KopiTime (F&B).
dessert opening its first overseas
outlet at Plaza Singapura, Los – Japanese cafe 108 Matcha Saro • Other notable openings in Q3
Angeles ice cream shop, Little (F&B), Taiwanese restaurant The included Apple’s (IT) second store
Damage, debuting at Wheelock Salted Plum(F&B) in Suntec City at Jewel Changi Airport, Fairprice
Place, and Hong Kong café Tsui Xtra (90,000 sq ft - hypermarket)
Wah with its second outlet at – JD Sports (Sports) and Taobao at VivoCity replacing Giant and
The Heeren. Store by Virmall (6,000 sq ft - Chinese tea chain Heytea (F&B)
department store and value at Westgate.
store) in Funan
– Japanese Meidi-Ya (supermarket)
in Great World City
– The North Face (footwear and
apparel) at The Shoppes at
Marina Bay Sands.
EDMUND TIE RESEARCH 13Rental rates Table 7: Average monthly gross rents in Q3 2019 ($ per sq ft)
Accordingly, rental rates are expected to Location Q2 2019 Q3 2019^ Q-o-q change (%)
remain largely flat with marginal rises in Q3
First storey:
(Table 7). 34.17-39.20 0.5
34.00-39.00
OSR
Upper storey:
13.95-18.00 0.5
13.90-17.90
First storey:
16.10-21.10 0.0
16.10-21.10
OCA
Upper storey:
8.05-12.05 0.5
8.00-12.00
First storey:
25.30-31.30 0.0
25.30-31.30
SA (prime malls)
Upper storey:
15.00-20.00 0.0
15.00-20.00
^ Estimated forecasts only Source: URA, EDMUND TIE Research
Supply pipeline Figure 9: Retail development pipeline, million sq ft
The supply pipeline from now until 2022 is 1.2
Past 5-year annual average supply: 1.2m sq ft
projected to be limited comprising some
692,000 sq ft NLA (Figure 9) with the China Past 3-year annual average supply: 1.0m sq ft
Square Central retail podium (80,000 sq ft)
0.8
expected to be completed by Q4 2019.
0.4
0.2
0.2
0.1
0.1
0.0
Q4 2019 2020 2021 2022
Orchard/Scotts Road Other City Areas Suburban Areas
Source: URA, EDMUND TIE Research
Outlook
With growing economic headwinds and weak retail sales, islandwide rental rates are projected to remain subdued and
mixed ranging from -2.0 to 1.0 per cent in 2019, although the limited supply pipeline from 2020 onwards will provide some
support to rents and occupancy.
In addition, the continued investment sales activity since early 2019 suggests investors’ confidence in the sector, although the
landlords and retailers’ ability to transform and adapt to the changing retail landscape is increasingly becoming more important.
EDMUND TIE RESEARCH 14RESIDENTIAL
Market commentary
Key market indicators Investment market
• Latest Urban Redevelopment Authority • Investment sales value doubled on a q-o-q basis in Q3 as more GLS
(URA) flash estimates indicate that private sites were sold compared to the previous quarter (Tables 1 and 3)
non-landed prices rose by 1.7 per cent and accounted for the bulk of land sales.
q-o-q vis-à-vis 2.0 per cent in the previous
quarter. Prices of non-landed properties • In contrast, private en bloc site sales remain remained subdued
in all market segments grew, led by the and limited to smaller developments as developers remain cautious
core central region (CCR) with 2.9 per amid the growing number of existing and upcoming new projects
cent q-o-q, followed by rest of central launches as well as current economic uncertainties (Tables 1 and 2).
region (RCR) with 1.6 per cent and outside
Private non-landed sales volume, prices, completed supply and
central region (OCR) with 0.7 per cent.
rents (excluding executive condominiums - ECs)
• Based on advanced estimates, the • New sales volume is expected to outweigh resale volume (includes
seasonally adjusted unemployment rate both resale and sub sale) for the second consecutive quarter, as
for residents was up slightly by 0.1 pp to the number of units from new projects launched in Q3 jumped by
3.1 per cent q-o-q in Q2 2019. However, about 67.0 per cent q-o-q to approximately 4,500 units in Q2. This
retrenchments have not increased but big increase was mainly attributed to launch of three major new
remained low at 2,300. projects: One Pearl Bank (774 units), Parc Clematis (1,468 units) and
Avenue South Residences (1,074 units) (Table 8).
• Housing loans fell for the 8th straight
month by 1.1 per cent y-o-y, as demand • As such, new sales in Q3 are projected to surge by more than 44 per
for housing loans continue to weaken cent q-o-q to circa 3,100 units (Figure 10) led by RCR and OCR due
since the latest cooling measures were to the launches of the three major new projects mentioned above.
introduced in July 2018.
Figure 10: Private non-landed home sales volume (excluding ECs) and URA
price index
7,000 155
6,000 150
5,000
53% 145
58% 65%
4,000 45% 37%
43%
67% 140
48% 53% 43% 69% 49%
3,000 40%
50% 49%
48% 135
2,000 49%
63%
57% 47% 42% 55%
1,000 60% 52% 47% 57% 35% 51% 130
52% 51% 33% 31% 50% 51%
0 125
Q3 2015
Q3 2016
Q3 2017
Q3 2018
Q3 2019*
Resale/Sub Sale (LHS) New Sale (LHS)
URA non-landed price index (RHS)
* Forecast of new sale and resale volumes for Q3 2019 Source: URA, EDMUND TIE Research
EDMUND TIE RESEARCH 15• Conversely, resale volume is likely to Figure 11: Private non-landed completions (excluding ECs) and URA rental index
decline some 9.0 per cent q-o-q to about 10,000 115
1,800 units, as buyers continued to prefer
new units over older resale units, with a 8,000
110
wide range of projects to choose from. 6,000
105
• Accordingly, total sales volume in Q3 is 4,000
projected to reach approximately 5,000
100
units, which is about 20 per cent more 2,000
than the previous quarter and a record
0 95
high since Q3 2018.
Q2 2015
Q3 2015
Q4 2015
Q1 2016
Q2 2016
Q3 2016
Q4 2016
Q1 2017
Q2 2017
Q3 2017
Q4 2017
Q1 2018
Q2 2018
Q3 2018
Q4 2018
Q1 2019
Q2 2019
H2 2019F*
• With the number of non-landed unit
completions projected to average
approximately 5,500 units per annum
Completed units (LHS) URA non-landed rental index (RHS)
until 2020, which is significantly below
* Forecast of rental index for Q3 2019 Source: URA, EDMUND TIE Research
the 3- and 5- year averages of 14,900
and 16,500 units respectively, the rental
market is expected to remain stable with
some positive upside considering that
the vacancy rate had remained relatively
steady over the past two quarters. As
such, islandwide rents are forecasted to
moderate slightly to between 0.5 and 1.0
per cent q-o-q growth in Q3, versus 1.4
per cent in Q2 2019 (Figure 11).
EDMUND TIE RESEARCH 16New non-landed project launches
• Bulk of the launches were in July and September, as developers typically do not launch new projects during the Hungry
Ghost Month in August.
• The majority of new launches were in RCR, with six projects totalling 2,615 units, up by more than 50.0 per cent from Q2.
• Initial sell-down rates of the new projects launched ranged from 2.6 to 30.4 per cent with One Pearl Bank achieving the
highest sell-down rate, followed closely by Avenue South (Table 8). Both projects were considered attractively priced
based on both projects’ city fringe location, good access to amenities and transport, as well as the overall product
quality, notably One Pearl Bank’s renovation-zero concept which is a benefit for investors.
Table 8: Non-landed private residential launches (excluding ECs) in Q3 2019 (projects >100 units)
District Launch Initial Indicative
Tenure Total
Development Developer (market month in sell-down average price
(years) units
segment) 2019 rate* ($ psf)
One Pearl Bank CapitaLand 3 (RCR) 99 774 July 30.4% $2,400
Avenue South
UOL, UIC & Kheng Leong Co 3 (RCR) 99 1,074 September 30.1% $2,000
Residence
Parc Clematis SingHaiyi Group 5 (OCR) 99 1,468 End August 27.7% $1,550
Roxy-Pacific Hldgs & Tong
View at Kismis 21 (RCR) 99 186 July 25.3% $1,700
Eng Group
Meyer Mansion GuocoLand 15 (RCR) Freehold 200 September 13.0% $2,700
Haus on Handy CDL 9 (CCR) 99 188 July 12.2% $2,850
Uptown@Farrer Low Keng Huat 8 (RCR) 99 116 September 11.2% $1,850
TA Corp, Hock Lian Seng
The Antares 14 (RCR) 99 265 September 6.8% $1,760
Hldgs & Keong Hong Hldgs
SC Global, New World Dev &
Cuscaden Reserve 10 (CCR) 99 192 September 2.6% $3,392
Far East Consortium
2 smaller projects with less than 100 units 71
Total units 4,534
* Estimate based on URA caveats as at 1 October 2019 Source: URA, EDMUND TIE Research
EDMUND TIE RESEARCH 17Outlook Since the start of 2019, approximately 41 new projects comprising more 12,000 units have been launched with an estimated average sell-down rate of 27.0 per as at Q3. An additional 2,500 to 3,500 units is anticipated to be launched in the remaining quarter. With total new sales volume over the past three quarters likely to exceed 7,000 units, new sales are expected to be within our earlier forecast of 8,000 to 10,000 units for 2019. Although the rise of the price index for two consecutive quarters appears to be ‘diverging’ from economic fundamentals, this does not necessarily imply that the market is ‘buoyant’ and / or developers are profiteering. To put things in perspective, the following factors should be considered as well: • New unit prices tend to be higher than resale units, especially after factoring the higher land prices paid by developers during the en bloc fever. Consequently, the higher proportion of new sale volume vis-à-vis resale would result in higher prices, all else being equal. Additionally, our analysis shows that land cost as a percentage of average selling price has been trending upwards, which means that developers’ margins are likely compressing. • The estimated average sell-down rate for the 41 new projects launched since the beginning of this year was approximately 27.0 per cent. In comparison, the sell-down rate of new projects launched 12 months prior to the cooling measures in July 2018 were averaging some 47.0 per cent. Furthermore, the number of new launches and units were substantially lower than the first three quarters of this year. Hence, this does not suggest that the market is ‘buoyant’. Accordingly, although overall unit prices are forecasted to rise by between 2.0 to 4.0 per cent this year, barring any economic shocks. EDMUND TIE RESEARCH 18
CONTACTS                                    Ong Choon Fah
                                            Chief Executive Officer
                                            +65 6393 2318
                                            choonfah.ong@etcsea.com

PROFESSIONAL SERVICES
Valuation Advisory                          Property Tax Advisory &                      Hospitality                                  Property Management
Poh Kwee Eng                                Statutory Valuation                          Nicholas Cheng                               Kwok Sai Kuai
Executive Director                          Ng Poh Chue                                  Executive Director                           Executive Director
Regional Head of                            Executive Director                           +65 6393 2317                                Regional Head of
Valuation Advisory                          +65 6393 2515                                nicholas.cheng@etcsea.com                    Property Management
+65 6393 2312                               pohchue.ng@etcsea.com                                                                     +65 6417 9229
kweeeng.poh@etcsea.com                                                                   Heng Hua Thong                               saikuai.kwok@etcsea.com
                                                                                         Senior Advisor
Nicholas Cheng                              Research & Consulting                        +65 6393 2398                                Paul Wong
Executive Director                                                                       huathong.heng@etcsea.com                     Senior Director
                                            Ong Choon Fah
+65 6393 2317                                                                                                                         +65 6417 9225
                                            Chief Executive Officer                      Tay Hock Soon
nicholas.cheng@etcsea.com                                                                                                             paul.wong@etcsea.com
                                            +65 6393 2318                                Senior Director
                                            choonfah.ong@etcsea.com                      +65 6887 0088
                                                                                         tayhs@treetops.com.sg

AGENCY SERVICES                                                                                                                       REGIONAL OFFICES
Investment Advisory                         Auction & Sales                              Business Space & Retail                      Malaysia
Ong Choon Fah                               Nicholas Cheng                               Chua Wei Lin                                 Eddy Wong
Chief Executive Officer                     Executive Director                           Executive Director                           Managing Director
+65 6393 2318                               +65 6393 2317                                Regional Head of                             +603 2024 6380
choonfah.ong@etcsea.com                     nicholas.cheng@etcsea.com                    Business Space                               eddy.wong@ntl.my
                                                                                         +65 6393 2326
Edmund Tie                                  Joy Tan                                      weilin.chua@etcsea.com
Senior Advisor                              Senior Director
+65 6393 2386                               +65 6393 2505
edmund.tie@etcsea.com                       joy.tan@etcsea.com                           China Desk                                   Thailand
Yam Kah Heng                                                                             Yam Kah Heng                                 Ong Choon Fah
Senior Advisor                              Residential                                  Senior Advisor                               Chief Executive Officer
+65 6393 2368                                                                            +65 6393 2368                                +65 6393 2318
kahheng.yam@etcsea.com                      Margaret Thean                               kahheng.yam@etcsea.com                       choonfah.ong@etcsea.com
                                            Executive Director
Heng Hua Thong                              Regional Head of Residential                 Heng Hua Thong                               Punnee Sritanyalucksana
Senior Advisor                              +65 6393 2383                                Senior Advisor                               Chief Operating Officer
+65 6393 2398                               margaret.thean@etcsea.com                    +65 6393 2398                                +66 2257 0499 ext 101
huathong.heng@etcsea.com                                                                 huathong.heng@etcsea.com                     punnee.s@etcthailand.co.th
                                            Karen Ong
Swee Shou Fern                              Senior Director                              Tan Chun Ming
Executive Director                          +65 6393 2366                                Executive Director
+65 6393 2523                               karen.ong@etcsea.com                         +65 6393 2360
shoufern.swee@etcsea.com                                                                 chunming.tan@etcsea.com
Tan Chun Ming
Executive Director
Regional Investment Advisory
+65 6393 2360
chunming.tan@etcsea.com

  Editor:                                      Authors:

  Saleha Yusoff                                Darren Teo                                Leong Kin Mun                                Isabelle Seto
  Executive Director                           Associate Director                        Assistant Manager                            Senior Research Analyst
  Regional Head of                             Research                                  Research                                     Research
  Research & Consulting                        +65 6393 2329                             +65 6393 2548                                +65 6393 2382
  +603 2161 7228 ext 302                       darren.teo@etcsea.com                     kinmun.leong@etcsea.com                      isabelle.seto@etcsea.com
  saleha.yusoff@etcsea.com

Disclaimer: The information contained in this document and all accompanying presentations (the “Materials”) are approximates only, is subject to change
without prior notice, and is provided solely for general information purposes only. While all reasonable skill and care has been taken in the production of
the Materials, Edmund Tie & Company (the “Company”) make no representations or warranties, express or implied, regarding the completeness, accuracy,
correctness, reliability, suitability, or availability of the Materials, and the Company is under no obligation to subsequently correct it. You should not rely on the
Materials as a basis for making any legal, business, or any other decisions. Where you rely on the Materials, you do so at your own risk and shall hold the Company,
its employees, subsidiaries, related corporations, associates, and affiliates harmless to you to and any third parties to the fullest extent permitted by law for any losses,
damages, or harm arising directly or indirectly from your reliance on the Materials, including any liability arising out of or in connection with any fault or negligence. Any
disclosure, use, copying, dissemination, or circulation of the Materials is strictly prohibited, unless you have obtained prior consent from the Company, and have credited
the Company for the Materials.                                                                                                                © Edmund Tie & Company 2019

Edmund Tie & Company (SEA) Pte Ltd
5 Shenton Way, #13-05 UIC Building, Singapore 068808. | www.etcse.com | T. +65 6293 3228 | F. +65 6298 9328 | mail.sg@etcsea.com
You can also read