Small mammal glucocorticoid concentrations vary with forest fragment size, trap type, and mammal taxa in the Interior Atlantic Forest - Nature
←
→
Page content transcription
If your browser does not render page correctly, please read the page content below
www.nature.com/scientificreports
OPEN Small mammal glucocorticoid
concentrations vary with forest
fragment size, trap type,
and mammal taxa in the Interior
Atlantic Forest
Sarah A. Boyle1*, Noé U. de la Sancha2,3, Pastor Pérez4 & David Kabelik5
Species that live in degraded habitats often show signs of physiological stress. Glucocorticoid
hormones (e.g., corticosterone and cortisol) are often assessed as a proxy of the extent of
physiological stress an animal has experienced. Our goal was to quantify glucocorticoids in free-
ranging small mammals in fragments of Interior Atlantic Forest. We extracted glucocorticoids from
fur samples of 106 small mammals (rodent genera Akodon and Oligoryzomys, and marsupial genera
Gracilinanus and Marmosa) from six forest fragments (2–1200 ha) in the Reserva Natural Tapytá,
Caazapá Department, Paraguay. To our knowledge, this is the first publication of corticosterone and
cortisol levels for three of the four sampled genera (Akodon, Oligoryzomys, and Marmosa) in this forest
system. We discovered three notable results. First, as predicted, glucocorticoid levels were higher
in individuals living withing small forest fragments. Second, animals captured live using restraint
trapping methods (Sherman traps) had higher glucocorticoid levels than those animals captured using
kill traps (Victor traps), suggesting that hair glucocorticoid measures can reflect acute stress levels in
addition to long-term glucocorticoid incorporation. These acute levels are likely due to urinary steroids
diffusing into the hair shaft. This finding raises a concern about the use of certain trapping techniques
in association with fur hormone analysis. Finally, as expected, we also detected genus-specific
differences in glucocorticoid levels, as well as cortisol/corticosterone ratios.
Habitat loss and fragmentation are primary threats to biodiversity1,2. It is estimated that at least 75% of Earth’s
non-ice terrestrial surfaces have been modified by humans3. Forest loss and fragmentation can impact climate
and microclimate, as well as species distributions, ecology, and b ehavior4–6. However, species responses to habitat
loss and fragmentation vary7,8.
Habitat loss and fragmentation are also associated with stress, immunosuppression, and disease in wildlife9,10,
which can directly impact p opulations11. Habitat fragmentation has been linked to population declines as a
consequence of prolonged chronic s tress12,13, and such stress can lead to potentially deleterious behavioral and
physiological conditions13. However, higher levels of glucocorticoids (energy-mobilizing hormones whose cir-
culating concentrations are often raised during times of stress) are not always clearly attributed to animals in
forest fragments14,15, suggesting that physiological responses are complex and varied16–18. Thus, understanding
how organisms physiologically respond to changes in their habitats is extremely valuable19.
Glucocorticoids are steroid hormones, whose blood concentrations tend to follow a circadian rhythm related
to activity level, as well as rising during times of stress so as to help mobilize stored nutrients in order to enable
an individual to deal with the stressor20. While cortisol is the dominant glucocorticoid secreted by most mam-
mals, some mammal species primarily secrete c orticosterone21. Because glucocorticoids are released in a pulsatile
manner across minutes, and because they exhibit daily and event-related fluctuations, blood sampling provides
an instantaneous snapshot of blood concentration, which may not be reflective of long-term levels. Because
1
Department of Biology and Program in Environmental Studies and Sciences, Rhodes College, Memphis, TN,
USA. 2Department of Biological Sciences, Chicago State University, Chicago, IL, USA. 3The Field Museum,
Integrative Research Center, Chicago, IL, USA. 4Facultad Politécnica, Universidad Nacional de Asunción, Asunción,
Paraguay. 5Department of Biology and Program in Neuroscience, Rhodes College, Memphis, TN, USA. *email:
sarahannboyle@gmail.com
Scientific Reports | (2021) 11:2111 | https://doi.org/10.1038/s41598-021-81073-2 1
Vol.:(0123456789)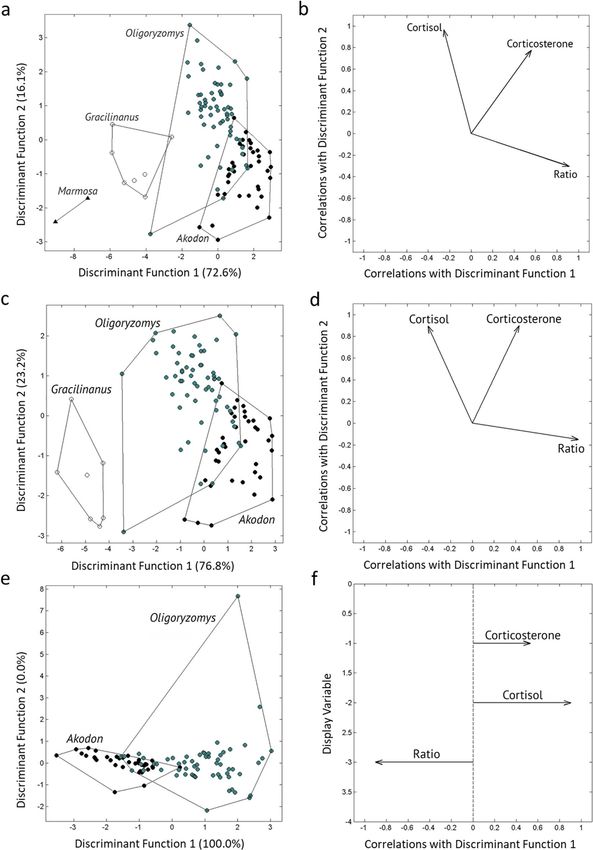
www.nature.com/scientificreports/
steroid hormones and their metabolites are continually deposited within fur, sampling of steroid levels within
fur can provide longer-term quantification of mean hormone levels over periods of days to m onths21–24, which
is a more appropriate time-scale when quantifying glucocorticoid levels for individual animals that may be in
traps for more than several hours.
Typically, the increase in the intensity of the stressor correlates with glucocorticoid i ncreases20, and chronic
stress can negatively impact fitness through the inhibition of reproduction20,25. However, some individuals are
capable of several physiological responses that may ultimately block the additional secretion of stress-related glu-
cocorticoids or physiologically compensate for the increased levels, while others are able to maintain reproductive
behavior during stressful t imes25. Experimental manipulation of glucocorticoids in wild animals also result in
inconsistent effects on physiology, behavior, and fitness; these differences in responses could be due to differ-
ences in species, sex, age class, environmental conditions, and m ethodologies26. Furthermore, the relationship
between baseline glucocorticoid levels and fitness can vary, even within populations and i ndividuals17. However,
the connections between stress and population dynamics in many species have highlighted the conservation
implications of long-term stress on individuals27,28. Understanding the glucocorticoid response of a variety of
organisms (from the individual to species level) is important for gaining insight on the effects of environmental
changes on the stress response of various o rganisms16.
In mammals, higher glucocorticoids have been associated with social stress, dominance rank, reproduc-
tive status, disease, resource availability, season, age, sex of the individual, environmental change, and human
disturbance29–34. However, specific studies examining the stress response of animals in the context of habitat
fragmentation, habitat degradation, and human influences have found varying results. For example, multiple
studies found higher levels of glucocorticoids in habitats experiencing greater modifications and pressures by
humans35–40, but other studies found no differences in glucocorticoids between animals in forest fragments and
continuous forest14 or between animals in national parks and suburban b ackyards41. Although there have been
numerous studies on the impacts of stress in small mammals in laboratories42,43, there have been few studies
published on glucocorticoid levels in small mammals in the w ild44,45, and overall information on the endocrinol-
ogy of many taxa is limited46.
The Interior Atlantic Forest of Paraguay, located in the eastern half of the country, has undergone recent and
dramatic change: Most of this forested area was intact as recently as the 1970s, but by 2003 only 13.4% of the
original Interior Atlantic Forest remained47. Forest loss has continued48, and it is likely that this ecosystem will
be impacted by climate change49. Furthermore, the mammals of Paraguay remain among the least-studied in
South America50,51, with major knowledge gaps present in most g roups50,52.
The purpose of our work was to determine how glucocorticoid concentrations varied in small mammals in a
highly disturbed forest system. Specifically, we tested to what extent variables associated with the small mammals
(e.g., genus, species, and ecomorphological factors such as arboreal vs. cursorial), sampling methods (e.g., trap
type, if the animal was dead or alive immediately prior to fur sampling, and trap placement on the ground, in a
pitfall, or elevated), and the size of the forest fragment correlated with glucocorticoid levels. Because glucocor-
ticoid levels have been shown to vary across taxa53, we predicted there would be differences in small mammal
genera and species. Based on previous findings that found a relationship between the extent of habitat disturbance
and glucocorticoid l evels36,39,40, we predicted that glucocorticoid levels would negatively correlate with the size
of the forest fragment in which the animals were captured, so that small mammals in smaller forest fragments
would have higher glucocorticoid levels than small mammals in larger forest fragments. However, because pat-
terns have varied in studies of animals in human-impacted landscapes, and there can be confounding factors that
affect glucocorticoid l evels53, including the impact of capture s tress54, we included ecomorphological factors and
sampling methods in the analyses. Given that factors associated with glucocorticoid levels are not fully apparent
broadly across taxa, as well as within small mammal taxa, our research findings can contribute information about
the physiological ecology of wild small mammals living in fragmented landscapes.
Results
Individuals sampled. The 106 individuals sampled across the six forest fragments represented five species
of rodents (Akodon montensis, A. paranaensis, Oligoryzomys mattogrossae, O. flavescence, and O. nigripes) and
two species of marsupials (Gracilinanus agilis, Marmosa paraguayana) in four genera. Oligoryzomys and Ako-
don were the most common (56.6% and 34.9% of the captured individuals, respectively; Supplementary Fig. 1),
and O. nigripes represented 93.3% of its genus and A. montensis represented 62.2% of its genus. For Akodon,
40.5% were female (n = 15), 54.1% were male (n = 20), and 5.4% were of unknown sex (n = 2). For Oligoryzomys,
46.7% were female (n = 28), 50.0% were male (n = 30), and 3.3% were of unknown sex (n = 2). All individuals of
unknown sex appeared to be adults, based on body mass. For G. agilis, 71.4% were female (n = 5), and 28.6%
were male (n = 2). For M. paraguayana, 50.0% were female (n = 1), 50.0% were male (n = 1). Individuals were
primarily trapped on the ground (84.0%, n = 89, including pitfall captures), followed by trapped in trees approxi-
mately 1.5 m from the ground (16.0%, n = 17), but the percentage of captures on the ground ranged from 100.0%
for Akodon to 83.3% for Oligoryzomys to 28.6% for G. agilis to 0.0% for M. paraguayana. Overall, 50.0% of the
individuals were captured with Sherman traps, indicating that 50.0% of the animals were in their trap alive prior
to sampling of the fur. The remaining half of the individuals were captured via large Victor snap traps (31.1%
of the individuals), followed by pitfall traps and small Victor snap traps (11.3% and 7.5% of the individuals,
respectively).
Glucocortocoid discriminant function analyses. Glucocorticoid levels were significantly different
among the four genera of small mammals (Wilks’ λ = 0.0792, F9,243.5 = 49.6, p < 0.0001), but glucocorticoids were
more similar between the two rodent genera than between rodents and marsupials (Table 1; Fig. 1a,b). When we
Scientific Reports | (2021) 11:2111 | https://doi.org/10.1038/s41598-021-81073-2 2
Vol:.(1234567890)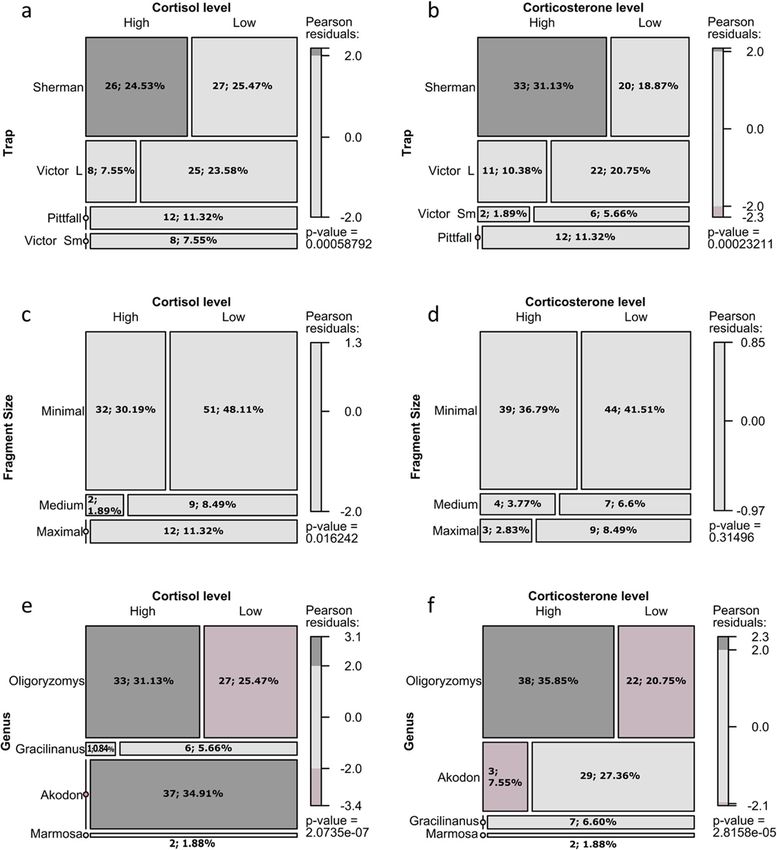
www.nature.com/scientificreports/
O. mattagrossae O. flavescence O. nigripes A. montensis A. paranaensis G. agilis M. paraguayana
Samples (N) 2 2 56 23 14 7 2
Corticosterone
Mean ± SE (pg/
1403.3 ± 689.1 498.7 ± 106.6 986.2 ± 95.3 454.4 ± 66.1 479.6 ± 68.6 42.3 ± 13.6 23.5 ± 7.5
mg)
Cortisol
Mean ± SE (pg/
248.6 ± 198.0 53.2 ± 5.0 209.1 ± 34.0 24.7 ± 4.5 21.01 ± 2.8 75.3 ± 28.5 34.6 ± 5.3
mg)
Corticosterone + cortisol
Mean ± SE (pg/
1651.9 ± 887.1 551.9 ± 111.6 1195.3 ± 112.0 479.1 ± 70.1 500.6 ± 70.4 117.6 ± 41.3 58.1 ± 12.7
mg)
Corticosterone-cortisol ratio
Mean ± SE 9.4 ± 4.7 9.3 ± 1.1 7.5 ± 0.6 20.8 ± 2.2 24.4 ± 2.9 0.7 ± 0.1 0.7 ± 0.1
Table 1. Small mammal corticosterone and cortisol concentrations for Oligoryzomys, Akodon, Gracilinanus
and Marmosa.
compared the two rodent genera and the marsupial Gracilinanus (excluding Marmosa due to low sample size), we
found glucocorticoid levels were significantly different among these three genera (Wilks’ λ = 0.1652, F6,198 = 48.2,
p < 0.0001), and the marsupial (genus Gracilinanus) samples were fully separated from the rodent genera in their
glucocorticoid levels (Fig. 1c,d). Finally, when we compared only the two rodent genera, we found that gluco-
corticoid levels were significantly different between Akodon and Oligoryzomys (Wilks’ λ = 0.4226, F1,93 = 42.3,
p < 0.0001), although some overlap occurred between individuals representing the two rodent genera (Fig. 1e,f).
Glucocorticoid generalized linear models. Logistic models indicated that forest fragment area, mam-
mal taxon, and capture mode (type of trap) were related to glucocorticoid levels; this hypothesis was statistical
supported for corticosterone (Table 2) and cortisol (Table 3) independently. The model with the lowest value of
AICc (the best model) for corticosterone was the model with Area, Genus, and Trap included as fixed predictor
variables with an additive effect [f(Area + Genus + Trap)]; the same finding occurred for cortisol (Tables 2 and 3
provide a comparison of all models). The performance of the best model by the area under the receiver operating
characteristics curve (AUC) indicated a good test for corticosterone [0.75, 0.9) and a very good test [0.9, 0.97)
for cortisol. Low levels of glucocorticoids were more frequent in large areas, and the frequency of high levels
of the two hormones evaluated increased for medium and smaller areas (cortisol: G = 11.3, df = 2, p = 0.003,
Fig. 2a; and corticosterone: G = 2.3, df = 2, p = 0.3, Fig. 2b). We also found that the type of trap was associated
with glucocorticoid levels: lower levels of glucocorticoids were more frequent with pitfall and small Victor traps,
followed by large Victor traps, and the frequency of high levels of glucocorticoids increased with the use of Sher-
man traps (cortisol: G = 21.9, df = 3, p < 0.0001, Fig. 2c; and corticosterone: G = 22.8, df = 3, p < 0.0001, Fig. 2d).
Note that this pattern corresponded to live- and dead-capture traps. In addition, comparisons across the four
genera found that Akodon showed a greater frequency of low levels of stress hormones (27.3% for corticosterone
and 34.9% for cortisol), as did the two genera of marsupials; in contrast, Oligoryzomys had an increase in the
frequency (31.1% for corticosterone and 35.8% for cortisol) of high levels of glucocorticoids (cortisol: G = 39.4,
df = 3, p < 0.0001, Fig. 2e; and corticosterone: G = 24.7, df = 3, p < 0.0001, Fig. 2f). In summary, the size of the for-
est fragment, taxonomic group (i.e., rodent, marsupial), and method of capture were components that explained
glucocorticoid levels.
To confirm that the trap method did not impact our findings relating to the size of the forest fragment and
taxonomic group, we performed binomial models on the data sets, excluding data from individuals trapped via
Sherman traps. The results were congruent with the results of the models of the data set that includes the Sher-
man traps (Supplementary Table 1).
Glucocorticoid post‑hoc results. Because 91.5% of the samples represented individuals in one of two
genera (Oligoryzomys or Akodon), we present the following results to examine glucocorticoid patterns at smaller
scales. Of all four genera, Oligoryzomys had the greatest mean corticosterone and cortisol concentrations
(Table 1).
For the three species of Oligoryzomys (O. flavescence, O. mattogrossae, and O. nigripes), there was no difference
in neither corticosterone ( H2 = 2.56, p = 0.28) nor cortisol levels ( H2 = 1.89, p = 0.39) among the three species. For
the two species of Akodon (A. montensis and A. paranaensis), there was no difference in either corticosterone
(U = 146.0, n = 37, p = 0.64) or cortisol levels (U = 156.0, n = 37, p = 0.88) between the two species. Corticoster-
one and cortisol levels were correlated when evaluating Oligoryzomys (ρ = 0.83; n = 62, p < 0.001) and Akodon
(Spearman’s rho = 0.86; n = 35, p < 0.001) individually. There was no difference between males and females in
their corticosterone (Oligoryzomys: U = 413.0, n = 60, p = 0.58; Akodon: U = 115.0, n = 33, p = 0.58) or cortisol
(Oligoryzomys: U = 435.0, N = 60, p = 0.82; Akodon: U = 91.0, n = 33, p = 0.15) levels.
For both Oligoryzomys and Akodon there was a difference in both corticosterone (Oligoryzomys: H2 = 19.51,
p < 0.001; Akodon: H2 = 11.40, p = 0.003) and cortisol (Oligoryzomys: H2 = 20.60, p < 0.001; Akodon: H2 = 7.0,
p = 0.030) levels based on the type of trap used; corticosterone and cortisol levels were greatest for individuals
captured using Sherman traps (Fig. 3).
Scientific Reports | (2021) 11:2111 | https://doi.org/10.1038/s41598-021-81073-2 3
Vol.:(0123456789)www.nature.com/scientificreports/
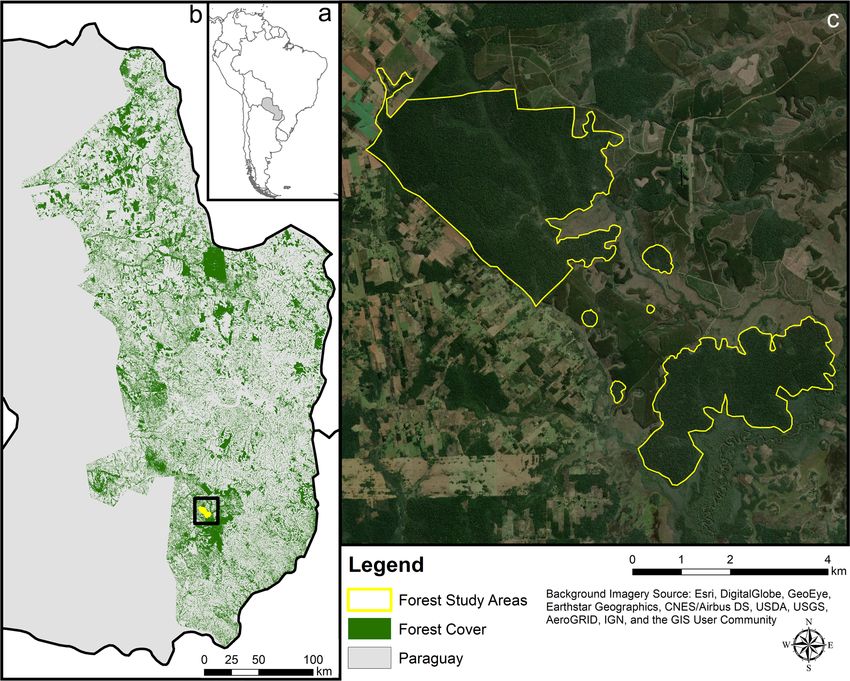
Figure 1. Discriminant function analysis (DFA) results for log-transformed hormone levels (corticosterone,
cortisol, and ratio of the two hormones) for the two rodent genera (Akodon and Oligoryzomys) and the two
marsupial genera (Marmosa and Gracilinanus) via (a) scatterplots and (b) biplots; DFA results between the two
rodent genera (Akodon and Oligoryzomys) and the marsupial Gracilinanus via (c) scatterplots and (d) biplots;
and DFA results between the two rodent genera (Akodon and Oligoryzomys) via (e) scatterplots and (f) biplots
in forest fragments of the Atlantic Forest of eastern Paraguay. The axes for the scatterplots (a,c,e) represent the
projection of the first two dimensions of the discriminant function analyses; the percentages noted on the axes
represent the variation between groups per dimension. The biplots (b,d,f) show the eigenvalues for each of the
variables that were used to discriminate between genera. The y-axis for the rodent biplot (f) is a dummy variable
for display only because there is only one discrimination dimension.
Scientific Reports | (2021) 11:2111 | https://doi.org/10.1038/s41598-021-81073-2 4
Vol:.(1234567890)www.nature.com/scientificreports/
Corticosterone logistic models Rank Df.res AUC BIC AICc ΔAICc p value
f(Area + Genus + Trap)a 9 97 0.87 137.9 113.6 0 < 0.0001
f(Area + Species + Trap) 12 94 0.88 146.2 115.5 1.9 < 0.0001
f(Area + Genus + Ecomorphologi-
11 95 0.88 146.8 118.2 4.6 < 0.0001
cal + Trap + Capture)
f(Area + Genus + Capture) 7 99 0.83 140.7 120.9 7.3 < 0.0001
f(Area + Species + Capture) 10 96 0.85 149.1 122.7 9.1 < 0.0001
f(Species + Genus + Ecomorphological + Trap) 11 95 0.88 157.3 122.7 9.1 < 0.0001
f(Area + Genus + Ecomorphological + Capture) 8 98 0.83 145 122.9 9.3 < 0.0001
f(Species) 7 99 0.77 150.5 130.6 17 < 0.0001
f(Area + Ecomorphological + Capture) 5 101 0.75 150.1 135 21.4 < 0.0001
f(Area + Ecomorphological + Capture) 5 101 0.75 150.1 135 21.4 < 0.0001
f(Species + Genus) 7 99 0.77 164.4 138 24.4 < 0.0001
f(Capture) 2 104 0.67 146.4 138.6 25 0.0002
f(Species + Genus + Ecomorphological) 8 98 0.77 168.1 139.5 25.9 < 0.0001
f(Area + Capture) 4 102 0.70 153 140.3 26.7 0.0007
f(Genus:Area)b 8 98 0.77 178.4 145.7 32.1 < 0.0001
f(Area + Ecomorphological) 4 102 0.66 158.7 146 32.4 0.0096
f(Area) 3 103 0.56 161.3 151.1 37.5 0.1495
f(Species + Genus + Genus:Area) 11 95 0.79 197.3 155.6 42 < 0.0001
f(Species:Area) 13 93 0.79 215.4 167.6 54 < 0.0001
f(1) 1 105 0.5 154.4 149.2 35.6 Null
Table 2. Comparison of generalized linear models used to describe corticosterone levels in all small mammal
species in forest fragment samples. Models are ranked based on ΔAICc, and models with values < 2 are
considered equally valid (bold). All variables are explained in the text. a A nomenclature specification of the
form f(first + second) indicates all the terms in first together with all the terms in second with any duplicates
removed (i.e. additive effects of factors). b A specification of the form f(first:second) indicates the set of terms
obtained by taking the interactions of all terms in first with all terms in second.
Cortisol logistic models Rank Df.res AUC BIC AICc ΔAICc p value
f(Area + Genus + Trap) 9 97 0.94 102.5 78.2 0.0 < 0.0001
f(Area + Genus + Capture) 7 99 0.92 99.65 79.8 1.7 < 0.0001
f(Area + Species + Trap) 12 94 0.95 111 80.4 2.2 < 0.0001
f(Area + Species + Capture) 10 96 0.94 108.2 81.7 3.6 < 0.0001
f(Area + Genus + Ecomorphological + Capture) 8 98 0.92 104.3 82.2 4.1 < 0.0001
f(Area + Genus + Ecomorphological + Trap + Capture) 11 95 0.94 111.7 83.1 4.9 < 0.0001
f(Area + Ecomorphological + Capture) 5 101 0.89 101.3 86.1 8.0 < 0.0001
f(Area + Ecomorphological + Capture) 5 101 0.89 101.3 86.1 8.0 < 0.0001
f(Species + Genus + Ecomorphological + Trap) 11 95 0.93 129.1 94.5 16.3 < 0.0001
f(Species + Genus + Ecomorphological + Trap + Capture) 12 94 0.93 133.7 97.2 19.0 < 0.0001
f(Species) 7 99 0.82 122.3 102.5 24.3 < 0.0001
f(Area + Ecomorphological) 4 102 0.77 117.2 104.5 26.3 < 0.0001
f(Species + Genus) 7 99 0.82 136.3 109.8 31.6 < 0.0001
f(Species + Genus + Ecomorphological) 8 98 0.82 141 112.4 34.2 < 0.0001
f(Area + Capture) 4 102 0.78 126.9 114.2 36.0 < 0.0001
f(Genus:Area) 8 98 0.83 148.5 115.8 37.6 < 0.0001
f(Capture) 2 104 0.72 128.8 121.1 42.9 < 0.0001
f(Species + Genus + Genus:Area) 11 95 0.85 168.2 126.5 48.3 < 0.0001
f(Area) 3 103 0.62 139.8 129.5 51.3 0.0013
f(1) 1 105 0.50 142.3 137.1 58.9 Null
Table 3. Comparison of generalized linear models used to describe cortisol levels in all small mammal species
in forest fragment samples. Models are ranked based on ΔAICc, and models with values < 2 are considered
equally valid (bold). All variables are explained in text.
Scientific Reports | (2021) 11:2111 | https://doi.org/10.1038/s41598-021-81073-2 5
Vol.:(0123456789)www.nature.com/scientificreports/
Figure 2. MosaicPlot of levels of cortisol and corticosterone (low and high) given the area (large, medium, and
small) of forest fragments (a,b), type of trap (c,d), and genus (e,f). The size of the cell depends on the frequencies
observed in the cross-classification of the contingency tables, and cells without numbers have a frequency of
zero. With each plot is a Pearson residue reference scale. The sign of the residual indicates whether the observed
frequency in a cell is greater or less than the expected value, and the magnitude indicates the degree of deviation
from expected.
Discussion
We found that forest fragment area, capture mode (type of trap), and taxon were all related to corticosterone
and cortisol levels in small mammals. First, as predicted, higher levels of glucocorticoids were more prevalent in
individuals captured in the small forest fragments. Second, an unintended but important finding from our study
was that the type of trap used for capturing the small mammals impacted the glucocorticoid levels associated with
the individual animals; this pattern was corroborated when Oligoryzomys and Akodon were analyzed separately,
too. While trap type does not determine glucocorticoid levels per se, factors correlated with trap type (e.g., if the
Scientific Reports | (2021) 11:2111 | https://doi.org/10.1038/s41598-021-81073-2 6
Vol:.(1234567890)www.nature.com/scientificreports/
Figure 3. Comparison of glucocorticoid concentration in Oligoryzomys (a) and Akodon (b) samples based on
the type of trap (pitfall, Victor, or Sherman) used for sampling the small mammals. Pairwise differences between
trap types are indicated by uppercase letters (corticosterone) and numbers (cortisol) above the bars. Although
the type of trap may not directly determine glucocorticoid levels per se, glucocorticoids extracted from the fur
of the animals may be associated with the trap type (e.g., the amount of time spent in the trap, and if animal was
captured alive or died immediately after capture).
animal was captured alive or immediately died, length of time alive in the trap) may impact the quantification of
the glucocorticoid levels. Finally, as expected, glucocorticoid levels differed greatly among the four genera, and
there were specific differences between the rodents and marsupials.
Our first finding, that glucocorticoids were overall higher in individuals living in the small forest fragments,
was similar to previous studies that found that primates living in forest fragments had higher levels of glucocor-
ticoids than individuals living in continuous forest h abitat36,39,40. In our study, individuals in the largest fragment
(1200 ha) had glucocorticoid levels that were a fraction of the levels found in individuals in the smaller fragments.
Therefore, the individuals in these smaller forest fragments appear to be experiencing increased physiologi-
cal stress. Increased stress may impact animal health, fitness, the conservation of populations, and emerging
infectious diseases16,46,55. That said, the patterns are not fully evident across taxa so conclusions should not be
painted broadly without further s tudy34,56. Although our findings support our hypothesis that forest fragmenta-
tion impacts glucocorticoid levels in small mammals, more sampling is needed, given that we sampled only six
forest fragments, and two-thirds of the forest fragments in the current study were 25 ha and smaller. In order to
draw stronger conclusions on relationships between fragment size and glucocorticoid levels, we would want to
expand our sampling of larger fragments (1000 ha and larger).
Our second finding was that the type of trap used to capture the individuals impacted the glucocorticoid
levels noted for the individual animals. Typically, it is thought that the use of fur is appropriate for longer-term
(days to months) quantification of mean hormone levels21. However, we found that individuals trapped in Sher-
man traps, which typically resulted in live captures and the animals spending hours in the trap post capture,
had elevated levels of both corticosterone and cortisol. Although the fur was rinsed with isopropanol prior to
hormone extraction, it appears that hormones were absorbed into the hair shaft between the time the animal was
captured and when the hormone extraction was completed months later. Hair can absorb water and its volume
changes with relative humidity57; furthermore, hair lipids including cholesterol are lost when hair is washed and
many of these lipids are then replaced by sebum secretion onto the hair s haft58. It therefore makes sense that
steroid hormones, which all derive from cholesterol, can potentially also enter fur from urine. Therefore, traps
that constrain a live animal for a duration of minutes to hours allow time for urine, which shows a faster response
to glucocorticoid changes, to potentially be excreted and impact fur glucocorticoid concentrations. Our findings
illustrate the important ramifications that sampling type may have on glucocorticoid quantification, even when
working with fur. Importantly, our finding of higher glucocorticoid levels in animals from smaller fragments
was robust when controlling for the trap type employed.
Scientific Reports | (2021) 11:2111 | https://doi.org/10.1038/s41598-021-81073-2 7
Vol.:(0123456789)www.nature.com/scientificreports/
Our third finding, that glucocorticoid levels differed by mammal taxa, is very important for understanding
patterns in glucocorticoid levels across taxonomic groups. The stress response, measured by glucocorticoid
levels, varies among and within t axa17,59. Our study is the first to present glucocorticoid levels in free-ranging
individuals representing these four mammalian genera. These genera represent mammalian lineages that diverged
approximately 200 mya, and represent different evolutionary histories in South A merica60. We found that overall,
the two rodent genera exhibited high total glucocorticoid levels with corticosterone levels many-fold higher
than cortisol levels. In contrast, the two marsupial genera exhibited relatively low total glucocorticoid levels,
and their cortisol and corticosterone levels were relatively similar. We found large ranges between minimum
and maximum glucocorticoid levels within a genus, but no differences among species within a genus, suggest-
ing that anthropogenic changes may be driving the variance seen across individuals. These results highlight the
importance of assaying and analyzing glucocorticoids differently between rodent and marsupial taxa. Different
analyses could be especially important when the findings are used for assessing stress in conservation contexts.
Our study greatly adds to the literature on glucocorticoid concentrations in wild small mammals, specifi-
cally animals in the genera Oligoryzomys, Akodon, Gracilinanus, and Marmosa. In a review of the published
literature, we found only one publication on Gracilinanus that provided information regarding glucocorticoid
concentrations in these small mammal g enera54. Our study provides fur corticosterone and cortisol levels for free-
ranging small mammals in a fragmented landscape, and emphasizes the need for a better understanding of these
glucocorticoid levels for animals living in less-disturbed forest environments. When examining glucocorticoid
responses, variations often exist between species, reproductive state, time of day, sex, environmental conditions,
and methodologies for collecting and analyzing the samples61. There is variation in individual glucocorticoid
levels, and such variation is important to consider when comparing only population m eans27.
Across animal taxa, the impacts of stress on glucocorticoid levels have been noted, but the extent to which
these physiological changes impact the health, survival, and conservation of populations is not fully clear34,56.
Furthermore, we highlight the important implications that trapping method may have on glucocorticoid meas-
urements, even when one is using fur for measures of longer-term profiles.
Conclusions
We found that the levels of the glucocorticoids cortisol and corticosterone differed in small mammals based on
(1) the size of the forest fragment where the individuals lived; (2) the trapping method used, probably due to
stress of confinement upon capture, and absorption of hormones prior to extraction and analysis; and (3) taxon.
Our findings suggest that individuals living in heavily disturbed habitats may experience more physiological
challenges than individuals in more intact habitats that it is important to take trapping method (trap type) into
consideration when analyzing glucocorticoids from fur, and that South American Interior Atlantic Forest rodents
and marsupials differ markedly in their glucocorticoid levels.
Methods
Field data collection. The study was conducted at the Reserva Natural Tapytá, located in the Caazapá
Department, Paraguay. The 4736-ha reserve consists of a mosaic of Interior Atlantic Forest, gallery forest, wet-
lands, pasture, and eucalyptus plantations62. The eucalyptus plantations were actively harvested during the study
period, but the distance between these harvested areas and the forest fragments we sampled was > 2 km. We
collected data in six forest fragments (Fig. 4) that varied in size from 2 to 1200 ha (2, 8, 9, 25, 633, and 1200 ha).
Sites were separated from each other by 0.5–2.4 km, with the minimum distance between two forest fragments
ranging from 0.5 to 0.8 km (mean ± SE: 0.6 ± 0.04 km). The matrix surrounding the forest fragments primarily
consisted of wetlands and pasture. We selected the sample sites based on their availability within the reserve:
at the time of sampling the four smaller fragments were fully isolated fragments that were not near harvesting
activity in the eucalyptus plantations. There were only two larger forest fragments within this area of the reserve,
and we sampled both. Several of the smaller forest fragments showed signs that cattle regularly entered the area.
There was no fencing to prevent cattle from entering any of the forest fragments in the reserve. This research fol-
lowed the American Society of Mammalogists’ guidelines63 and was approved by the Institutional Animal Care
and Use Committee (IACUC) at Rhodes College, Memphis, Tennessee.
In each of the six forest fragments, we set up one trapping grid. Grids consisted of four parallel traplines,
with a pitfall line along the middle of the four main traplines for a total of five lines. Each trapline and pitfall
was 10 m apart. Each trapline included 15 stations each approximately 8 m apart. We opted for this approach
for comparative purposes with prior sampling conducted in larger forest fragments in the region, and because
this approach has been shown to be effective in this habitat64. However, we scaled the grids back proportionally
in size because the grid size in the earlier studies of the large forest fragments was larger than some of the forest
fragments in the current study. Each station along the four traplines consisted of two Sherman traps and two
Victor snap traps, with both trap types set on the ground and 1.5 m above the ground on a tree limb. The pitfall
line in the middle of the grid had seven pitfall buckets along the line. We sampled two separate fragments con-
currently, with sampling occurring in July and August 2013, which coincided with the dry season for the region.
In each fragment, we sampled for 8 consecutive nights, and we checked the traps every morning. All grids were
placed 5–10 m from the closest edge of the forest fragment.
We collected each individual captured as a voucher specimen, and we documented each individual’s genus,
sex, and age; recorded external body measurements; and cut a fur sample (close to the skin but avoiding living
follicles) from the lower dorsal region, along the lateral portion of the hind leg. We identified species using
craniodental characters, combined with DNA barcoding of selected specimens, which we have found to effectively
discriminate among rodent and marsupial species in the region65–68. All specimens are currently housed at the
Field Museum of Natural History, Chicago, Illinois, USA (Supplementary Table 2).
Scientific Reports | (2021) 11:2111 | https://doi.org/10.1038/s41598-021-81073-2 8
Vol:.(1234567890)www.nature.com/scientificreports/
Figure 4. The study area in (a) Paraguay at the (b) Reserva Natural Tapytá, in the Caazapá Department of
Paraguay is located within the highly fragmented Interior Atlantic Forest. The (c) six forest fragments in the
current study were surrounded by a matrix of gallery forest, wetlands, pasture, and eucalyptus plantations. Small
mammals in the four smaller forest fragments (2–25 ha) had higher glucocorticoid levels than small mammals
in the larger forest fragments (633 and 1200 ha). Data for forest cover were derived from Hansen et al.48 Maps
generated using ArcGIS 10.7 (https://desktop.arcgis.com)91.
Measuring glucocorticoid concentrations from hair has shown to work in a number of mammalian spe-
cies: chimpanzee, Pan troglodytes36; grizzly bear, Ursus arctos69; rhesus macaque, Macaca mulatta70; rock hyrax,
Procavia capensis71. Fur samples were weighed on a precision balance (Denver Instruments Company XE Series
model 100a) and these samples ranged from 2 to 19.5 mg for each small mammal sampled, and the entirety of
the sample was used in the analysis. There was no difference among the mammal genera in the amount of fur
sampled (ANOVA: F102,3 = 1.25, P = 0.30). To test if low fur weights were correlated to low hormone concentra-
tions, we performed a Pearson one-sided permutation correlation test (H0: r ≤ 0, Ha: r > 0)72. We found no statis-
tical support for a positive correlation between fur weight and hormone concentration, both for corticosterone
(r = − 0.34, p(r ≤ 0) > 0.05, N = 106) and for cortisol (r = − 0.19, p(r ≤ 0) > 0.05, N = 106). Fur samples were stored in
Eppendorf tubes until analysis.
Glucocorticoid assays. We performed steroid analyses of fur samples according to standard protocols73.
We rinsed the fur twice with isopropanol to remove surface-level steroids, such as those found in sweat. Once the
fur had dried, we homogenized the fur by bead beating. Steroid hormones were extracted using 1.5 ml methanol
for 24 h. After centrifugation, we allocated 0.5 ml of the supernatant for the corticosterone assay and another
0.5 ml for the cortisol assay. We dried down the methanol using a speed vac, and then reconstituted the samples
with the respective enzyme immunoassay kit buffers. We conducted the enzyme immunoassays according to the
product directions (Arbor Assays corticosterone kit K014 and cortisol kit K003). We reran samples whose values
were above the maximum detectability at 20% of original concentration, along with a subset of original samples.
Diluted samples showed parallelism (coefficient of variations: 14.6% for corticosterone, 20.7% for cortisol), and
diluted samples correlated strongly with undiluted samples (corticosterone: r = 0.86, n = 16, P < 0.001, cortisol:
Scientific Reports | (2021) 11:2111 | https://doi.org/10.1038/s41598-021-81073-2 9
Vol.:(0123456789)www.nature.com/scientificreports/
r = 0.99, n = 31, P < 0.001). The mean intra-assay coefficient of variation for corticosterone was 8.3% and for corti-
sol it was 13.8%. The inter-assay coefficient of variation for corticosterone was 5.5% and for cortisol it was 19.5%.
Discriminant function analyses. We used discriminant function analyses (DFA) to optimize the differ-
ence between rodent (Akodon and Oligoryzomys) and marsupial (Marmosa and Gracilinanus) genera based on
corticosterone, cortisol, and the ratio of corticosterone to cortisol using log-transformed matrices. Such analy-
ses aimed to maximize separation between groups based on eigenvectors that represent variables that explain
said groups74. This was followed up with a non-parametric multivariate analysis of variance (MANOVA) with
10,000 permutations using Matlab function “Dfa” using functions created using a Matlab script created by R. E.
Strauss (http://www.faculty.biol.ttu.edu/Strauss/Matlab/Matlab.htm), using log-transformed matrices (see the
applications by Hernandez et al.75 and Rossi et al.76). Taking the non-parametric approach was valuable because
it mitigated the conventional assumptions of multivariate normality and homogeneity of covariance m atrices77
and potentially low sample size. This approach is different from a PerMANOVA sensu A nderson78. MANOVA
statistical significance was evaluated on a α = 0.05.
Generalized linear models. To determine the factors or combinations of factors that explained cortisol
and corticosterone levels in our samples, we used generalized linear models (GLM). We conducted separate
models for cortisol and corticosterone. GLMs are valuable because they allow for the implementation of both
categorical and/or continuous explanatory v ariables79. We implemented a binomial family with a logistic link
function to account for proportion data based on eight categorical variables: genus, species, ecomorphological
(arboreal vs. cursorial), trap type (small Victor, large Victor, pitfall, or Sherman), capture (dead vs. alive imme-
diately prior to fur sampling), trap placement (ground, pitfall, or elevated), and forest fragment size (classified
fragment size into small: ≤ 25 ha; medium: 633 ha; and large: 1200 ha).
We implemented an a priori mean-based discretization-threshold approach to discretize the levels of each
hormone as the GLM response variable, such that ’’high’’ indicated the cases that were above the mean of all
samples and ’’low’’ indicated cases that were equal or smaller than the mean. Discretization is a useful preproc-
essing technique in many knowledge discovery and data mining t asks80,81. The induction tasks can benefit from
discretization: rules with discrete values are normally shorter and more understandable, discretization can lead
to improved predictive accuracy and the discretization can provide nonlinear relations81. In this sense, although
there are methods of data science that automate discretization, we used mean-based discretization threshold
because it is a simple and reproducible criterion.
We conducted these analyses using the function ‘glm’ in the package stats in R v3.6.282. We tested the model
statistical significance (α = 0.05) via a likelihood-ratio test with respect to a null model; this approach permitted
us to do a statistical test of the goodness-of-fit between two models. We compared each relatively more-complex
model with the null model to test that these models significantly outperformed random models. We proceeded
to compare the top models based on second-order bias-corrected Akaike Information Criterion A ICc83. This
approach has a larger penalty term than AIC particularly when n (the sample size) is small with respect to the
number of estimated parameters k84. The best model was that which had the lowest AICc value. AIC and Bayesian
Inferential Criterion85 values were also compared using the function ‘compareGLM’ in package r companion86
in R.
In addition, we computed the area under the receiver operating characteristics curve (AUC) to measure the
performance of the models. This approach allowed us to determine two aspects of the models: first, if the model
made the predictions randomly (AUC ≈ 0.5); and second, how well the model performed the binary classification
task—when the AUC is closer to 1 the performance of the model is better87,88. We implemented mosaic plots to
illustrate how each hormone level (high or low) was associated with each variable in the best-fit models. Mosaic
plots allow the display of values in contingency tables which are cross-classified by one or more factors, where
the area in the plots is divided into bars representing quantities of variables that are compared89. This pattern of
association was statistical followed up with G-tests90 of independence with Williams’ correction for the small
sample size (function GTest form library DescTools in R).
Analyses by genera. Because 91.5% of the individuals sampled represented two genera, and because this
study is the first to report glucocorticoid levels for free-ranging individuals from these mammalian genera, we
followed the above analyses with post hoc analyses to examine genus-specific patterns in glucocorticoids in more
detail.
For each of the two genera, we tested if there were differences between the species in a particular genus using
a non-parametric Mann–Whitney U test when there were two species and non-parametric Kruskal–Wallis test
when there were three species. Within each genus, we tested if there was a correlation between corticosterone and
cortisol levels using Spearman’s rank correlation, and then tested if there were sex differences in corticosterone
and cortisol levels using Mann Whitney tests. We conducted further analyses on the influence of trap type on
glucocorticoid levels by using a Kruskal–Wallis test for each genus individually. We used nonparametric tests
for these analyses because these tests are insensitive to serial correlation, non-normality, and outliers compared
to parametric a pproaches79. All analyses were performed using α = 0.05.
Received: 23 July 2020; Accepted: 29 December 2020
Scientific Reports | (2021) 11:2111 | https://doi.org/10.1038/s41598-021-81073-2 10
Vol:.(1234567890)www.nature.com/scientificreports/
References
1. Haddad, N. M. et al. Habitat fragmentation and its lasting impact on Earth’s ecosystems. Sci. Adv. 1, e1500052 (2015).
2. Newbold, T. et al. Global effects of land use on local terrestrial biodiversity. Nature 520, 45–50 (2015).
3. Ellis, E. C. & Ramankutty, N. Putting people in the map: Anthropogenic biomes of the world. Front. Ecol. Environ. 6, 439–447
(2008).
4. Alkama, R. & Cescatti, A. Biophysical climate impacts of recent changes in global forest cover. Science 351, 600–604 (2016).
5. Debinski, D. M. & Holt, R. D. A survey and overview of habitat fragmentation experiments. Conserv. Biol. 14, 342–355 (2000).
6. Laurance, W. F. et al. The fate of Amazonian forest fragments: A 32-year investigation. Biol. Conserv. 144, 56–67 (2011).
7. Ewers, R. M. & Didham, R. K. Confounding factors in the detection of species responses to habitat fragmentation. Biol. Rev. 81,
117 (2006).
8. Hagen, M. et al. Biodiversity, species interactions and ecological networks in a fragmented world. Adv. Ecol. Res. 46, 89–210 (2012).
9. Acevedo-Whitehouse, K. & Duffus, A. L. J. Effects of environmental change on wildlife health. Philos. Trans. R. Soc. B 364,
3429–3438 (2009).
10. Jonsson, C. B., Figueiredo, L. T. M. & Vapalahti, O. A global perspective on hantavirus ecology, epidemiology, and disease. CMR
23, 412–441 (2010).
11. Ellis, R. D., McWhorter, T. J. & Maron, M. Integrating landscape ecology and conservation physiology. Landsc. Ecol. 27, 1–12
(2012).
12. Chapman, C. A. et al. Do food availability, parasitism, and stress have synergistic effects on red colobus populations living in forest
fragments?. Am. J. Phys. Anthropol. 131, 525–534 (2006).
13. Johnstone, C. P., Reina, R. D. & Lill, A. Interpreting indices of physiological stress in free-living vertebrates. J. Comp. Physiol. B
182, 861–879 (2012).
14. Ordóñez-Gómez, J. D. et al. Proximal and distal predictors of the spider monkey’s stress levels in fragmented landscapes. PLoS
ONE 11, e0149671 (2016).
15. Rimbach, R. et al. Effects of logging, hunting, and forest fragment size on physiological stress levels of two sympatric ateline
primates in Colombia. Conserv. Physiol. 1, cot031 (2013).
16. Angelier, F. & Wingfield, J. C. Importance of the glucocorticoid stress response in a changing world: Theory, hypotheses and
perspectives. Gen. Comp. Endocrinol. 190, 118–128 (2013).
17. Bonier, F., Martin, P. R., Moore, I. T. & Wingfield, J. C. Do baseline glucocorticoids predict fitness?. Trends Ecol. Evol. 24, 634–642
(2009).
18. Busch, D. S. & Hayward, L. S. Stress in a conservation context: A discussion of glucocorticoid actions and how levels change with
conservation-relevant variables. Biol. Conserv. 142, 2844–2853 (2009).
19. Wikelski, M. & Cooke, S. J. Conservation physiology. Trends Ecol. Evol. 21, 38–46 (2006).
20. Sapolsky, R. M., Romero, L. M. & Munck, A. U. How do glucocorticoids influence stress responses? Integrating permissive, sup-
pressive, stimulatory, and preparative actions. Endocr. Rev. 21, 55–89 (2000).
21. Sheriff, M. J., Dantzer, B., Delehanty, B., Palme, R. & Boonstra, R. Measuring stress in wildlife: Techniques for quantifying gluco-
corticoids. Oecologia 166, 869–887 (2011).
22. Heimbürge, S., Kanitz, E., Tuchscherer, A. & Otten, W. Within a hair’s breadth—Factors influencing hair cortisol levels in pigs and
cattle. Gen. Comp. Endocrinol. 288, 113359 (2020).
23. Kalliokoski, O., Jellestad, F. K. & Murison, R. A systematic review of studies utilizing hair glucocorticoids as a measure of stress
suggests the marker is more appropriate for quantifying short-term stressors. Sci. Rep. 9, 11997 (2019).
24. Koren, L. et al. Towards the validation of endogenous steroid testing in wildlife hair. J. Appl. Ecol. 56, 547–561 (2019).
25. Wingfield, J. C. & Sapolsky, R. M. Reproduction and resistance to stress: When and how. J. Neuroendocrinol. 15, 711–724 (2003).
26. Sopinka, N. M. et al. Manipulating glucocorticoids in wild animals: Basic and applied perspectives. Conserv. Physiol. 3, cov031
(2015).
27. Cockrem, J. F. Conservation and behavioral neuroendocrinology. Horm. Behav. 48, 492–501 (2005).
28. Fefferman, N. H. & Romero, L. M. Can physiological stress alter population persistence? A model with conservation implications.
Conserv. Physiol. 1, cot012 (2013).
29. Bauer, C. M. et al. Habitat type influences endocrine stress response in the degu (Octodon degus). Gen. Comp. Endocrinol. 186,
136–144 (2013).
30. Behie, A. M., Pavelka, M. S. M. & Chapman, C. A. Sources of variation in fecal cortisol levels in howler monkeys in Belize. Am. J.
Primatol. 72, 600–606 (2010).
31. Cavigelli, S. A. Behavioural patterns associated with faecal cortisol levels in free-ranging female ring-tailed lemurs, Lemur catta.
Anim. Behav. 57, 935–944 (1999).
32. Mahmud-Al-Rafat, A. & Taylor-Robinson, A. W. Emergence and persistence of hantavirus in rodent reservoirs: Role of glucocor-
ticoid hormone. Biohelikon Immun. Dis. 2, 9 (2014).
33. Reeder, D. M. & Kramer, K. M. Stress in free-ranging mammals: Integrating physiology, ecology, and natural history. J. Mammal.
86, 225–235 (2005).
34. Dantzer, B., Fletcher, Q. E., Boonstra, R. & Sheriff, M. J. Measures of physiological stress: A transparent or opaque window into
the status, management and conservation of species?. Conserv. Physiol. 2, cou023 (2014).
35. Bhattacharjee, S. et al. Glucocorticoid stress responses of reintroduced tigers in relation to anthropogenic disturbance in Sariska
Tiger Reserve in India. PLoS ONE 10, e0127626 (2015).
36. Carlitz, E. H. D. et al. Measuring hair cortisol concentrations to assess the effect of anthropogenic impacts on wild chimpanzees
(Pan troglodytes). PLoS ONE 11, e0151870 (2016).
37. Creel, S., Christianson, D. & Schuette, P. Glucocorticoid stress responses of lions in relationship to group composition, human
land use, and proximity to people. Conserv. Physiol. 1, cot021 (2013).
38. Hammond, T. T. et al. Physiological and behavioral responses to anthropogenic stressors in a human-tolerant mammal. J. Mammal.
100, 1928–1940 (2019).
39. Martínez-Mota, R., Valdespino, C., Sánchez-Ramos, M. A. & Serio-Silva, J. C. Effects of forest fragmentation on the physiological
stress response of black howler monkeys. Anim. Conserv. 10, 374–379 (2007).
40. Rangel-Negrín, A., Alfaro, J. L., Valdez, R. A., Romano, M. C. & Serio-Silva, J. C. Stress in Yucatan spider monkeys: Effects of
environmental conditions on fecal cortisol levels in wild and captive populations. Anim. Conserv. 12, 496–502 (2009).
41. Dowle, M., Webster, K. N. & Deane, E. Faecal glucocorticoid metabolite concentrations in the free-ranging bandicoots (Perameles
nasuta and Isoodon obesulus) of northern Sydney. Aust. Mammal. 35, 1 (2013).
42. Malisch, J. L. et al. Baseline and stress-induced plasma corticosterone concentrations of mice selectively bred for high voluntary
wheel running. Physiol. Biochem. Zool. 80, 146–156 (2007).
43. Mccabe, P. et al. Animal models of disease. Physiol. Behav. 68, 501–507 (2000).
44. Fredebaugh-Siller, S. L., Suski, C. D., Zuckerman, Z. C. & Schooley, R. L. Ecological correlates of stress for a habitat generalist in
a biofuels landscape. Can. J. Zool. 91, 853–858 (2013).
45. Johnstone, C. P., Lill, A. & Reina, R. D. Habitat loss, fragmentation and degradation effects on small mammals: Analysis with
conditional inference tree statistical modelling. Biol. Conserv. 176, 80–98 (2014).
Scientific Reports | (2021) 11:2111 | https://doi.org/10.1038/s41598-021-81073-2 11
Vol.:(0123456789)www.nature.com/scientificreports/
46. McCormick, S. D. & Romero, L. M. Conservation endocrinology. Bioscience 67, 429–442 (2017).
47. Fleytas, M. C. Cambios en el paisaje: evolución de la cobertura vegetal en la Región Oriental del Paraguay. In Biodiversidad del
Paraguay: Una aproximación a sus realidades (ed. Fundación Moisés Bertoni) 77–88 (Fundación Moisés Bertoni, 2007).
48. Hansen, M. C. et al. High-resolution global maps of 21st-century forest cover change. Science 342, 850–853 (2013).
49. Beaumont, L. J. et al. Impacts of climate change on the world’s most exceptional ecoregions. Proc. Natl. Acad. Sci. 108, 2306–2311
(2011).
50. de la Sancha, N. et al. An annotated checklist of the mammals of Paraguay. THERYA8, 241–260 (2017).
51. Porter, L. et al. Pitheciid conservation in Ecuador, Colombia, Peru, Bolivia and Paraguay. In Evolutionary Biology and Conservation
of Titis, Sakis and Uacaris (eds. Veiga, L. M., Barnett, A. A., Ferrari, S. F. & Norconk, M. A.) 320–333 (Cambridge University Press,
Cambridge, 2013).
52. de la Sancha, N. U., Libardi, G. S. & Pardiñas, U. F. J. Discovery of a new genus record for Paraguay, the Atlantic Forest endemic
rodent, Abrawayaomys (Cricetidae, Sigmodontinae). Mammalia 84, 366–371 (2019).
53. Palme, R. Non-invasive measurement of glucocorticoids: Advances and problems. Physiol. Behav. 199, 229–243 (2019).
54. Hernandez, S. E., Strona, A. L. S., Leiner, N. O., Suzán, G. & Romano, M. C. Seasonal changes of faecal cortisol metabolite levels
in Gracilinanus agilis (Didelphimorphia: Didelphidae) and its association to life histories variables and parasite loads. Conserv.
Physiol. 6, (2018).
55. Hing, S., Narayan, E. J., Thompson, R. C. A. & Godfrey, S. S. The relationship between physiological stress and wildlife disease:
Consequences for health and conservation. Wildl. Res. 43, 51 (2016).
56. Beehner, J. C. & Bergman, T. J. The next step for stress research in primates: To identify relationships between glucocorticoid
secretion and fitness. Horm. Behav. 91, 68–83 (2017).
57. Cruz, C. F., Ribeiro, A., Martins, M. & Cavaco-Paulo, A. Effect of a peptide in cosmetic formulations for hair volume control. Int.
J. Cosmet. Sci. 39, 600–609 (2017).
58. Song, S.-H. et al. Prevention of lipid loss from hair by surface and internal modification. Sci. Rep. 9, 9834 (2019).
59. Jessop, T. S., Woodford, R. & Symonds, M. R. E. Macrostress: Do large-scale ecological patterns exist in the glucocorticoid stress
response of vertebrates? Funct. Ecol. 27, 120–130 (2013).
60. de la Sancha, N. U., Maestri, R., Bovendorp, R. S. & Higgins, C. L. Disentangling drivers of small mammal diversity in a highly
fragmented forest system. Biotropica 52, 182–195 (2020).
61. Rimbach, R., Heymann, E. W., Link, A. & Heistermann, M. Validation of an enzyme immunoassay for assessing adrenocortical
activity and evaluation of factors that affect levels of fecal glucocorticoid metabolites in two New World primates. Gen. Comp.
Endocrinol. 191, 13–23 (2013).
62. Velázquez, M. C. & Ramírez Pinto, F. Guía de los mamíferos de la Reserva Natural Tapytá. (Fundación Moisés Bertoni, 2014).
63. Sikes, R. S. & the Animal Care and Use Committee of the American Society of Mammalogists. 2016 Guidelines of the American
Society of Mammalogists for the use of wild mammals in research and education. J. Mammal. 97, 663–688 (2016).
64. de la Sancha, N. U. Patterns of small mammal diversity in fragments of subtropical Interior Atlantic Forest in eastern Paraguay.
Mammalia 78, 437–449 (2014).
65. de la Sancha, N., D’Elía, G., Netto, F., Pérez, P. & Salazar-Bravo, J. Discovery of Juliomys (Rodentia, Sigmodontinae) in Paraguay,
a new genus of Sigmodontinae for the country’s Atlantic Forest. Mammalia 73, 162–167 (2009).
66. de la Sancha, N. U., Pérez-Estigarribia, P. E., McCulloch, E. & Boyle, S. A. Micromamíferos. In Guía de los mamíferos de la Reserva
Natural Tapytá (eds. Velázquez, M. C. & Ramírez Pinto, F.) 91–124 (Fundación Moisés Bertoni, 2014).
67. de la Sancha, N. U. et al. Rhipidomys (Rodentia, Cricetidae) from Paraguay: Noteworthy new records and identity of the Paraguayan
species. Mammalia 75, 269–276 (2011).
68. de la Sancha, N. U. & D’Elía, G. Additions to the Paraguayan mammal fauna: The first records of two marsupials (Didelphimorphia,
Didelphidae) with comments on the alpha taxonomy of Cryptonanus and Philander. Mammalia 79, (2015).
69. Macbeth, B. J., Cattet, M. R. L., Stenhouse, G. B., Gibeau, M. L. & Janz, D. M. Hair cortisol concentration as a noninvasive measure
of long-term stress in free-ranging grizzly bears (Ursus arctos): Considerations with implications for other wildlife. Can. J. Zool.
88, 935–949 (2010).
70. Davenport, M. D., Tiefenbacher, S., Lutz, C. K., Novak, M. A. & Meyer, J. S. Analysis of endogenous cortisol concentrations in the
hair of rhesus macaques. Gen. Comp. Endocrinol. 147, 255–261 (2006).
71. Koren, L. et al. A novel method using hair for determining hormonal levels in wildlife. Anim. Behav. 63, 403–406 (2002).
72. Higgins, J. J. An Introduction to Modern Nonparametric Statistics. (Brooks/Cole, 2004).
73. Gow, R., Thomson, S., Rieder, M., Van Uum, S. & Koren, G. An assessment of cortisol analysis in hair and its clinical applications.
Forensic Sci. Int. 196, 32–37 (2010).
74. Strauss, R. E. Discriminating groups of organisms. In Morphometrics for Nonmorphometricians (ed. Elewa, A. M. T.) vol. 124,
73–91 (Springer, Berlin, 2010).
75. Hernandez, G., Garcia, S., Vilela, J. F. & de la Sancha, N. U. Ontogenetic variation of an omnivorous generalist rodent: The case of
the montane akodont (Akodon montensis). J. Mammal. 98, 1741–1752 (2017).
76. Rossi, L. F., de la Sancha, N. U., Luaces, J. P., Estevez, D. Y. & Merani, M. S. Morphological description and comparison of sperm
from eighteen species of cricetid rodents. J. Mammal. 99, 1398–1404 (2018).
77. Ordóñez-Garza, N., Matson, J. O., Strauss, R. E., Bradley, R. D. & Salazar-Bravo, J. Patterns of phenotypic and genetic variation in
three species of endemic Mesoamerican Peromyscus (Rodentia: Cricetidae). J. Mammal. 91, 848–859 (2010).
78. Anderson, M. J. A new method for non-parametric multivariate analysis of variance. Austral Ecol. 26, 32–46 (2001).
79. Crawley, M. J. Statistics: An Introduction Using R. 2nd ed. (Wiley, Hoboken, 2015).
80. Garcia, S., Luengo, J., Sáez, J. A., López, V. & Herrera, F. A survey of discretization techniques: Taxonomy and empirical analysis
in supervised learning. IEEE Trans. Knowl. Data Eng. 25, 734–750 (2013).
81. Liu, H., Hussain, F., Tan, C. L. & Dash, M. Discretization: An enabling technique. Data Min. Knowl. Disc. 6, 393–423 (2002).
82. R Core Team. R: A Language and Environment for Statistical Computing. (R Foundation for Statistical Computing, 2019).
83. Hurvich, C. M. & Tsai, C.-L. Bias of the corrected AIC criterion for underfitted regression and time series models. Biometrika 78,
499–509 (1991).
84. Anderson, D. R., Burnham, K. P. & White, G. C. AIC model selection in overdispersed capture-recapture data. Ecology 75,
1780–1793 (1994).
85. Schwarz, G. Estimating the dimension of a model. Ann. Stat. 6, 461–464 (1978).
86. Mangiafico, S. rcompanion: Functions to Support Extension Education Program Evaluation. (2020).
87. Fawcett, T. An introduction to ROC analysis. Pattern Recogn. Lett. 27, 861–874 (2006).
88. Huang, J. & Ling, C. X. Using AUC and accuracy in evaluating learning algorithms. IEEE Trans. Knowl. Data Eng. 17, 299–310
(2005).
89. Friendly, M. A brief history of the mosaic display. J. Comput. Graph. Stat. 11, 89–107 (2002).
90. McDonald, J. H. Handbook of Biological Statistics. 3rd ed. (Sparky House Publishing, 2014).
91. ESRI. ArcGIS 10.7. (2019).
Scientific Reports | (2021) 11:2111 | https://doi.org/10.1038/s41598-021-81073-2 12
Vol:.(1234567890)www.nature.com/scientificreports/
Acknowledgements
We thank Myriam Velázquez and Fredy Ramírez Pinto of the Fundación Moisés Bertoni for logistical assistance,
the forest guards from the Reserva Natural Tapytá for their assistance throughout the data collection, and Karen
Neris for assistance with permits. We also thank Damian Gonzalez, Aide Balcazar, and Bailey Holifield for assis-
tance with lab work which helped to identify specimens. All research followed the laws of Paraguay and were
approved by IACUC of Rhodes College and the Secretaría del Ambiente (SEAM), Paraguay. Funding for the
field study and glucocorticoid assays was provided to S. A. B. by Rhodes College. Additional partial funding was
provided to N. D. L. S. by Granier Bioinformatics Center at the Field Museum. We also thank two anonymous
reviewers for comments that helped improved the manuscript.
Author contributions
S.A.B. designed the research, collected data, analyzed data, and wrote the manuscript. N.D.L.S. designed the
research, collected data, analyzed data, and wrote the manuscript. P.P. collected data, analyzed data, and wrote
the manuscript. D.K. designed the research, collected data, analyzed data, and wrote the manuscript. All authors
reviewed the manuscript.
Competing interests
The authors declare no competing interests.
Additional information
Supplementary Information The online version contains supplementary material available at https://doi.
org/10.1038/s41598-021-81073-2.
Correspondence and requests for materials should be addressed to S.A.B.
Reprints and permissions information is available at www.nature.com/reprints.
Publisher’s note Springer Nature remains neutral with regard to jurisdictional claims in published maps and
institutional affiliations.
Open Access This article is licensed under a Creative Commons Attribution 4.0 International
License, which permits use, sharing, adaptation, distribution and reproduction in any medium or
format, as long as you give appropriate credit to the original author(s) and the source, provide a link to the
Creative Commons licence, and indicate if changes were made. The images or other third party material in this
article are included in the article’s Creative Commons licence, unless indicated otherwise in a credit line to the
material. If material is not included in the article’s Creative Commons licence and your intended use is not
permitted by statutory regulation or exceeds the permitted use, you will need to obtain permission directly from
the copyright holder. To view a copy of this licence, visit http://creativecommons.org/licenses/by/4.0/.
© The Author(s) 2021
Scientific Reports | (2021) 11:2111 | https://doi.org/10.1038/s41598-021-81073-2 13
Vol.:(0123456789)You can also read